The effect of glazing and aging on the surface properties of CAD/CAM resin blocks
Neslihan Tekçe1*, Sinan Fidan2, Safa Tuncer3, Dilan Kara1, Mustafa Demirci3
1Department of Restorative Dentistry, Faculty of Dentistry, Kocaeli University, Kocaeli, Turkey
2Department of Airframe & Powerplant, Faculty of Aeronautics and Astronautics, Kocaeli University, Kocaeli, Turkey
3Department of Restorative Dentistry, Faculty of Dentistry, Istanbul University, Istanbul, Turkey
PURPOSE. To investigate the effect of accelerated aging on surface properties of glazed CAD/CAM resin blocks using a 2D surface profilometer and a 3D non-contact optical profilometer. MATERIALS AND METHODS. Three types of CAD/CAM resin restorative materials, LAVA Ultimate (3M ESPE, St Paul, MN, USA), VITA Enamic (Vita Zahnfabrik H. Rauter, Bad Säckingen, Germany), and Cerasmart (GC Corparation, Tokyo, Japan) were used for this study. CAD/CAM blocks were cut in 3-mm thickness slabs and divided into three groups; Group 1: control group (specimens polished with 600 grit SCI paper); Group 2: specimens sandblasted, silanized, and glazed with Optiglaze Color (GC); Group 3: glazed specimens subjected to 5000 thermocycles (n=15). The surface roughness (Ra and Rz) was evaluated using a profilometer and a 3D scanning instrument. Data were analyzed using two- way ANOVA and Tukey’s post- hoc test (P<.05). RESULTS. LAVA, VITA, and Cerasmart exhibited statistically similar Ra and Rz values for each group (P>.05). For VITA and Cerasmart, the specimens in Group 1 exhibited significantly higher Ra values than Group 2 (P<.05). Group 1 (0.502 Ra), Group 2 (0.384 Ra), and Group 3 (0.431 Ra) exhibited statistically similar Ra values for LAVA (P=.062). After 5000 thermocycles, surface roughness values did not change significantly for glazed LAVA, VITA, and Cerasmart (P>.05). CONCLUSION. Glaze material Optiglaze Color makes CAD/CAM resin surfaces smooth and glazed CAD/CAM surfaces seem resistant to deterioration under 5000 thermocycles. [J Adv Prosthodont 2018;10:50-7]
KEYWORDS: CAD/CAM restoratives; Sandblasting; Optiglaze color; Surface roughness
INTRODUCTION
Computer-aided design/computer-aided manufacturing (CAD/CAM) advancements were introduced during the 1970s and have only been available for routine dental prac- tice since 1990.1 However, interest in CAD/CAM technolo- gy has increased sharply over the last few years2,3 and nowa- days, a large-scale class of indirect materials are represent- ed.4 CAD/CAM materials have several advantages such as biocompatibility, durability, and esthetics, reduced clinical
steps, shorter production runtime, and lower cost.5,6 These systems can be used to construct inlays, onlays, crowns, and veneers. There are currently two main groups for CAD/
CAM materials; ceramics and composites. Composite restor- ative materials have some advantages compared with ceram- ics, and ceramics have some advantages over composites.
Composite-incorporating materials are more compliant and soft, have easy finishing and polishing properties, and are less abrasive for opposite teeth, although they experience high wear.5 On the other hand, ceramic restorations with esthetic properties are superior to composite materials.
Additionally, ceramics are more wear resistant, biocompati- ble, and discoloration resistant.6,7
Surface roughness in restorations may cause plaque accu- mulation and discoloration on restorative materials.8-10 It is reported that surface irregularities that form on the restora- tion as a result of a successful finishing and polishing pro- cess are smaller than the average bacterial diameter so that bacterial adhesion should be prevented.10 A rough surface may cause adhesion of bacteria to restorative material8,11,12 and secondary caries. A rough restoration may also cause
Corresponding author:
Neslihan Tekçe
Department of Restorative Dentistry, Faculty of Dentistry, Kocaeli University, Yuvacık Yerleşkesi, Başiskele, Kocaeli 41190, Turkey Tel. +902623442222: e-mail, [email protected]
Received April 26, 2017 / Last Revision July 4, 2017 / Accepted July 11, 2017
© 2018 The Korean Academy of Prosthodontics
This is an Open Access article distributed under the terms of the Creative Commons Attribution Non-Commercial License (http://creativecommons.
org/licenses/by-nc/3.0) which permits unrestricted non-commercial use, distribution, and reproduction in any medium, provided the original work is properly cited.
dental abrasions for antagonist teeth. Furthermore, surface roughness can affect the fracture resistance of materials causing micro-crack creation and propagation on restorative materials.13,14 In general, 0.3 Ra surface roughness values on restoration surfaces are clinically acceptable.11 Polishing pro- cesses can create smooth surfaces with maximum bend strength and minimal risk of cracking and fracture in CAD/
CAM restorations.13-16 Therefore, accomplishing a smooth surface for restorations is critical for patient satisfaction, as well as for esthetic and natural reasons.8,9,17,18
Therefore, during milling and finishing procedures, a rough surface may be produced and this roughness may cause surface flaws and reduce strength of restorative mate- rials. Various techniques such as glazing have been proposed to strengthen restoratives after surface flaws have been introduced.13 Laboratory and clinical data are highly needed because composite CAD/CAM blocks are new materials.
Therefore, the surface structure of three different CAD/
CAM resin blocks were investigated in this study, in particu- lar to assess the effect of glaze material on surface topogra- phy of CAD/CAM system and the effect of thermocycles on their surface roughness. Our hypotheses were 1) Glazing does not affect surface properties of CAD/CAM resin restoratives; 2) Thermocycles deteriorate glazed CAD/CAM surfaces.
MATERIALS AND METHODS
Three CAD/CAM resin blocks; LAVA Ultimate CAD/
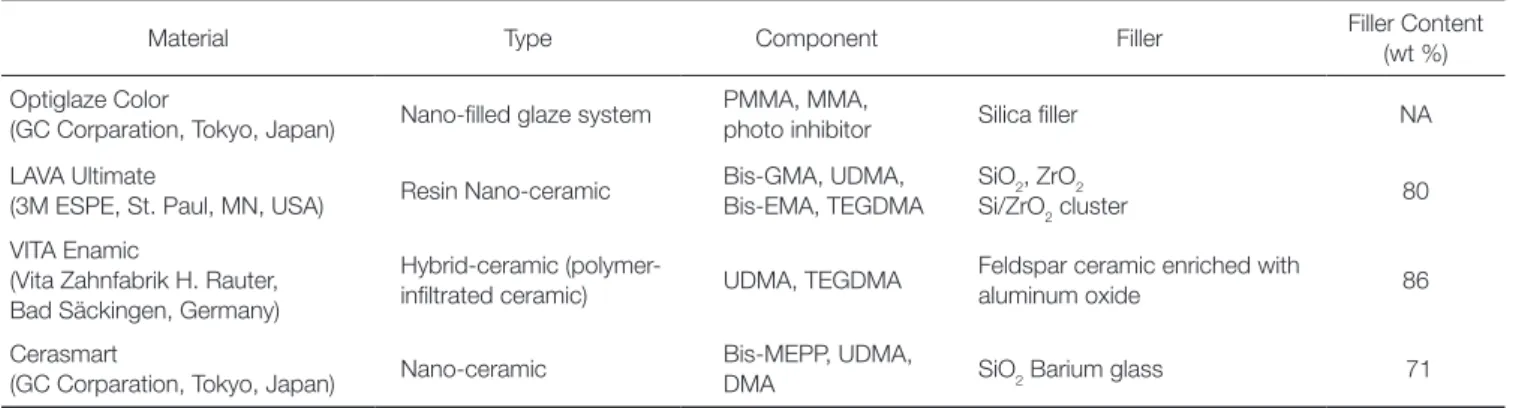
CAM restorative (3M ESPE, St. Paul, MN, USA), VITA Enamic (Vita Zahnfabrik H. Rauter, Bad Säckingen, Germany), and Cerasmart (GC Corporation, Tokyo, Japan) were used in this study. The manufacturers and composi- tions are shown in Table 1.
A total of 45 CAD/CAM block sections (3-mm thick- ness) were prepared for surface roughness measurements, (n
= 15 specimens for each CAD/CAM block) and 9 block
sections were prepared for 3D images using a slow-speed diamond saw (Isomet 1000, Buehler, Lake Bluff, IL, USA).
The top surface of the sectioned slices was polished with 600 grit SiC papers for 60 seconds under running water.
The specimens were then divided into three groups for sur- face roughness measurements (n = 15);
Group 1: Control group (600 SiC grinding).
Group 2: The specimens were sandblasted with Al2O3 (mean particle size 50 μm) (Renfert GmbH, 78247, Hilzingen, Germany) using a sandblaster machine (Basic Eco, Renfert GmbH, 78247, Hilzingen, Germany) at 2.5 bars pressure approximately 10 mm from the composite surface for 10 seconds. After this procedure, all samples were washed using air-water spray, cleaned in distilled water in an ultra- sonic bath for 5 minutes, and finally air dried. After sand- blasting, all specimens were silanized with G-Multi PRIMER (GC) for 30 seconds and air dried. Following silanization, Optiglaze Color (GC Corporation, Tokyo, Japan) was applied on all specimens according to the manufacturer’s instruc- tions. Specimens were then placed in a Labolight Duo (GC) indirect composite light oven and specimens were polymer- ized for 10 minutes Surface roughness measurements and 3D images were obtained again following polymerization.
Group 3: After 24 hours, three different CAD/CAM specimens were subjected to 5000 thermocycles between 5°
- 55°C with 30 seconds dwell time. Surface roughness values of specimens and 3D images were obtained again following thermocycling.
The surface roughness of specimens was measured using a 2-dimensional profilometer (Surtronic S128, Taylor Habson Ltd., Leicester, England) with a 5-µm diamond stylus angled at 90º. Starting from the midpoint of each specimen, 5 mea- surements were taken in different directions, with a cut-off length of 0.8 mm and measuring length of 4 mm, and the average roughness value for each specimen was then calcu- lated and recorded (Ra and Rz values, in µm, Fig. 1).19
To determine the surface morphology and roughness
Table 1. Materials used in this study
Material Type Component Filler Filler Content
(wt %) Optiglaze Color
(GC Corparation, Tokyo, Japan) Nano-filled glaze system PMMA, MMA,
photo inhibitor Silica filler NA
LAVA Ultimate
(3M ESPE, St. Paul, MN, USA) Resin Nano-ceramic Bis-GMA, UDMA, Bis-EMA, TEGDMA
SiO2, ZrO2
Si/ZrO2 cluster 80
VITA Enamic
(Vita Zahnfabrik H. Rauter, Bad Säckingen, Germany)
Hybrid-ceramic (polymer-
infiltrated ceramic) UDMA, TEGDMA Feldspar ceramic enriched with
aluminum oxide 86
Cerasmart
(GC Corparation, Tokyo, Japan) Nano-ceramic Bis-MEPP, UDMA,
DMA SiO2 Barium glass 71
PMMA; Poly methyl methacrylate; MMA: Methyl methacrylate; Bis-GMA: Bisphenol A glycidyl methacrylate; UDMA: Urethane dimethacrylate; Bis-EMA: Bisphenol A polyethethylene glycol diether dimethacrylate; TEGDMA: Triethylene glycol dimethacrylate; Bis-MEPP: 2,2-Bis (4-methacryloxypolyethoxyphenyl) propane; DMA:
Dimethacrylate.
parameters of samples, a Nanovea 3D Non-Contact Profilometer PS50 (Nanovea, 6 Morgan Ste 156, Irvine, CA, USA) was used. The non-contact laser profilometer has a leading edge optical pen that uses superior white light axial chromatism. A 2 × 2 mm square area was used for rough- ness analyses. The scanning process was accomplished in steps of 20 µm in both X and Y directions with 0.1 mm/s velocity. 3D surface topographies and profile roughness evaluations were realized using Mountain Software Version 6.2.7487 (Digital Surf). Profile roughness lines were taken from 3D scanned surfaces. In order to calculate the profile lines, 10 repetitions for each measurement were performed
and the median values were used (Fig. 2). Surface profile lines 0.2 mm apart were taken and percentage error calcula- tions were made for every sample.
All statistical analyses were performed using IBM SPSS for Windows version 20.0 (SPSS, Chicago, IL, USA). Kolmogorov- Smirnov tests were used to test the normality of data distri- bution. Normally distributed continuous variables were expressed as mean ± standard deviation. Differences between the groups and materials were analyzed using two-way ANOVA and Tukey’s post-hoc test. P < .05 was considered statistically significant.
Fig. 1. Illustration of surface roughness parameters.
Fig. 2. Illustration of obtaining profile roughness lines from 3D scanned surfaces.
Ten repetitions were performed for each measurement and the median value was accepted as the profile image.
RESULTS
Surface roughness values (Ra and Rz values, in µm) are pre- sented in Table 2 and Table 3. After SiC paper grinding, sur- face roughness Ra values for LAVA, VITA, and Cerasmart were found as 0.502, 0.584, and 0.490, respectively; all were found statistically similar (P = .141). In groups 2 and 3, LAVA, VITA, and Cerasmart exhibited statistically similar Ra values (P = .540 for VITA and P = .617 for Cerasmart).
A comparison between groups showed that group 1 (0.502 Ra), group 2 (0.384 Ra), and group 3 (0.431 Ra) exhib- ited statistically similar Ra values for LAVA CAD/CAM restorative (P = .62). For VITA, group 2 (0.402 Ra) and group 3 (0.396 Ra) had statistically lower Ra values than group 1 (0.584 Ra) (P = .001). For Cerasmart, group 2 (0.358 Ra) had statistically lower Ra values than group 1 (0.490 Ra) (P = .026).
After glazing, the mean Ra values decreased for each CAD/CAM restorative, but only significantly for VITA and Cerasmart. After 5000 thermocycles (group 3), surface roughness values did not significantly change compared with group 2 (glazed LAVA, VITA, and Cerasmart) (P >
.05).
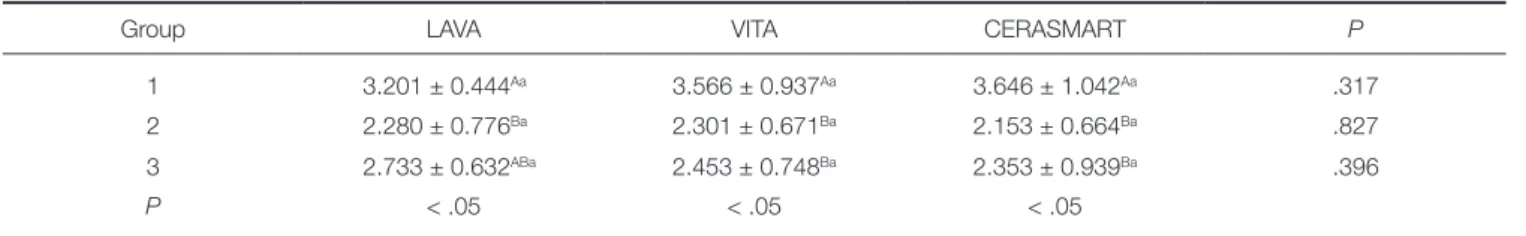
According to Rz results, LAVA, VITA, and Cerasmart exhibited statistically similar results for group 1 (P = .317), group 2 (P = .827), and for group 3 (P = .396). For LAVA, the specimens in group 1 exhibited significantly higher Rz values than group 2 (P < .05). For VITA and Cerasmart, the specimens in group 1 exhibited significantly higher Rz val- ues than group 2 and group 3 (P < .05). The specimens in group 2 and group 3 exhibited statistically similar Rz values
for the three CAD/CAM restoratives (P < .05).
After SiC paper grinding, CAD/CAM restorative surfac- es had the largest surface irregularities with concentrated sharp peaks and valleys. Surface roughness or irregularities of LAVA (Fig. 3A) were found higher than VITA (Fig. 3B) and Cerasmart (Fig. 3C). LAVA displayed a rough surface in a small area (Fig. 3A). The surface topography of VITA exhibited smooth in general and surface roughness increased in very small fields (Fig. 3B). For Cerasmart, surface irregu- larities showed variability with deep scratches, concentrated sharp peaks and valleys (Fig. 3C).
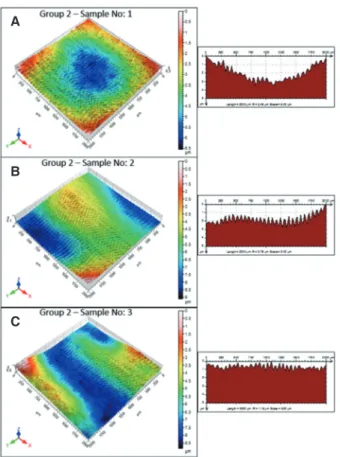
After Optiglaze color application (group 2), some irreg- ularities and waving were observed on the surface with some concentrated peaks and valleys on the specimens of LAVA, VITA, and Cerasmart (Fig. 4). Surface roughness was moderate in some regions but decreased in others (Fig.
4). LAVA exhibited slightly less irregularity (Fig. 4A), fol- lowed by VITA and Cerasmart, respectively (Fig. 4B, 4C).
In thermocycled specimens (group 3), surface irregulari- ties of CAD/CAM blocks showed concentrated peaks and valleys (Fig. 5). LAVA and VITA also exhibited slightly less irregularity than Cerasmart (Fig. 5). Surface irregularities of LAVA specimens showed variability. Surface roughness increased from slight to moderate and included excessive roughness in small areas in the form of islets (Fig. 5A).
Only in a small area, VITA showed roughness from slight to moderate in a small islet shape (Fig. 5B). Cerasmart showed very variable surface irregularities (Fig. 5C). Surface rough- ness changed from slight to excessive. In some areas, mod- erate and slight roughness in the form of islets or peaks were also seen.
Table 2. Surface roughness values (Ra, μm) (mean ± SD of the groups (n = 15))
Group LAVA VITA CERASMART P
1 0.502 ± 0.135Aa 0.584 ± 0.132Aa 0.490 ± 0.144Aa .141
2 0.384 ± 0.097Aa 0.402 ± 0.114Ba 0.358 ± 0.112Ba .540
3 0.431 ± 0.144Aa 0.396 ± 0.131Ba 0.386 ± 0.126ABa .617
P .062 .001 .026
Means followed by different lowercase letter in the row and different uppercase letter in the column are statistically significant different (P < .05).
Table 3. Surface roughness values (Rz, μm) (mean ± SD of the groups (n = 15))
Group LAVA VITA CERASMART P
1 3.201 ± 0.444Aa 3.566 ± 0.937Aa 3.646 ± 1.042Aa .317
2 2.280 ± 0.776Ba 2.301 ± 0.671Ba 2.153 ± 0.664Ba .827
3 2.733 ± 0.632ABa 2.453 ± 0.748Ba 2.353 ± 0.939Ba .396
P < .05 < .05 < .05
Means followed by different lowercase letter in the row and different uppercase letter in the column are statistically significant different (P < .05).
DISCUSSION
Our first hypothesis; “Glazing does not affect surface prop- erties of CAD/CAM resin restoratives” is rejected. After the glaze procedure, surface roughness values of each CAD/CAM restorative decreased and 3D surface topogra- phy was improved. Our second hypothesis “Thermocycles deteriorate glazed CAD/CAM surfaces” is also rejected.
After 5000 thermocycles, surface roughness values of glazed CAD/CAM restoratives did not change significantly.
Slight changes of surface properties of glazed CAD/CAM restoratives after 5000 thermal cycles were found on 3D images; however, they were negligible. Surface roughness is an important parameter for the clinical success of restor- atives. A smooth surface provides comfort for patients and is important for the longevity of tooth-restoration integrity.
The glaze procedure is the last step in the construction of CAD/CAM restoratives. Optiglaze Color is used as charac- terization material for direct and indirect composite materi- als, and it provides a smooth surface and wear resistance for restorations made of composite resin. Flury et al.20 reported that physicians should carefully finish and polish CAD/
CAM restoratives to decrease surface roughness and to improve mechanical properties (surface hardness, elastic modulus, and flexural strength) of CAD/CAM materials.
Fig. 3. 3D images of the specimens in group 1 (SiC paper grinding specimens). (A) LAVA, (B), VITA, (C) Cerasmart.
A
B
C
Fig. 5. 3D images of the specimens in group 3 (thermo- cycled specimens). (A) LAVA, (B), VITA, (C) Cerasmart.
A
B
C
Fig. 4. 3D images of the specimens in group 2 (glazed specimens with Optiglaze Color). (A) LAVA, (B), VITA, (C) Cerasmart.
A
B
C
Roughness is a key factor in evaluating surface-oriented scientific research such as polishing, wear, and degradation.
In order to achieve a reliable analysis of surface quality and topography, using high-resolution surface roughness mea- surement techniques such as a non-contact laser profilome- ter is preferable. The development of laser technologies and computer analysis programs has made it possible to mea- sure the surface roughness of materials using a non-contact method; white light induced by a laser source emitted by the optical pen to the sample surface and reflected from the surface. Surface analysis is performed using both sent and reflected light using program algorithms. Surface evaluation was achieved using a special program called Mountains 3D in this study. Thus, in this study, sample surfaces were scanned in 3D with a non-contact profilometer. From the surface scanning, besides gaining 3D surface topography maps, other important parameters such as Ra (arithmetic mean roughness) and Rz (mean roughness). Rz can be defined as the distance between maximum peak heights (Rp) and maximum valley depth (Rv). These roughness measure- ment parameters are schematically shown in Fig. 1. 3D roughness analysis was accomplished according to ISO 25178. Extracted profile line roughness parameters such as Ra were performed according to ISO 4287.
Bottino et al.21 reported that ceramics should always be polished to produce a smoother clinical surface. They glazed ceramic surfaces with Akzent 24 (VITA Zahnfabrik) and found 0.94 Ra surface roughness values. They showed that the smoothest ceramic surfaces were obtained after glazing.
Perez et al.22 examined the effect of a glaze/composite seal- ant on the 3D surface roughness of esthetic restorative materials and showed that glaze material BisCover was capa- ble of reducing surface roughness and provided polished surfaces for all materials (Filtek Supreme, Grandio and Vitremer). The authors attributed the dissimilarity in surface roughness of the materials to differences in their size and content of the filler particles. Al-Wahadni23 reported that regardless of the type of ceramic tested (IPS Empress or In-Ceram Alumina/Vita-dur Alpha) or pretreatment, any adjusted ceramic restoration should be glazed or subjected to finishing and polishing procedures. In agreement with Al-Wahadni,23 we found unglazed CAD/CAM surfaces were rougher than glazed surfaces.
Generally, dental technicians perform glaze procedures for many types of indirect restorations. However, together with the development of the CAD/CAM system, clinical application stages have started to decrease. Accordingly, after completion of the construction of a CAD/CAM res- toration, physicians also wanted to eliminate the glaze stage.
At this stage, clinically easy-to-use glaze materials entered clinical routine. Practitioners can easily apply sandblasting, silanization, and glaze by themselves. However, there is a lack of in vivo and in vitro studies related to the effectiveness of these glaze materials, especially on current CAD/CAM restoratives. Cilli et al.24 examined the role of surface sealant materials (glaze material for composites) on surface rough- ness of traditional composites after a simulated tooth
brushing test. They revealed that glazed composites pre- sented superior performance when compared with unglazed or unsealed composites. Dede et al.25 examined a conven- tional polishing system and three different glazed materials (Palaseal, Optiglaze, BisCover) on composite discs. The authors subjected specimens to 3000 thermocycles and measured surface roughness values using a profilometer and found that glaze techniques significantly improved the sur- face roughness of the tested composite resins. Sahin et al.26 examined the surface roughness values of Optiglaze-applied specimens (denture teeth) before and after 3000 thermocy- cles and reported that Optiglaze provided smooth and col- or-stable surfaces.
One of the aims of this study was to examine the changes in surface properties of glazed CAD/CAM resin restoratives after 5000 thermocycles. According to the pro- filometer results, no significant changes were observed after 5000 thermocycles, although slight deteriorations were observed in the 3D surface examination. In our previous studies, we examined the effect of glaze material (Fortify Plus) and accelerated aging on posterior composite surfaces.
We found that rather than decreasing surface roughness val- ues with the application of a glaze material, these values actually increased with an additional slight increase follow- ing thermocycling (10,000 thermocycles).19 Flury et al.27 examined the effect of water storage on the surface rough- ness of CAD/CAM restoratives. They found that surface roughness and micromechanical properties were significant- ly influenced by CAD/CAM material, polishing system, and water storage. Flury et al. 27 reported that Lava Ultimate showed the lowest surface roughness values in 4 different CAD CAM blocks; Vitablocs Mark II, Paradigm MZ100, Vita Enamic, and Ambarino High-Class. Different from Flury et al.’s study, we found that LAVA, VITA, and Cerasmart exhibited statistically similar Ra results after SiC paper grinding, after glaze application, and after 5000 ther- mocycles. Tuncer et al.28 examined the effect of thermocy- cles on seven different composite materials. They reported that 10 000 thermocycles did not significantly affect the sur- face roughness values of the composites. Hahnel et al.29 examined the aging behavior of dental composites with regard to surface roughness after 7, 90, and 365 days or 2 × 3000 thermocycles. They reported that the composite mate- rial itself, the aging duration and, in part, the aging medium, all had a decisive influence on the mechanical properties of dental composites. They correlated the decreasing mechani- cal properties of composites with repeated temperature changes and degradation of matrix-filler bonds due to the different thermal expansion coefficients of fillers and the resin matrix. Different from light-curing composites, polym- erization processes of CAD/CAM resin blocks become high-performance industrial polymerization involving high temperature and high pressure. Thus, a higher degree of conversion is obtained and more homogeneous polymeriza- tion is provided and the amount of internal defects decrease in CAD/CAM resin restoratives.30 Also, CAD/CAM resin materials generally incorporate urethane dimethacrylate
(UDMA) instead of bisphenol A glycidyl methacrylate (Bis- GMA). UDMA shows higher degree of conversion and dis- plays lower water sorption than Bis GMA.31,32 Therefore, mechanical properties of CAD/CAM resin materials enhanced according to light-curing composite materials.
Optiglaze is a low-viscosity resin with filler. Filler is add- ed into the material to improve the mechanical properties of the glaze. It was observed in this study that although the surface of materials is smooth, the general view of the material exhibits slight waving on CAD/CAM surfaces.
Optiglaze propagates and spreads simultaneously on CAD/
CAM surfaces. The slight waving on CAD/CAM surfaces may be related to two causes. One may be related to the sandblasting procedure. Sandblasting can damage CAD/
CAM surfaces33 and may create micro or macro pits and deep cavities on CAD/CAM surfaces. Even though the glaze fills these gaps and spreads onto the material surface, there may be a general topographic deterioration. Another reason for glaze waving may be related to the filler content of Optiglaze. The filler content of Optiglaze may make it viscous and this might be an obstacle to a homogeneous spread on CAD/CAM surfaces.
CONCLUSION
To conclude, LAVA, VITA, and Cerasmart exhibited similar surface roughness values for each group. Glazed CAD/CAM surfaces are more advanced and smooth compared with non-glazed surfaces. All materials used in this study seem to be durable against 5000 thermocycles. The 3D optical pro- filometer gives more detailed information related to CAD/
CAM surfaces and properly reflected all specifications.
ORCID
NeslihanTekçe https://orcid.org/0000-0002-5447-3159 Sinan Fidan https://orcid.org/0000-0003-4385-4981 REFERENCES
1. Duret F, Preston JD. CAD/CAM imaging in dentistry. Curr Opin Dent 1991;1:150-4.
2. van Noort R. The future of dental devices is digital. Dent Mater 2012;28:3-12.
3. Conrad HJ, Seong WJ, Pesun IJ. Current ceramic materials and systems with clinical recommendations: a systematic re- view. J Prosthet Dent 2007;98:389-404.
4. Mainjot AK, Dupont NM, Oudkerk JC, Dewael TY, Sadoun MJ. From artisanal to CAD-CAM blocks: State of the art of indirect composites. J Dent Res 2016;95:487-95.
5. Ruse ND, Sadoun MJ. Resin-composite blocks for dental CAD/CAM applications. J Dent Res 2014;93:1232-4.
6. Coldea A, Swain MV, Thiel N. Mechanical properties of poly- mer-infiltrated-ceramic-network materials. Dent Mater 2013;
29:419-26.
7. Blatz MB. Long-term clinical success of all-ceramic posterior restorations. Quintessence Int 2002;33:415-26.
8. Kawai K, Urano M, Ebisu S. Effect of surface roughness of porcelain on adhesion of bacteria and their synthesizing glu- cans. J Prosthet Dent 2000;83:664-7.
9. Yilmaz C, Korkmaz T, Demirköprülü H, Ergün G, Ozkan Y.
Color stability of glazed and polished dental porcelains. J Prosthodont 2008;17:20-4.
10. Weitman RT, Eames WB. Plaque accumulation on composite surfaces after various finising procedures. J Am Dent Assoc 1975;91:101-6.
11. Jones CS, Billington RW, Pearson GJ. The in vivo perception of roughness of restorations. Br Dent J 2004;196:42-5.
12. Ikeda M, Matin K, Nikaido T, Foxton RM, Tagami J. Effect of surface characteristics on adherence of S. mutans biofilms to indirect resin composites. Dent Mater J 2007;26:915-23.
13. de Jager N, Feilzer AJ, Davidson CL. The influence of sur- face roughness on porcelain strength. Dent Mater 2000;16:
381-8.
14. Fischer H, Schäfer M, Marx R. Effect of surface roughness on flexural strength of veneer ceramics. J Dent Res 2003;82:
972-5.
15. Anusavice KJ, Shen C, Vermost B, Chow B. Strengthening of porcelain by ion exchange subsequent to thermal tempering.
Dent Mater 1992;8:149-52.
16. Anusavice KJ, Kakar K, Ferree N. Which mechanical and physical testing methods are relevant for predicting the clini- cal performance of ceramic-based dental prostheses? Clin Oral Implants Res 2007;18:218-31.
17. Jefferies SR. Abrasive finishing and polishing in restorative dentistry: a state-of-the-art review. Dent Clin North Am 2007;51:379-97.
18. Antonson SA, Yazici AR, Kilinc E, Antonson DE, Hardigan PC. Comparison of different finishing/polishing systems on surface roughness and gloss of resin composites. J Dent 2011;39:e9-17.
19. Tekçe N, Pala K, Tuncer S, Demirci M. The effect of surface sealant application and accelerated aging on posterior restor- ative surfaces: An SEM and AFM study. Dent Mater J 2017;
36:182-9.
20. Flury S, Peutzfeldt A, Lussi A. Influence of surface rough- ness on mechanical properties of two computer-aided de- sign/computer-aided manufacturing (CAD/CAM) ceramic materials. Oper Dent 2012;37:617-24.
21. Bottino MC, Valandro LF, Kantorski KZ, Bressiani JC, Bottino MA. Polishing methods of an alumina-reinforced feldspar ceramic. Braz Dent J 2006;17:285-9.
22. Perez Cdos R, Hirata RJ, da Silva AH, Sampaio EM, de Miranda MS. Effect of a glaze/composite sealant on the 3-D surface roughness of esthetic restorative materials. Oper Dent 2009;34:674-80.
23. Al-Wahadni A. An in vitro investigation into the surface roughness of 2 glazed, unglazed, and refinished ceramic ma- terials. Quintessence Int 2006;37:311-7.
24. Cilli R, de Mattos MC, Honorio HM, Rios D, de Araujo PA, Prakki A. The role of surface sealants in the roughness of composites after a simulated toothbrushing test. J Dent 2009;
37:970-7.
25. Dede DÖ, Şahin O, Koroglu A, Yilmaz B. Effect of sealant
agents on the color stability and surface roughness of nano- hybrid composite resins. J Prosthet Dent 2016;116:119-28.
26. Şahin O, Dede DÖ, Köroğlu A, Yılmaz B. Influence of sur- face sealant agents on the surface roughness and color stabili- ty of artificial teeth. J Prosthet Dent 2015;114:130-7.
27. Flury S, Diebold E, Peutzfeldt A, Lussi A. Effect of artificial toothbrushing and water storage on the surface roughness and micromechanical properties of tooth-colored CAD-CAM materials. J Prosthet Dent 2017;117:767-74.
28. Tuncer S, Demirci M, Tiryaki M, Unlü N, Uysal Ö. The effect of a modeling resin and thermocycling on the surface hard- ness, roughness, and color of different resin composites. J Esthet Restor Dent 2013;25:404-19.
29. Hahnel S, Henrich A, Bürgers R, Handel G, Rosentritt M.
Investigation of mechanical properties of modern dental composites after artificial aging for one year. Oper Dent 2010;35:412-9.
30. Nguyen JF, Migonney V, Ruse ND, Sadoun M. Resin compos- ite blocks via high-pressure high-temperature polymerization.
Dent Mater 2012;28:529-34.
31. Sideridou I, Tserki V, Papanastasiou G. Effect of chemical structure on degree of conversion in light-cured dimethacry- late-based dental resins. Biomaterials 2002;23:1819-29.
32. Sideridou ID, Karabela MM. Sorption of water, ethanol or ethanol/water solutions by light-cured dental dimethacrylate resins. Dent Mater 2011;27:1003-10.
33. Yoshihara K, Nagaoka N, Maruo Y, Nishigawa G, Irie M, Yoshida Y, Van Meerbeek B. Sandblasting may damage the surface of composite CAD-CAM blocks. Dent Mater 2017;
33:e124-e135.