INTRODUCTION
Sexual well-being is essential for a satisfactory sex- ual life and is closely related to the physical, mental, and social well-being of a person. In 2002, the World Health Organization (WHO) described sexual health as
“a state of physical, emotional, mental, and social well- being related to sexuality; it is not merely the absence of disease, dysfunction, or infirmity” [1]. To achieve sex- ual health as per the WHO and establish relevant poli- cies and practices, updated population data on sexual attitude and behavior are necessary.
Received: Oct 15, 2019 Revised: Dec 23, 2019 Accepted: Jan 12, 2020 Published online Feb 20, 2020 Correspondence to: Du Geon Moon https://orcid.org/0000-0002-9031-9845
Department of Urology, Korea University Guro Hospital, 148 Gurodong-ro, Guro-gu, Seoul 08308, Korea.
Tel: +82-2-2626-3201, Fax: +82-2-2626-1321, E-mail: [email protected] Copyright © 2021 Korean Society for Sexual Medicine and Andrology
Analysis of Sexual Behaviors among Adults in
Korea: Results from the “Korean National Survey on Sexual Consciousness”
Sun Tae Ahn1 , Jong Wook Kim1 , Hong Seok Park1 , Hyun Jung Kim2 , Heung Jae Park3 , Hyeong Sik Ahn2 , Sung Won Lee3 , Du Geon Moon1
Departments of 1Urology and 2Preventive Medicine, Korea University College of Medicine, 3Department of Urology, School of Medicine, Sungkyunkwan University, Seoul, Korea
Purpose:
Purpose: This study aimed to understand the characteristics of sexual behaviors among Korean adults to facilitate the devel- opment of strategies and policies focused on sexual health in groups categorized by sociodemographic characteristics.
Materials and Methods:
Materials and Methods: A nationally representative probability sample of 2,500 individuals (1,273 men and 1,227 women) aged 18–69 years obtained using a stratified multiple-stage sampling method based on Statistics Korea (KOSTAT) participated in a cross-sectional online survey. The survey consisted of structured questionnaires comprising questions on demographic information, lifetime sexual behavior, and sexual behavior in the previous 12 months.
Results:
Results: The mean age at first sexual intercourse was lower in men than in women (21.9±4.4 vs. 24.1±4.4 years, p=0.001).
The overall prevalence rate of sexual events with casual partners within previous 12 months was 13.1% (95% confidence interval [CI], 11.6%–14.5%). It was found to more commonly exist among lower age groups and men. The overall regu- lar condom use rates with relationship partner and casual partner were 14.8% (95% CI, 13.2%–16.4%) and 39.6% (95%
CI, 33.9%–45.3%), respectively. Condom use rate with casual partners among 20s and 30s men was 51.2%. Overall, only 10.4% of the respondents had received sexual education about sexually transmitted infections.
Conclusions:
Conclusions: This study provided contemporary sexual behaviors in Korean adults, and identified socio-demographic factors that seem to influence sexual behaviors. Low condom use rates and low rate of receiving sexual education were concerns.
The result of this study would be useful to health professionals to formulate policies and strategies related to sexual health.
Keywords:
Keywords: Adults; Probability sample; Sexual behavior; Sexual health; South Korea
This is an Open Access article distributed under the terms of the Creative Commons Attribution Non-Commercial License (http://creativecommons.org/licenses/by-nc/4.0) which permits unrestricted non-commercial use, distribution, and reproduction in any medium, provided the original work is properly cited.
pISSN: 2287-4208 / eISSN: 2287-4690 World J Mens Health 2021 Apr 39(2): 366-375 https://doi.org/10.5534/wjmh.190137
Health promotion, disease prevention, and lifestyle
Unlike Western countries, discussing sexual behav- iors has been a taboo in Korea, causing a lack of stud- ies on sexual behavior. Public awareness about sexually transmitted infections (STIs) and human immunodefi- ciency virus/acquired immune deficiency syndrome has changed dramatically in Korea in the last three de- cades [2], generating interest on human sexuality and sexual behavior. Moreover, sexual education had been included in the general health curriculum in many Korean schools since 2009 [3]. However, STI prevalence in Korea has gradually increased during the last few decades [4]. Although the reason for this has not been ascertained clearly, sexual behaviors related to early sexual debut, paid sex and condom usage have been speculated as causative factors [5]. Therefore, to frame national sexual health programs, sexual behavior data concerning the general population is critical. Re- cent surveys on sexual behavior included limited age groups and were conducted exclusively among males or females, or specifically investigated only high-risk groups. More importantly, most of these surveys were not performed nation-wide [6-10].
The most recent nationally representative survey of adult sexual behavior in Korea was conducted in 2001, as a part of the Global Study of Sexual Attitudes and Behaviors (GSSAB) [11,12]; however, it included only middle to old age groups (40–80 years). Many changes occurred in Korea in the last decade, potentially influ- encing sexual behavior. The widespread availability of medicines treating impotence has increased sexual ac- tivity among older adults [6], and easy internet access through smart phones has influenced sexual knowl- edge [13]. Therefore, updated national data represent- ing contemporary Korean sexual behavior is necessary to identify groups vulnerable to sexual diseases. This study was therefore conducted to obtain baseline data used in framing sexual health strategies and policies.
MATERIALS AND METHODS
1. Study design and subjects
This study was performed as a part of the Korean National Survey on Sexual Consciousness, from May 1, 2014 to March 1, 2015. A stratified probability sample from the South Korean population was used, adapt- ing a multi-stage stratification sampling method. The inclusion criterion was age between 18 and 69 years.
According to Statistics Korea (KOSTAT), in 2013,
37,665,188 individuals were aged 18–69 years, among whom 19,181,887 were males and 18,483,301 were fe- males. Initially, 2,500 study participants (1,273 males and 1,227 females) were considered. These national probability samples were stratified by region and gen- der distribution was based on population ratio. Each geographical sample was stratified into five 10-year age bands (18–19, 20–29, 30–39, 40–49, 50–59, and 60–
69 years), with teenagers representing the adolescent group.
After stratifying samples by gender, region, and age, we recruited participants randomly from a population of 300,000, using structured research panels from Neo Research & Solution (internet research company based in Seoul). The research panel was structured with the general population who agreed to participate in inter- net surveys. We randomly extracted 25,000 samples (10 times the designed sample) from this panel, as per the stratification design planned, and sent e-mails between November and December 2014, requesting them to visit the web portal. In the website, they were asked to participate in the survey and answer the study ques- tionnaire. All participants who answered the question- naires were paid 1,000 Korean Won as compensation.
2. Study variables
Socio-demographic data including age, gender, educa- tional level, marital status, and monthly family income were obtained from the questionnaires. Educational level was classified into three categories namely middle school or lower, high school or college, and university or higher. Marital status was classified into three groups: currently married, never married, and divorced or widowed.
History of sexual behavior and attitude, during life- time and for the previous 12 months were obtained, similar to other nationally representative studies on sexual behavior [14,15]. The questions on lifetime sexual behavior included experience (yes, no) of sexual inter- course and age during the first sexual intercourse. Re- garding sexual behavior in the previous 12 months, the participants were asked to specify (yes, no) each sexual behavior, including having a current relationship sex- ual partner (spouse or domestic partner, girlfriend/boy- friend, or significant other) and the history of sexual events with casual partners (transactional sex partner or speed dating partner). Regarding condom usage, par- ticipants were asked to choose the frequency of condom
usage with relationship partner and casual partners in the previous 12 months, and reasons for not using a condom. Frequency of condom usage was categorized as always/consistently, sometimes, and never/seldom.
Frequency of sexual intercourse was obtained from the number of sexual intercourses in the last month.
3. Statistical analysis
Frequency analysis was used to describe the subjects’
baseline socio-demographics. Descriptive analyses were used to summarize the overall, age, gender, education level and family income-specific variables. The chi- square test, independent t-test, and one-way analysis of variance (ANOVA) were conducted to assess the statistical significance of specific trends between men and women, across age groups, and socio-demographic characteristic groups, where applicable. To assess the predictors of sexual activity and experience of sexual events with casual partners, we conducted multiple regression analysis. The p<0.05 were considered to in- dicate statistical significance. Statistical analyses were performed using commercially available statistical software (IBM SPSS ver. 22.0; IBM Corp., Armonk, NY, USA).
4. Ethics statement
The purpose of the study was explained to all par- ticipants and informed consent was obtained. All data were self-reported by participants. This study was reviewed and approved by the Institutional Review Board (IRB) of the Korea University Guro Hospital, Korea (IRB No. 2015GR0057).
RESULTS
1. Participant characteristics
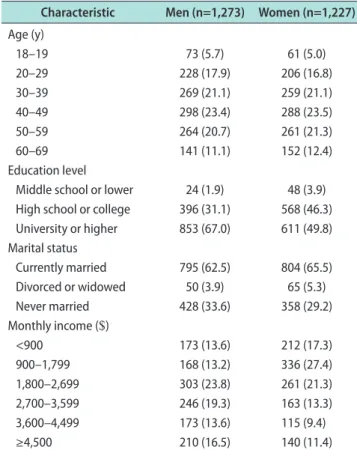
Totally, 2,500 participants (1,273 men and 1,227 wom- en) completed the survey. Table 1 shows the partici- pants’ demographic data including educational level, marital status, and monthly family income. The data closely matches the statistics of the Korean standard population (registered population) in the Korean Sta- tistical Information Service (KOSIS) of KOSTAT.
2. Lifetime sexual behaviors
1) Lifetime sexual intercourse experience
Fig. 1 presents data on the study population that had
experienced sexual intercourse at least once during lifetime. Totally 2,166 out of 2,500 participants (86.6%) had experienced sexual intercourse. The percentage of those with sexual intercourse experience was lower among teenagers and those in their 20s, than in other age groups, among both men and women. Among men, the higher education level and the higher income level groups showed a higher ratio of sexual intercourse ex- perience.
2) Age at first sexual intercourse
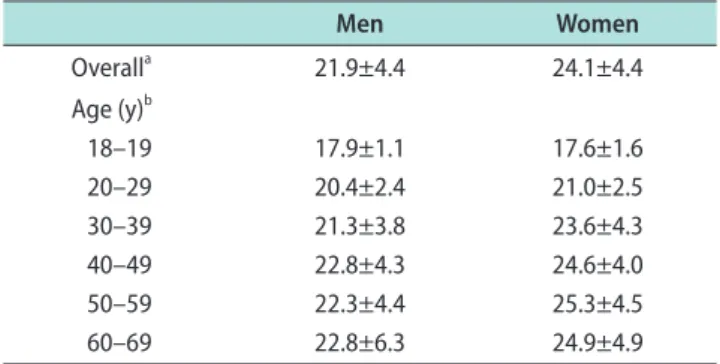
We analyzed the 2,166 subjects who had experienced sexual intercourse. The mean age during the first sexual intercourse, according to gender is presented in Table 2. This age was statistically significantly lower among males (independent t-test, p=0.001). In the below 30s age group, the age during the first sexual inter- course was lower in both gender and in the 40s and above age groups, the age at sexual initiation was simi- lar.
Table 1. Socio-demographic characteristics of 2,500 survey participants Characteristic Men (n=1,273) Women (n=1,227) Age (y)
18–19 73 (5.7) 61 (5.0)
20–29 228 (17.9) 206 (16.8)
30–39 269 (21.1) 259 (21.1)
40–49 298 (23.4) 288 (23.5)
50–59 264 (20.7) 261 (21.3)
60–69 141 (11.1) 152 (12.4)
Education level
Middle school or lower 24 (1.9) 48 (3.9) High school or college 396 (31.1) 568 (46.3) University or higher 853 (67.0) 611 (49.8) Marital status
Currently married 795 (62.5) 804 (65.5) Divorced or widowed 50 (3.9) 65 (5.3) Never married 428 (33.6) 358 (29.2) Monthly income ($)
<900 173 (13.6) 212 (17.3)
900–1,799 168 (13.2) 336 (27.4)
1,800–2,699 303 (23.8) 261 (21.3)
2,700–3,599 246 (19.3) 163 (13.3)
3,600–4,499 173 (13.6) 115 (9.4)
≥4,500 210 (16.5) 140 (11.4)
Values are presented as number (%).
3. History of sexual behavior during previous 12 months
Previous 12-month history of sexual behavior among the 2,166 respondents who had experienced sexual in- tercourse is presented in Table 3.
1) Currently having a regular sexual partner Among the 2,166 respondents who had experienced sexual intercourse, the proportion of those with a cur- rent sexual partner was lower in men than in women (82.6% vs. 87.6%). Higher education level and higher monthly income groups showed a higher proportion of respondents with a current sexual partner. Among the never married respondents, 51.8% currently had a sexual partner, and 31.3% of those divorced or widowed reported having a current sexual partner.
2) Prevalence of sexual events with casual partners The overall prevalence of sexual events with ca- sual partners was 13.1% (95% confidence interval [CI], 11.6%–14.5%). The frequency of sexual events with ca- sual partners, according to gender, age, education level, monthly income, and marital status is shown in Table 3.
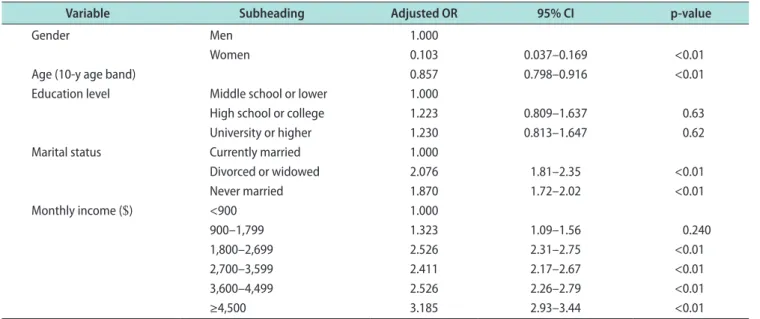
Currently sexually active men in their 20s and 30s and those in the high education, high monthly income, and the unmarried groups had a high prevalence of sexual events with casual partners. In multivariate analysis, males, people in the younger age group, those with higher monthly income, and those without a current sexual partner tended to have a higher prevalence of sexual events with casual partners (Table 4).
3) Frequency of sexual intercourse (sexual activity) The overall average frequency of sexual intercourse per month for the previous year was 3.0 times. The fre- quency of sexual intercourse according to gender, age, education level, monthly income, and marital status are shown in Table 3. Highest frequency of sexual inter- course was observed in the 30s age group while the 60s age group showed the lowest rate. On multiple regres- sion analysis, it was found that the frequency of sexual intercourse was higher in those with higher monthly incomes, in the lower age groups, among males, and among those currently having a sexual partner (Table 5).
Table 2. The mean age at first sexual intercourse according to gender
Men Women
Overalla 21.9±4.4 24.1±4.4
Age (y)b
18–19 17.9±1.1 17.6±1.6
20–29 20.4±2.4 21.0±2.5
30–39 21.3±3.8 23.6±4.3
40–49 22.8±4.3 24.6±4.0
50–59 22.3±4.4 25.3±4.5
60–69 22.8±6.3 24.9±4.9
Values are presented as mean±standard deviation.
aIndependent t-test, p<0.05; bANOVA, p<0.05.
0% 10% 20% 30% 40% 50% 60% 70% 80% 90%
60s 50s 40s 30s 20s 10s University or higher High school or college Middle school or lower
>4,500 3,600 4,499 2,700 3,599 1,800 2,699 900 1,799
<900
100%
Age(y)
Percent of respondents who experienced sexual intercourse Female Male
EducationlevelMonthly income($)
Fig. 1. Distribution of subjects who ex- perienced sexual intercourse according to socio-demographic feature.
Table 3. Prevalence of sexual behaviors in the past 12 months
Variable Having sexual partnera Sexual events with casual
partnersa Frequency of sexual intercourse (/mo)
Men Women Men Women Men Women
Overall 937/1,135 (82.6) 903/1,031 (87.6) 257 (22.6) 26 (2.5) 3.3±3.6 2.7±3.0
Age (y)
18–19 7/17 (41.2) 11/17 (64.7) 4/17 (23.5) 1/17 (5.9) 1.5±2.6 2.5±3.4
20–29 97/165 (58.8) 99/126 (78.6) 47/165 (28.5) 5/126 (4.0) 3.1±3.2 3.2±3.2
30–39 208/259 (80.3) 200/219 (91.3) 76/259 (29.3) 7/219 (3.2) 3.9±4.2 3.7±3.6
40–49 266/294 (90.9) 246/268 (91.8) 59/294 (20.1) 4/268 (1.5) 3.2±3.5 3.0±2.9
50–59 234/261 (89.7) 224/253 (88.5) 52/261 (19.9) 6/253 (2.4) 3.2±3.5 2.1±2.6
60–69 125/139 (89.9) 123/148 (83.1) 19/139 (13.7) 3/148 (2.0) 2.6±2.8 1.1±1.9
Education level
Middle school or lower 10/15 (66.7) 31/42 (73.8) 3/15 (20.0) 1/42 (2.4) 2.3±2.3 0.8±1.2 High school or college 255/322 (79.2) 419/478 (87.7) 69/322 (21.4) 8/478 (1.7) 3.1±3.7 2.7±3.0 University or higher 672/798 (84.2) 453/511 (88.6) 185/798 (23.2) 17/511 (3.3) 3.4±3.6 2.8±3.1
Marital status
Currently married 785/793 (97.4) 771/794 (97.1) 150/793 (18.9) 18/794 (2.3) 3.6±3.6 2.9±3.0 Divorced or widowed 14/47 (29.8) 21/65 (32.3) 17/47 (30.5) 2/65 (3.1) 1.7±3.4 1.0±3.0 Never married 138/295 (44.4) 111/172 (64.5) 90/295 (27.2) 6/172 (3.5) 2.6±3.5 2.4±3.0
Monthly income ($)
<900 50/93 (53.8) 113/141 (80.1) 13/93 (14.7) 1/141 (0.7) 1.8±3.0 1.9±2.5
900–1,799 96/142 (67.6) 228/270 (84.4) 27/142 (18.4) 4/270 (1.5) 3.0±3.7 2.5±3.2
1,800–2,699 216/288 (75.2) 195/226 (86.3) 69/288 (24.0) 12/226 (5.3) 3.0±3.4 2.5±3.2 2,700–3,599 216/237 (90.3) 140/153 (91.5) 48/237 (23.1) 4/153 (2.6) 3.5±3.6 3.0±3.0 3,600–4,499 160/169 (93.5) 101/109 (92.7) 42/169 (24.9) 2/109 (1.8) 3.6±3.9 2.8±2.6
≥4,500 199/206 (96.5) 126/132 (95.5) 58/206 (29.2) 3/132 (2.3) 3.8±3.6 3.1±3.1
Values are presented as number/total number (%) or mean±standard deviation.
aProportions were the results from respondents who had experienced sexual intercourse.
Table 4. Multivariate analysis of experience of sexual events with casual partners
Variable Subheading Adjusted OR 95% CI p-value
Gender Men 1.000
Women 0.103 0.037–0.169 <0.01
Age (10-y age band) 0.857 0.798–0.916 <0.01
Education level Middle school or lower 1.000
High school or college 1.223 0.809–1.637 0.63
University or higher 1.230 0.813–1.647 0.62
Marital status Currently married 1.000
Divorced or widowed 2.076 1.81–2.35 <0.01
Never married 1.870 1.72–2.02 <0.01
Monthly income ($) <900 1.000
900–1,799 1.323 1.09–1.56 0.240
1,800–2,699 2.526 2.31–2.75 <0.01
2,700–3,599 2.411 2.17–2.67 <0.01
3,600–4,499 2.526 2.26–2.79 <0.01
≥4,500 3.185 2.93–3.44 <0.01
OR: odds ratio, CI: confidence interval.
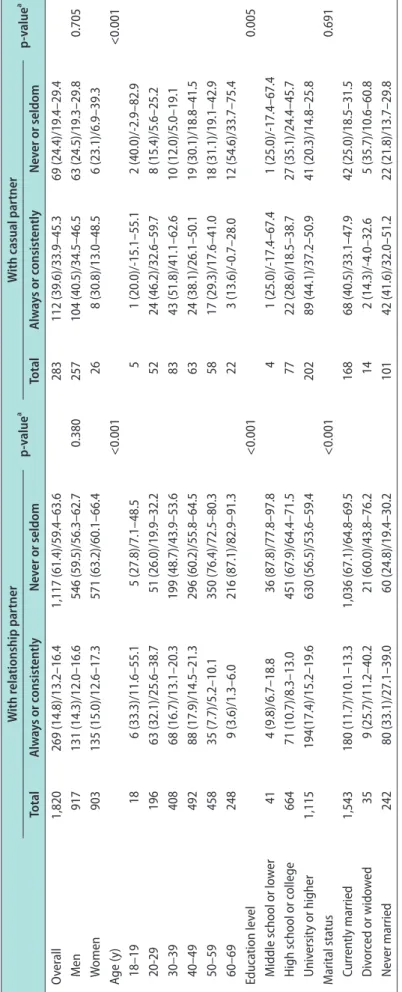
4) Frequency of and attitudes toward condom usage The frequency of condom use rate, relative to socio- demographic factors is presented in Table 6. To- tally, 14.8% (95% CI, 13.2%–16.4%) and 39.6% (95% CI, 33.9%–45.3%) of the respondents used condoms always/
consistently with regular partners and casual partners, respectively. Meanwhile, 24.4% (95% CI, 19.4%–29.4%) of the respondents never or seldom use condoms with casual partners. Older participants and participant with lower education level were tended to be more likely to use condoms never or seldom with casual partners (p<0.001). A feeling of condoms being bother- some was the most common reason for not using them (57.4%). Other reasons included decreased sexual plea- sure (35.8%), a request from their partner (17.5%), and unavailability (2.3%).
4. Sexual education
Sexual education experience regarding STIs among demographics factors are shown in Table 7. Only 10.4%
of the respondents had received sex education regard- ing STIs. Overall, 11.2% of men had received sexual education, higher than the 9.6% in women. However, this was not statistically significant (p=0.186). Accord- ing to age-band, older participants were more likely to have had no experience of sexual education regarding STIs (p<0.001).
DISCUSSION
The current study is the second nationally represen- tative study of sexual behavior among Korean men and women. The previous study did not include young age groups with higher sexual activity and focused on sexual problems leading to decreased sexual activity in older age groups [11]. The current study considered wider age groups including adolescents and young age group. Consequently, we could identified various
problem of sexual behavior in those age groups such as lack of sexual education in the adolescents, the high- est rate of sexual intercourse with casual partners in their 20s and 30s, and the lowest rate of sexual educa- tion regarding STIs in middle age group. Additionally, the current study investigated basic sexual behaviors, enabling educators to develop plans for improving the social knowledge associated with sexual behaviors.
Lifetime experience of sexual intercourse, which is the baseline parameter for sexual behavior, was not included in most previous studies, despite being conducted among individuals who had already been sexually active [10,12,15-17]. In our study, teenagers and those in their 20s reported lesser sexual intercourse experience that may reflects the conservative Koreans’
traditional Confucian perspective on sexual intercourse before marriage. However, compared with that before 10 years, the percentage of those with sexual experi- ence among adolescents and those in the 20s age group had increased [10].
The mean age during the first intercourse was high- er in Korea than in Western countries [18,19]. Recent studies have reported that the age during the first sexual intercourse in Korea has been decreasing [20,21].
However, it can be assumed that among those in their 20s or younger, since the participants with no sexual intercourse experience were excluded, the reported age during the first sexual intercourse might be lower than that among those in their 30s or older.
Totally 85.6% of women in the 30s or younger age groups reported having spouse as the sexual partner, compared with 70.7% of their male counterparts. This difference might be due to the increasing age at mar- riage in Korea and the increased rate of unemploy- ment, which affects dating and intimacy. The gender disparity was reversed in the 60s age group, with 89.9% men and 83.1% women reporting having a sexual partner. This is consistent with previous studies in Table 5. Multiple regression analysis of frequency of sexual intercourse
Prognostic factor Nonstandardized coefficient (B)
Standard error
Standardized
coefficients (β) p-value
Age -0.52 0.05 -0.20 <0.01
Monthly income 0.18 0.04 0.08 <0.01
Women -0.64 0.13 -0.09 <0.01
Not having sexual partner -2.72 0.17 -0.30 <0.01
R2=0.130.
Table 6. The frequency of condom use relative to sociodemographic factors With relationship partner p-valueaWith casual partner p-valuea TotalAlways or consistentlyNever or seldomTotalAlways or consistentlyNever or seldom Overall1,820269 (14.8)/13.2–16.41,117 (61.4)/59.4–63.6283112 (39.6)/33.9–45.369 (24.4)/19.4–29.4 Men917131 (14.3)/12.0–16.6546 (59.5)/56.3–62.70.380257104 (40.5)/34.5–46.563 (24.5)/19.3–29.80.705 Women903135 (15.0)/12.6–17.3571 (63.2)/60.1–66.4268 (30.8)/13.0–48.56 (23.1)/6.9–39.3 Age (y)<0.001<0.001 18–19186 (33.3)/11.6–55.15 (27.8)/7.1–48.551 (20.0)/-15.1–55.12 (40.0)/-2.9–82.9 20-2919663 (32.1)/25.6–38.751 (26.0)/19.9–32.25224 (46.2)/32.6–59.78 (15.4)/5.6–25.2 30–3940868 (16.7)/13.1–20.3199 (48.7)/43.9–53.68343 (51.8)/41.1–62.610 (12.0)/5.0–19.1 40–4949288 (17.9)/14.5–21.3296 (60.2)/55.8–64.56324 (38.1)/26.1–50.119 (30.1)/18.8–41.5 50–5945835 (7.7)/5.2–10.1350 (76.4)/72.5–80.35817 (29.3)/17.6–41.018 (31.1)/19.1–42.9 60–692489 (3.6)/1.3–6.0216 (87.1)/82.9–91.3223 (13.6)/-0.7–28.012 (54.6)/33.7–75.4 Education level<0.0010.005 Middle school or lower414 (9.8)/6.7–18.836 (87.8)/77.8–97.841 (25.0)/-17.4–67.41 (25.0)/-17.4–67.4 High school or college66471 (10.7)/8.3–13.0451 (67.9)/64.4–71.57722 (28.6)/18.5–38.727 (35.1)/24.4–45.7 University or higher1,115194(17.4)/15.2–19.6630 (56.5)/53.6–59.420289 (44.1)/37.2–50.941 (20.3)/14.8–25.8 Marital status<0.0010.691 Currently married1,543180 (11.7)/10.1–13.31,036 (67.1)/64.8–69.516868 (40.5)/33.1–47.942 (25.0)/18.5–31.5 Divorced or widowed359 (25.7)/11.2–40.221 (60.0)/43.8–76.2142 (14.3)/-4.0–32.65 (35.7)/10.6–60.8 Never married24280 (33.1)/27.1–39.060 (24.8)/19.4–30.210142 (41.6)/32.0–51.222 (21.8)/13.7–29.8 Values are presented as number only or number (%)/95% confidence interval. a p-value for linear trend.
other countries [16,22]. It could be explained by factors like the age structure of marital relationships among adults (men tend to pair with younger women), differ- ent remarriage patterns, and shorter life expectancy in men, compared with that in women [23]. Interestingly, among adolescents with sexual intercourse experience, only half of them reported having current sexual part- ners. This might imply that the sexually active ado- lescents were having sexual relationship with casual partners including friends, recent acquaintances, or transactional sex partners.
Age and marital status are well-known, strong deter- minants of sexual activity which were consistent with our results [24]. The gender difference with respect to sexual activity might be because men have a higher interest and a more positive attitude about sex [23].
It is also possible that physiological changes in older women such as vaginal atrophy, lower libido, and other sexual health problems might affect sexual activity [25]. Males aged above 40 years, also showed decreasing sexual activity with age, possibly due to the increasing prevalence of sexual problems [11,26].
A history of sexual relationship with casual partners is the concerning sexual behavior, since those who en- gage in this behavior are exposed to high risk of STIs [27]. The identified vulnerable groups were males in their 20s and 30s who are in sexually active ages. Ad- ditional studies investigating the rate of condom use in these groups are important. Although the rates of con- dom use with casual partners among those in their 20s and 30s were higher than other age group, it cannot be excused. In addition, although older age group were less likely to be exposed to sexual relationship with casual partners, their condom use rates were reported
significantly lower than young ages. The current over- all rate of regular condom use is lower than that in western countries [14,28]. Furthermore, the overall rate of condom use has declined, when compared with the past decade, in Korea [10,29]. Therefore, it is necessary to develop a program for promoting condom use in the general population.
Despite the recent increase in the interest on sexual education, only about 10% of Korean adults had re- ceived sexual education regarding STIs. In 2009, amidst the increasing emphasis on the health of adolescents, the Korean Ministry of Education, Science, and Tech- nology amended the Middle School Education Act and health teachers were mandated to provide health edu- cation including sexual education. Despite the increase in health education classes, only 44.0% of the adoles- cents in our cohort had received sexual education re- garding STIs, which could have been avoided by health teachers and students due to the curriculum, which probably included embarrassing and repulsive pictures or photos [3]. Another important finding was that sexu- al education regarding STIs in the 40s and 50s was too low. The number of STI patients beyond their 40s was less than 20% of total STI patents in 10 years ago, and recently the number of patients in those ages have ac- counted for more than 35% [4]. Although the relation- ship between rapid increase in STI of beyond 40s and low rate of sexual education in those ages has not been ascertained clearly, sexual education would reduce the STI. Therefore, providing opportunities for sex educa- tion among these groups is necessary.
The major strength of this study, compared to other previous studies in Korea [6-9,11], is that we used a multi-stratification sampling design to collect nation- Table 7. The frequency of received sexual education regarding sexually transmitted infections according to demographic characteristics
Variable Subheading Received Not received p-value
Overall 261 (10.4)/9.2–11.6 2,239 (89.6)/88.4–90.8
Gender Men 143 (11.2)/9.5–13.0 1,130 (88.8)/87.0–90.5 0.186a
Women 118 (9.6)/8.0–11.3 1,109 (90.4)/88.7–92.0
Age (y) 18–19 59 (44.0)/35.6–52.4 75 (56.0)/47.6–64.4 <0.001b
20–29 85 (19.6)/15.9–23.3 349 (80.4)/76.7–84.1
30–39 44 (8.3)/6.0–10.7 484 (91.7)/89.3–94.0
40–49 28 (4.8)/3.1–6.5 558 (95.2)/93.5–96.9
50–59 23 (4.4)/2.6–6.1 502 (95.6)/9.4–9.7
60–69 22 (7.5)/4.5–10.5 271 (92.5)/89.5–95.5
Values are presented as number (%)/95% confidence interval.
ap-value for chi-square test. bp-value for linear trend.
ally representative data, with wider age groups, focus- ing on both the gender. We believe that our results adequately reflect contemporary patterns of Korean sexual behaviors, necessary for formulation of policies and practices to provide better sexual health. Second, we recruited participants and collected data online, to minimize information bias. Face-to-face and telephone interviews would be unsuitable for such a survey, as it might be embarrassing for respondents to share sensitive personal information [30]. In contrast, online survey respondents would be more honest and candid about their sexual behaviors, due to time convenience, and privacy.
A limitation of the current study is that the age group of 70 years or older was not included. Neverthe- less, they are less accessible for an online survey, and there is a risk of selection bias that might include healthy elderly people, while overlooking most of them who live in a hospitalized setting or in long-term health-care facilities. Moreover, the 60s age group who completed the online survey were probably limited in their representation of this age group. Therefore, to ex- plore elderly sexual behaviors, a large-scale population- based study with an innovative study design should be conducted. Another limitation is that this population- based design did not include sexual minorities such as gays, lesbians, or bisexuals. The ability to integrate those groups in the analysis was limited in this study.
CONCLUSIONS
This population-based study showed that sexual behaviors among Korean adults differed not only by gender and age, but also by educational level, marital status, and income level. Especially, it was able to iden- tify various sexual health problems in the adolescents, the young aged, middle aged, and the old aged groups.
Adolescents lack sexual education regarding STIs, despite the government’s policy to strengthen health education programs. In their 20s and 30s showed high- risk sexual behavior such as paid sex or sexual inter- course with speed dating partners, and almost half of them, although the rates were higher than in other age group, did not use condoms. The middle aged group was identified with the lowest rate of sexual educa- tion regarding STIs, probably due to the unavailability of sexual education. In the old aged group, the sexual activity was the lowest, hinting at the possibility of
sexual dysfunction. Thus, policies and education pro- moting awareness about safe sexual practice and STI prevention are necessary in each group.
ACKNOWLEDGEMENTS
This work was supported by the Research Program funded by the Korea Centers for Disease Control and Prevention (No. 5R01 AG021487).
Conflict of Interest
The authors have nothing to disclose.
Author Contribution
Conceptualization: AST, KJW, MDG. Data curation: KJW, KHJ. Formal analysis: AST, KHJ. Funding acquisition: MDG.
Investigation: AST, KJW, KHJ, AHS, MDG. Project administra- tion: AHS, LSW, MDG. Supervision: MDG. Validation: PHS, PHJ, AHS, LSW, MDG. Writing – original draft: AST. Writing – re- view & editing: AST, MDG.
Data Sharing Statement
The data required to reproduce these findings cannot be shared at this time due to legal and ethical reasons..
REFERENCES
1. World Health Organization. Defining sexual health: report of a technical consultation on sexual health, 28-31 January 2002, Geneva. Geneva: World Health Organization; 2006.
2. Kim SY, Lee JS, Park SK, Kim YI. Knowledge and attitudes towards AIDS in a general population. Korean J Health Educ Promot 2008;25:13-28.
3. Lee GY, Ham OK. Perception and needs in health education curriculum among school nurses as health teachers in Korea.
J Sch Nurs 2013;29:10-8.
4. Infectious diseases surveillance yearbook [Internet]. Cheon- gju: Korea Centers for Disease Control and Prevention; c2016 [cited 2019 Oct 13]. Available from: http://www.cdc.go.kr/
npt/biz/npp/portal/nppPblctDtaView.do?pblctDtaSeAt=1&p blctDtaSn=22.
5. Jung M. Sexual behavior and condom use among gay men, fe- male sex workers, and their customers: evidence from South Korea. PLoS One 2013;8:e66867.
6. Jeong HC, Kim SU, Lee WC, Kim MT, Lee WK, Kim HY,
et al. Sexual behavior of the elderly in urban areas. World J Mens Health 2012;30:166-71.
7. Choe HS, Lee DS, Lee SJ, Lee CB, Lee WC, Cho YH. Preva- lence of sexually transmitted infections and sexual behavior of young adults and middle-aged people presenting to health ex- amination centers in Korea. J Infect Chemother 2012;18:207- 12.
8. Choe HS, Lee SJ, Kim CS, Cho YH. Prevalence of sexually transmitted infections and the sexual behavior of elderly peo- ple presenting to health examination centers in Korea. J Infect Chemother 2011;17:456-61.
9. Youn G. Sexual activities and attitudes of adolescent Koreans.
Arch Sex Behav 1996;25:629-43.
10. Park J, Min B, Shin H, Oh S, Song WH, Cho SY, et al. A 10- year interval study about the sexual life and attitudes of Kore- an women: the Korean Internet Sexuality Survey (KISS) 2014, part 2. J Sex Med 2017;14:1142-51.
11. Moreira ED Jr, Kim SC, Glasser D, Gingell C. Sexual activity, prevalence of sexual problems, and associated help-seeking patterns in men and women aged 40-80 years in Korea: data from the Global Study of Sexual Attitudes and Behaviors (GSSAB). J Sex Med 2006;3:201-11.
12. Nicolosi A, Laumann EO, Glasser DB, Moreira ED Jr, Paik A, Gingell C. Sexual behavior and sexual dysfunctions after age 40: the global study of sexual attitudes and behaviors. Urology 2004;64:991-7.
13. McFarlane M, Bull SS, Rietmeijer CA. The Internet as a newly emerging risk environment for sexually transmitted diseases.
JAMA 2000;284:443-6.
14. Reece M, Herbenick D, Schick V, Sanders SA, Dodge B, Fortenberry JD. Condom use rates in a national probabil- ity sample of males and females ages 14 to 94 in the United States. J Sex Med 2010;7 Suppl 5:266-76.
15. Herbenick D, Reece M, Schick V, Sanders SA, Dodge B, Fortenberry JD. Sexual behavior in the United States: results from a national probability sample of men and women ages 14-94. J Sex Med 2010;7 Suppl 5:255-65.
16. Lindau ST, Schumm LP, Laumann EO, Levinson W, O’Muircheartaigh CA, Waite LJ. A study of sexuality and health among older adults in the United States. N Engl J Med 2007;357:762-74.
17. Ortiz AP, Soto-Salgado M, Suárez E, del Carmen Santos-Ortiz M, Tortolero-Luna G, Pérez CM. Sexual behaviors among adults in Puerto Rico: a population-based study. J Sex Med 2011;8:2439-49.
18. Madkour AS, de Looze M, Ma P, Halpern CT, Farhat T, Ter Bogt TF, et al. Macro-level age norms for the timing of sexual
initiation and adolescents’ early sexual initiation in 17 Euro- pean countries. J Adolesc Health 2014;55:114-21.
19. Fryar CD, Hirsch R, Porter KS, Kottiri B, Brody DJ, Louis T.
Drug use and sexual behaviors reported by adults: United States, 1999-2002. Adv Data 2007;(384):1-14.
20. Kim HS. Sexual debut and mental health among South Ko- rean adolescents. J Sex Res 2016;53:313-20.
21. Lee DY, Moon JM, Lee IS, Suh CS, Choi D. Factors associated with sexual debut during adolescence in the Republic of Ko- rea. Sex Transm Infect 2012;88:481-3.
22. Dennerstein L, Lehert P, Burger H. The relative effects of hor- mones and relationship factors on sexual function of women through the natural menopausal transition. Fertil Steril 2005;
84:174-80.
23. Lindau ST, Gavrilova N. Sex, health, and years of sexually active life gained due to good health: evidence from two US population based cross sectional surveys of ageing. BMJ 2010;
340:c810.
24. Palacios-Ceña D, Carrasco-Garrido P, Hernández-Barrera V, Alonso-Blanco C, Jiménez-García R, Fernández-de-las-Peñas C. Sexual behaviors among older adults in Spain: results from a population-based national sexual health survey. J Sex Med 2012;9:121-9.
25. Dennerstein L, Dudley E, Burger H. Are changes in sexual functioning during midlife due to aging or menopause? Fertil Steril 2001;76:456-60.
26. Song WH, Park J, Yoo S, Oh S, Cho SY, Cho MC, et al. Chang- es in the prevalence and risk factors of erectile dysfunction during a decade: the Korean Internet Sexuality Survey (KISS), a 10-year-interval web-based survey. World J Mens Health 2019;37:199-209.
27. Hoffmann O, Boler T, Dick B. Achieving the global goals on HIV among young people most at risk in developing coun- tries: young sex workers, injecting drug users and men who have sex with men. World Health Organ Tech Rep Ser 2006;
938:287-315; discussion 317-41.
28. Simbayi LC, Matseke G, Wabiri N, Ncitakalo N, Banyini M, Tabane C, et al. Covariates of condom use in South Africa:
findings from a national population-based survey in 2008.
AIDS Care 2014;26:1263-9.
29. Sohn A, Chun SS. Gender differences in sexual behavior and condom-related behaviours and attitudes among Korean youths. Asia Pac J Public Health 2007;19:45-52.
30. Analysis of sexual behaviour in France (ACSF). A comparison between two modes of investigation: telephone survey and face-to-face survey. ASCF principal investigators and their as- sociates. AIDS 1992;6:315-23.