ISSN 2234-3806 • eISSN 2234-3814
362 www.annlabmed.org https://doi.org/10.3343/alm.2017.37.4.362 Ann Lab Med 2017;37:362-364
https://doi.org/10.3343/alm.2017.37.4.362
Letter to the Editor
Laboratory Informatics
Development and Application of a Laboratory-
Developed Quality Control Program for Blood Glucose Monitoring Systems: A Single Institute Experience
Hae-il Park, M.D.1, Jongbo Cho, M.T.1, Sang Min Lee, B.S.2, Jang-Won Son, M.D.3, Sung Rae Kim, M.D.3, Soonjib Yoo, M.D.3, and Seong-Su Lee, M.D.3
Department of Laboratory Medicine1, Department of Hospital Information2, Division of Endocrinology and Metabolism3, Department of Internal Medicine, Bucheon St. Mary’s Hospital, College of Medicine, The Catholic University of Korea, Bucheon, Korea
Dear Editor,
Many hospitals use blood glucose monitoring systems (BGMSs) supported by software for internal quality control (IQC) data man- agement and transmission of patient data to the hospital infor- mation system (HIS). However, in some cases, user friendliness for patients or the cost of the device is prioritized over the avail- ability of data transfer software. Consequently, some hospitals use BGMSs without the support of software. This method may be appropriate to familiarize patients with the system during the hospitalization period, if they will use the same system for the self-monitoring of blood glucose. Therefore, for the management and analysis of IQC data, we established a laboratory-developed quality control program (LDQCP) as an IQC data management program for the BGMS in the absence of software.
In total, 50 BGMSs (Barozen, Handok Inc., Seoul, Korea) were used at 24 locations within the Bucheon St. Mary’s Hospital, Ko- rea. Unit managers (UM) at each site analyzed two glucose lev- els in control material (high and low) daily; the IQC data were entered into Microsoft Excel 2010 spreadsheets (Microsoft Cor- poration, Redmond, WA, USA). Each cell in the spreadsheets contained formulae corresponding to the Westgard multirules, (12s, 13s, R4s, and 22s) for conditional formatting of the cell; the
resultant coloring of the cell could alert operators to any violation of the multirules. On the last day of each month, the UM upload ed the spreadsheet files to a platform shared with a point-of-care testing committee, available on the HIS. At the beginning of the following month, all files were downloaded, imported into R ver- sion 3.3.2 statistical software [1], and analyzed on a personal computer. Mean, SD, CV, SD index (SDI), CV ratio (CVR), bias, total error (TE), and sigma-metric of the jth BGMS on the ith site were calculated by using the following equations with overall mean (meangrand) and SD (SDgrand) for each level of control for the month. The meangrand was always considered a target value regardless of the lot, even when more than two lots of control material were used. Desirable specification of the TE due to bio- logical variation for plasma glucose of 5.5% was used as the al- lowable total error (TEa) to calculate the sigma-metric [2].
CVij=SDij/meanij×100
SDIij=(meanij-meangrand)/SDgrand
CVRij=CVij/CVgrand
Biasij=(meanij-meangrand)/meangrand×100 TEij=biasij+1.96×CVij
Sigma-metricij=(TEa-|biasij|)/CVij
Every month, from March to October 2016, the rank of an in-
Received: November 21, 2016 Revision received: December 19, 2016 Accepted: March 20, 2017
Corresponding author: Seong-Su Lee
Division of Endocrinology and Metabolism, Department of Internal Medicine, Bucheon St. Mary’s Hospital, College of Medicine, The Catholic University of Korea, 327 Sosa-ro, Wonmi-gu, Bucheon 14647, Korea
Tel: +82-32-340-7224, Fax: +82-32-340-2039 E-mail: [email protected]
© Korean Society for Laboratory Medicine.
This is an Open Access article distributed under the terms of the Creative Commons Attribution Non-Commercial License (http://creativecommons.org/licenses/by-nc/4.0) which permits unrestricted non-commercial use, distribution, and reproduction in any medium, provided the original work is properly cited.
1 / 1 CROSSMARK_logo_3_Test
2017-03-16 https://crossmark-cdn.crossref.org/widget/v2.0/logos/CROSSMARK_Color_square.svg
Park H-I, et al.
QC program for glucose monitoring
https://doi.org/10.3343/alm.2017.37.4.362 www.annlabmed.org 363
Table 1. Blood glucose monitoring systems for each lot of quality control materials and summary of internal quality control results (mean±SD) from March to October 2016
March April May June July August September October
Lot CSLN06AM*, CSLL24AN† 5 4 7 3 0 0 0 0
CSMM31AM*, SMA28AN† 37 40 31 26 12 0 0 0
CSMN18AM*, CSMN18BN† 0 1 9 19 34 48 0 0
CSNM07AM*, CSNA01FN† 0 0 0 0 0 0 48 50
High Mean (mg/dL) 236.8±9.6 242.6±8.2 245.1±6.3 246.7±6.4 245.0±4.5 241.1±9.6 237.8±5.3 235.1±4.6
SD (mg/dL) 13.9±4.6 11.8±4.0 10.7±3.0 8.9±3.3 8.6±3.5 7.3±1.8 8.0±1.5 8.4±3.4
SDI –0.02±0.56 0.04±0.59 –0.01±0.50 –0.01±0.56 –0.01±0.44 0.01±0.79 0.02±0.58 –0.01±0.46
CVR 0.82±0.26 0.84±0.28 0.84±0.24 0.79±0.29 0.84±0.34 0.60±0.16 0.87±0.17 0.83±0.34
Bias (%) –0.1±4.0 0.3±3.4 –0.1±2.6 –0.1±2.6 –0.1±1.9 0.1±4.0 0.1±2.2 0.0±2.0
Low Mean (mg/dL) 134.1±4.3 137.4±3.2 139.7±3.8 140.8±4.3 141.4±3.5 141.3±2.6 137.2±2.6 134.3±3.1
SD (mg/dL) 8.9±3.9 7.4±5.1 6.3±1.7 5.3±1.4 5.5±1.6 5.6±1.3 4.5±1.1 4.9±1.2
SDI 0.00±0.41 0.01±0.41 0.01±0.52 –0.05±0.64 –0.05±0.54 –0.01±0.42 0.01±0.50 –0.01±0.53
CVR 0.85±0.37 0.95±0.63 0.87±0.23 0.79±0.21 0.85±0.24 0.90±0.21 0.87±0.23 0.83±0.21
Bias (%) 0.0±3.2 0.1±2.3 0.1±2.7 –0.2±3.0 –0.2±2.5 –0.1±1.8 0.0±1.9 –0.1±2.3
*Lot of high level quality control material; †Lot of low level quality control material.
Abbreviations: SDI, SD index; CVR, CV ratio.
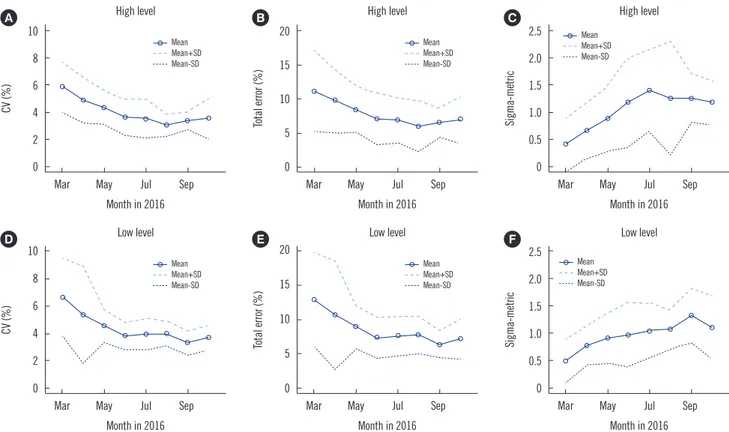
Fig. 1. Changes in the analytical performance of a blood glucose monitoring system derived from internal quality control data from March to October 2016. Data are presented as the hospital-wide mean±SDs. CV is shown in (A) and (D), total error in (B) and (E), sigma-metric in (C) and (F). High-level control material (235.1–246.7 mg/dL) in (A), (B), and (C). Low-level control material (134.1–141.4 mg/dL) in (D), (E), and (F).
10 8 6 4 2 0
Mar May Jul Sep Month in 2016
CV (%)
High level A
Mean Mean+SD Mean-SD
20
15
10
5
0
Mar May Jul Sep Month in 2016
Total error (%)
High level B
Mean Mean+SD Mean-SD
2.5 2.0 1.5 1.0 0.5 0
Mar May Jul Sep Month in 2016
Sigma-metric
High level C
Mean Mean+SD Mean-SD
10 8 6 4 2 0
Mar May Jul Sep Month in 2016
CV (%)
Low level D
Mean Mean+SD Mean-SD
20
15
10
5
0
Mar May Jul Sep Month in 2016
Total error (%)
Low level E
Mean Mean+SD Mean-SD
2.5 2.0 1.5 1.0 0.5 0
Mar May Jul Sep Month in 2016
Sigma-metric
Low level F
Mean Mean+SD Mean-SD
Park H-I, et al.
QC program for glucose monitoring
364 www.annlabmed.org https://doi.org/10.3343/alm.2017.37.4.362 dividual BGMS based on the sigma-metric along with the Levey-
Jennings control chart created by the LDQCP was uploaded to the HIS. This study was approved by the Institutional Review Board of Catholic Medical Center at Catholic University of Korea (HC16EISI0099:HIRB-00205_3-003).
Hospital-wide means (SD) during the period ranged from 235.1 (4.6) to 246.7 (6.4) mg/dL (high level) and from 134.1 (4.3) to 141.4 (3.5) mg/dL (low level). Seven months from the beginning of the LDQCP, hospital-wide means for CV, bias, and TE were reduced for both the high and low levels. Sigma-metrics for the high and low levels increased from 0.4 (0.5) to 1.2 (0.4) and from 0.5 (0.4) to 1.1 (0.6), respectively, after a seven-month period (Table 1 and Fig. 1). Even in the period from March to July, when more than two lots of control material were used, both the TE and CV decreased. The mean of SDI, CVR, and bias showed lit- tle difference over the study period because they were calculated on the basis of the monthly overall mean and SD. Although sigma- metrics could differ depending on the TEa adopted for the cal- culation, the general trend would be similar.
Several factors are considered to contribute to the reduction in the imprecision of BGMS. When users receive their monthly IQC report, including the sigma-metric-based rank, they are gen- erally more interested in the performance of their BGMS and mo-
tivated to do better than other sites. For instance, when a cell in the spreadsheet was colored, operators might have been more likely to focus on the IQC result violating Westgard multirules, for example, to analyze a new bottle of control or to replace the BG- MS with another one in stock. As a result, the BGMSs in use at each site could maintain appropriate precision. It was also as- sumed that this factor affected the test results with patient speci- mens.
In conclusion, even in hospitals where a BGMS without IQC data management software is used, adoption of this LDQCP could improve the analytical performance of BGMSs.
Authors’ Disclosures of Potential Conflicts of Interest
No potential conflicts of interest relevant to this article were re- ported.
REFERENCES
1. R Core Team. R: A language and environment for statistical computing.
http://www.R-project.org/ (Updated on Oct 2016).
2. Westgard JO. Desirable Biological Variation Database specifications.
https://www.westgard.com/biodatabase1.htm (Updated on Oct 2014).