서론
대한임상검사정도관리협회 약물검사분과위원회는 1995년 부터 혈중 치료적약물농도(therapeutic drug monitoring)검
사에 대한 신빙도조사를 시작하였고, 2007년부터는 남용약물 (drug of abuse)검사에 대한 신빙도조사를 실시하고 있다[1- 4]. 저자들은 2015년 실시되었던 치료적약물농도검사 및 남용 약물검사의 신빙도조사결과를 분석하여 보고하고자 한다.
Annual Report on the External Quality Assessment of Therapeutic Drug Monitoring and Testing for Drugs of Abuse in Korea (2015)
Dae-Hyun Ko
1, Gum- Gyoung Gu
1, Eun- Jung Cho
1, Eun Suk Shin
1, Sail Chun
1, and Jeong-Ho Kim
2, as Therapeutic Drug Monitoring Subcommittee, Korean Association of External Quality Assessment Service
1
Department of Laboratory Medicine, Asan Medical Center, University of Ulsan College of Medicine;
2
Department of Laboratory Medicine, Severance Hospital, Yonsei University College of Medicine, Seoul, Korea
As an annual function of the Therapeutic Drug Monitoring Subcommittee of Korean Association of External Quality Assessment Service (K-EQAS), we organised two trials for an external quality assessment of therapeutic drug monitoring (TDM) and testing for drugs of abuse (DOA) in 2015. For the TDM assessment, we sent low- and high-level control materials from various clinical institutions, and for the DOA testing, we sent positive and negative control materials. The number of participating laboratories was 105 for the TDM trial and 106 for the DOA test. The average number of drug items provided was 5.6 per institution. The most commonly tested substances, in descending order, were: valproic acid, digoxin, vancomycin, tacrolimus, and carbamazepine. The mean inter-laboratory coefficients of variation for low- and high-level TDM control materials were 7.3% and 7.4%, respectively.
The most widely used TDM analysers were the Architect i System (Abbott Diagnostics, USA), followed by the Cobas Integra (Roche Diagnostics, Switzerland) and the Cobas c501 analyser (Roche Diagnostics). The number of participating laboratories for the DOA analysis was 16% higher that than of our 2014 study. In 98.6% of cases, our analysis confirmed the reliabilityviability of the tests at participating DOA laboratories in both trials. In the external quality assessment of TDM by the TDM subcommittee of K-EQAS in 2015, the overall performance of TDM testing was found to be similar to that reported in previous years, and inter-laboratory precision was higher than that of 2014. Continuous improvement in the quality of TDM testing through participation in a proficiency-testing program will remain necessary in the future.
(J Lab Med Qual Assur 2016;38:11-21)
Key Words: Quality assurance, Laboratory proficiency testing, Drug monitoring
Corresponding author:
Sail Chun
Department of Laboratory Medicine, Asan Medical Center, University of Ulsan College of Medicine, 88 Olympic-ro 43-gil, Songpa-gu, Seoul 05505, Korea Tel: +82-2-3010-4513 Fax: +82-2-478-0884
E-mail: sailchun@amc.seoul.kr pISSN: 2384-2458
eISSN: 2288-7261
재료 및 방법
1. 정도관리물질 및 대상기관
총 2회에 걸쳐 치료적약물농도검사 및 남용약물검사 신빙도 조사를 실시하였다. 제1회차 신빙도조사대상 정도관리물질은 2015년 5월 13일 발송하였다. Therapeutic drug monitoring (TDM)검사 인혈청(人血淸) 정도관리물질인 Lyphocheck TDM Control (Bio-Rad Laboratories, Hercules, CA, USA) level 1 (15-01) 및 level 3 (15-02) 두 종류의 물질을 총 100개 참여기관에 발송하였다. 같은 날에 전혈(全血) 정도관리물질 인 Lyphocheck whole blood control (Bio-Rad Laboratories) level 1 (15-01 WB) 및 level 3 (15-02 WB) 두 종류의 물질을 Cyclosporine, Tacrolimus, Sirolimus 검사를 시행하는 총 61 개 기관을 대상으로 발송하였다. 그리고 약물남용 정도관리물
질인 Liquicheck Qualitative Urine Toxicology Control (Bio- Rad Laboratories) negative (15-01 urine) 및 positive (15- 02 urine) 두 종류의 물질을 41개 기관에 발송하였다. 제2회차 정도관리물질 발송은 2015년 9월 15일에 시행하였다. TDM 검사 정도관리물질 Lyphocheck TDM Control (Bio-Rad Laboratories) level 1 (15-03) 및 level 3 (15-04) 두 종류의 물질을 총 102개 참여기관을 대상으로 발송하였다. 같은 날에 Lyphocheck whole blood control (Bio-Rad Laboratories) level 1 (15-03 WB) 및 level 3 (15-04 WB) 두 종류의 물질을 Cyclosporine, Tacrolimus, Sirolimus 검사를 시행하는 총 62 개 기관을 대상으로 발송하였다. 그리고 약물남용 정도관리물 질인 Liquicheck Qualitative Urine Toxicology Control (Bio- Rad Laboratories) negative (15-03 urine) 및 positive (15- 04 urine) 두 종류의 물질을 41개 기관에 발송하였다.
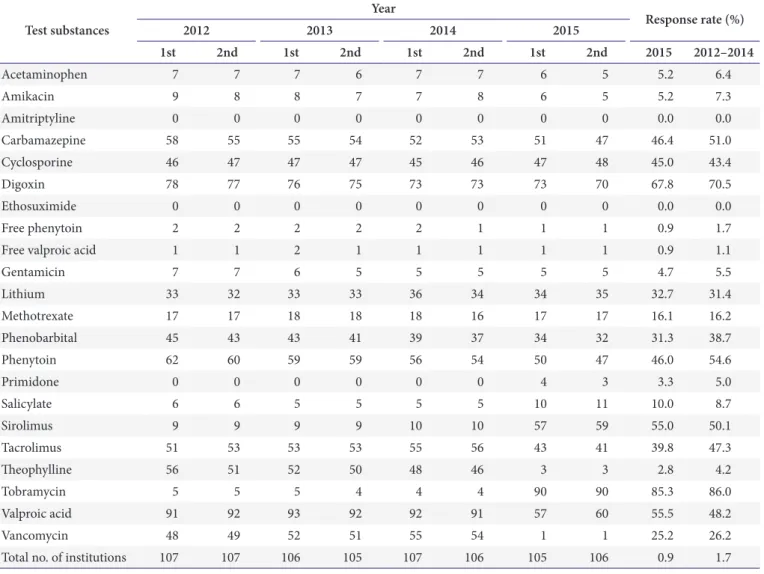
Table 1. Response rate of the 2015 therapeutic drug monitoring proficiency testing by Korean Association of External Quality Assessment Service, including data from the previous three years
Test substances
Year Response rate (%)
2012 2013 2014 2015
1st 2nd 1st 2nd 1st 2nd 1st 2nd 2015 2012–2014
Acetaminophen 7 7 7 6 7 7 6 5 5.2 6.4
Amikacin 9 8 8 7 7 8 6 5 5.2 7.3
Amitriptyline 0 0 0 0 0 0 0 0 0.0 0.0
Carbamazepine 58 55 55 54 52 53 51 47 46.4 51.0
Cyclosporine 46 47 47 47 45 46 47 48 45.0 43.4
Digoxin 78 77 76 75 73 73 73 70 67.8 70.5
Ethosuximide 0 0 0 0 0 0 0 0 0.0 0.0
Free phenytoin 2 2 2 2 2 1 1 1 0.9 1.7
Free valproic acid 1 1 2 1 1 1 1 1 0.9 1.1
Gentamicin 7 7 6 5 5 5 5 5 4.7 5.5
Lithium 33 32 33 33 36 34 34 35 32.7 31.4
Methotrexate 17 17 18 18 18 16 17 17 16.1 16.2
Phenobarbital 45 43 43 41 39 37 34 32 31.3 38.7
Phenytoin 62 60 59 59 56 54 50 47 46.0 54.6
Primidone 0 0 0 0 0 0 4 3 3.3 5.0
Salicylate 6 6 5 5 5 5 10 11 10.0 8.7
Sirolimus 9 9 9 9 10 10 57 59 55.0 50.1
Tacrolimus 51 53 53 53 55 56 43 41 39.8 47.3
Theophylline 56 51 52 50 48 46 3 3 2.8 4.2
Tobramycin 5 5 5 4 4 4 90 90 85.3 86.0
Valproic acid 91 92 93 92 92 91 57 60 55.5 48.2
Vancomycin 48 49 52 51 55 54 1 1 25.2 26.2
Total no. of institutions 107 107 106 105 107 106 105 106 0.9 1.7
2. 신빙도조사 약물종목
2015년도 대한임상검사정도관리협회 약물검사분과에 서 실시한 치료적약물농도검사 신빙도조사 약물종목은 acetaminophen, amikacin, amitriptyline, carbamazepine, digoxin, free phenytoin, free valproic acid, gentamicin, lithium, methotrexate, phenobarbital, phenytoin, salicylate, theophylline, tobramycin, valproic acid, vancomycin, cyclosporine, tacrolimus (FK-506), sirolimus 등 총 20항목으로 제1회와 제2회차 모두 동일한 약물을 대상 으로 하였다. 남용약물검사 신빙도조사종목은 3,4-methyle nedioxymethamphetamine, 9-COOH-11-nor-△9-THC, benzoylecgonine, d-amphetamine, d-methamphetamine, ethanol, lysergic acid diethylamide, methadone, methaqualone, free morphine, nordiazepam, nortriptyline, oxazepam, phencyclidine, propoxyphene, secobarbital 등 16항목으로 제1회와 제2회차 모두 동일한 약물을 대상으로 하 였다.
3. 정도관리물질 제조방법
정도관리물질 제조는 제조사의 지침대로 시행하도록 하 였다. Lyphocheck TDM control (Bio-Rad Laboratories) 은 검사 당일에 탈이온수를 정확히 5.0 mL을 넣어 용해시 키며 실온에 15분간 세워 둔 후 잘 섞어 사용하도록 하였다.
Lyphocheck whole blood control (Bio-Rad Laboratories) 은 검사 당일에 탈이온수를 2.0 mL를 넣어 용해시키며 실온 에 20분간 세우 둔 후 잘 섞어 사용하도록 하였다. 남용약물검 사물질인 Liquicheck Qualitative Urine Toxicology Control (Bio-Rad Laboratories)은 액상으로 전처리 없이 검사하도록 하였다.
4. 수탁기관 인정기준
본 분과위원회에서 정한 치료약물농도검사의 수탁기관 인 정기준은 다음과 같았다. 첫째, 특정 회차에서 약물종목 중
‘unacceptable’인 약물종목이 2건 이하이어야 한다. 단 장비 별 peer group이 5기관 이하일 경우 ‘unacceptable’인 약물종 목이 3건 이하이어야 한다. 둘째, 참여한 약물종목 중 해당 약 물종목이 2회 연속으로 모든 정도관리물질결과(연속된 4개 검 사)가 ‘unacceptable’인 종목이 없어야 한다. 단 장비별 peer group이 5기관 이하일 경우 해당 약물종목이 3회 연속으로 모든 정도관리물질결과(연속된 6개 검사)가 ‘unacceptable’
인 종목이 없어야 한다. ‘Unacceptable’의 기준은 약물검사 분과 ‘acceptable’ 판정 허용범위기준을 벗어난 경우를 말한
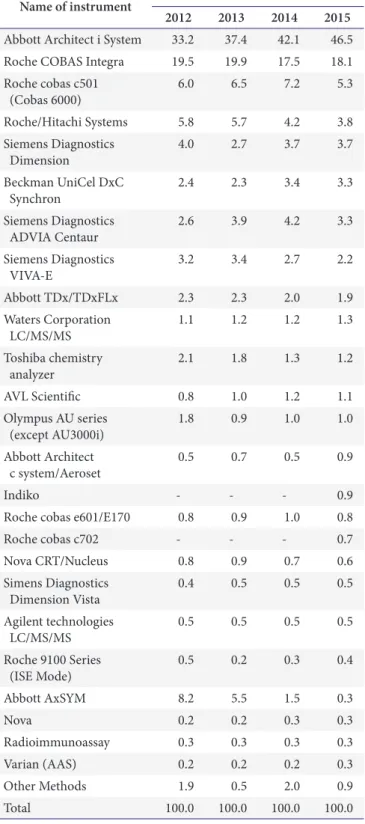
Table 2. Percentage of tests carried out using a given instrument for therapeutic drug monitoring at participating institutions as assessed by Korean Association of External Quality Assessment Service proficiency testing 2012–2015
Name of instrument Year
2012 2013 2014 2015
Abbott Architect i System 33.2 37.4 42.1 46.5 Roche COBAS Integra 19.5 19.9 17.5 18.1 Roche cobas c501
(Cobas 6000) 6.0 6.5 7.2 5.3
Roche/Hitachi Systems 5.8 5.7 4.2 3.8
Siemens Diagnostics
Dimension 4.0 2.7 3.7 3.7
Beckman UniCel DxC
Synchron 2.4 2.3 3.4 3.3
Siemens Diagnostics
ADVIA Centaur 2.6 3.9 4.2 3.3
Siemens Diagnostics
VIVA-E 3.2 3.4 2.7 2.2
Abbott TDx/TDxFLx 2.3 2.3 2.0 1.9
Waters Corporation
LC/MS/MS 1.1 1.2 1.2 1.3
Toshiba chemistry
analyzer 2.1 1.8 1.3 1.2
AVL Scientific 0.8 1.0 1.2 1.1
Olympus AU series
(except AU3000i) 1.8 0.9 1.0 1.0
Abbott Architect
c system/Aeroset 0.5 0.7 0.5 0.9
Indiko - - - 0.9
Roche cobas e601/E170 0.8 0.9 1.0 0.8
Roche cobas c702 - - - 0.7
Nova CRT/Nucleus 0.8 0.9 0.7 0.6
Simens Diagnostics
Dimension Vista 0.4 0.5 0.5 0.5
Agilent technologies
LC/MS/MS 0.5 0.5 0.5 0.5
Roche 9100 Series
(ISE Mode) 0.5 0.2 0.3 0.4
Abbott AxSYM 8.2 5.5 1.5 0.3
Nova 0.2 0.2 0.3 0.3
Radioimmunoassay 0.3 0.3 0.3 0.3
Varian (AAS) 0.2 0.2 0.2 0.3
Other Methods 1.9 0.5 2.0 0.9
Total 100.0 100.0 100.0 100.0
Values are presented as %.
다. 약물종목별 허용기준은 다음과 같다. Acetaminophen, amikacin, amitriptyline, carbamazepine, cyclosporine, free phenytoin, free valproic acid, methotrexate, salicylate, sirolimus, tacrolimus (FK-506), vancomycin 등의 허용기 준은 ±3SD 또는 ±10%이고, gentamicin, phenobarbital, phenytoin, theophylline, tobramycin, valproic acid 등의 약 물 허용기준은 ±25%이다. Digoxin은 ±20% 또는 0.2 ng/
mL이고 lithium은 ±20% 또는 0.3 mmol/L이다.
5. 결과분석 및 통계
약물농도의 보고단위 및 소수점 유효숫자를 약물검사분과위 원회에서 제시한 것으로 하지 않고 임의대로 한 기관에 대해서 는 본 위원회 제시 안을 참고하여 일괄 환산 처리하였다. 또한 검사장비코드를 기록하지 않은 기관은 2014년과 동일 코드로 처리하였으며 통계분석은 각 검사종목별로 장비의 차이를 고
려하지 않은 전체 통계와 각 장비별(peer group)로 평균, 표준 편차, 표준편차지수(standard deviation index) 값을 내되, 표 준편차지수 값이 +3.0 또는 -3.0을 벗어나는 기관의 결과 값 은 제외하고 다시 평균, 표준편차, 및 표준편차지수 값을 계산 하였다. 단, 참여기관이 단일기관인 경우 통계에서 제외하였 다. 또한 각 군별로 변이계수(coefficient of variation), 최저값, 및 최대값을 산출하였다. 결과분석 및 통계처리는 Microsoft Excel 2010 (Microsoft, Redmond, WA, USA) 프로그램과 Microsoft Access 2010 (Microsoft) 프로그램을 사용하였다.
결과
1. 신빙도조사 참여기관 및 검사종목
1회차는 107기관 중 105기관이 회신하여 회신율 98.1%, 2 회차는 109기관 중 106기관이 회신을 하여 회신율 97.2%였 Table 3. Mean inter-laboratory CV for therapeutic drug testing using low- and high-level control materials for the last 5 years
Substance
Inter-laboratory CV for low-level control materials Inter-laboratory CV for high-level control materials No. of
labs
Average 2010 to 2014
2014
(1st) 2014
(2nd) 2015
(1st) 2015
(2nd) No. of labs
Average 2010 to 2014
2014
(1st) 2014
(2nd) 2015
(1st) 2015 (2nd)
Acetaminophen 6 15.4 17.0 5.7 4.6 1.6 6 3.1 3.4 4.1 1.4 3.4
Amikacin 6 7.8 5.1 9.0 5.0 0.7 6 6.6 7.5 6.7 5.1 3.8
Amitriptyline - - - - - - - - - - - -
Carbamazepine 51 7.0 9.0 7.6 10.0 2.1 51 6.3 5.5 4.7 8.8 7.2
Cyclosporine 46 11.2 9.1 14.0 18.9 13.5 46 9.9 8.2 8.7 13.8 9.8
Digoxin 73 17.8 17.2 18.6 18.9 2.4 73 9.1 7.7 11 7.2 9
Free phenytoin 1 8.7 0.0 - - - 1 12.9 3.9 - - -
Free valproic acid 1 - - - - - 1 18.2 - - - -
Gentamicin 5 6.3 3.5 8.2 3.9 0.7 5 8.6 12.2 6.9 7.9 8.5
Lithium 34 13.8 17.7 10.8 16.5 13.2 34 11.1 13.4 11.7 14.9 22.3
Methotrexate 17 6.4 8.7 3.9 10.3 0.1 17 8.3 27.8 3.9 6.4 6.7
Phenobarbital 34 6.5 7.7 5.4 6.7 3.2 34 6.2 6.6 5.1 5.7 4.3
Phenytoin 50 5.7 5.8 4.6 6.5 2.2 50 6.2 7.8 7.5 6.6 9.2
Primidone 0 - - - - - 0 - - - - -
Salicylate 4 6.9 4.9 7.7 8.4 2.3 4 1.6 1.8 1.4 0.7 2.9
Sirolimus 10 12.1 9.9 8.7 15.0 10.1 10 10 8 8.6 7.8 14.7
Tacrolimus 56 13.3 9.2 5.8 12.7 3.5 56 7.3 7.4 5.3 7.5 6.7
Theophylline 43 5.7 6.0 6.7 6.2 1.1 43 5.4 4.7 5.5 5.8 6.6
Tobramycin 3 19.6 7.2 8.9 13.6 0.3 3 10.1 6.5 3.2 8.2 4.3
Valproic acid 90 8.0 10.7 8.0 5.5 13.1 90 5.1 5.4 4.4 5 4.6
Vancomycin 57 7.1 5.5 8.0 7.7 8.3 57 8.4 8.8 8.9 7.7 8.5
Total mean CV 10.0 8.6 8.3 10.0 4.6 8.1 8.1 6.3 7.1 7.8
Values are presented as %.
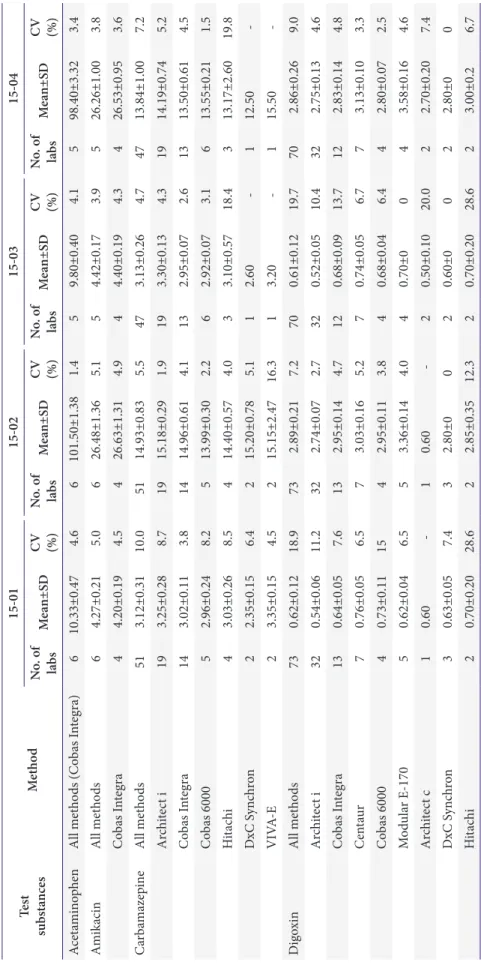
Ta bl e 4. P ro ficien cy t es tin g r es ul ts f or t hera peu tic dr ug m oni to rin g o f acet amin op hen, a mi kacin, c arb am azep in e, a nd dig oxin f or 2015 Tes t su bs ta nces M etho d 15-01 15-02 15-03 15-04 N o. o f lab s M ea n±S D CV (%)
N o. o f lab s M ea n±S D
CV (%)
N o. o f lab s M ea n±S D
CV (%)
N o. o f lab s M ea n±S D
CV (%)
Acet amin op hen A ll m et ho ds (C ob as I nt eg ra) 6 10.33±0.47 4.6 6 101.50±1.38 1.4 5 9.80±0.40 4.1 5 98.40±3.32 3.4 A mi kacin A ll me tho ds 6 4.27±0.21 5.0 6 26.48±1.36 5.1 5 4.42±0.17 3.9 5 26.26±1.00 3.8 C ob as I nt eg ra 4 4.20±0.19 4.5 4 26.63±1.31 4.9 4 4.40±0.19 4.3 4 26.53±0.95 3.6 Ca rb am azep in e A ll me tho ds 51 3.12±0.31 10.0 51 14.93±0.83 5.5 47 3.13±0.26 4.7 47 13.84±1.00 7.2 A rch ite ct i 19 3.25±0.28 8.7 19 15.18±0.29 1.9 19 3.30±0.13 4.3 19 14.19±0.74 5.2 C ob as I nt eg ra 14 3.02±0.11 3.8 14 14.96±0.61 4.1 13 2.95±0.07 2.6 13 13.50±0.61 4.5 C ob as 6000 5 2.96±0.24 8.2 5 13.99±0.30 2.2 6 2.92±0.07 3.1 6 13.55±0.21 1.5 H itac hi 4 3.03±0.26 8.5 4 14.40±0.57 4.0 3 3.10±0.57 18.4 3 13.17±2.60 19.8 D xC S yn chr on 2 2.35±0.15 6.4 2 15.20±0.78 5.1 1 2.60 - 1 12.50 - VIV A-E 2 3.35±0.15 4.5 2 15.15±2.47 16.3 1 3.20 - 1 15.50 - Dig oxin A ll me tho ds 73 0.62±0.12 18.9 73 2.89±0.21 7.2 70 0.61±0.12 19.7 70 2.86±0.26 9.0 A rch ite ct i 32 0.54±0.06 11.2 32 2.74±0.07 2.7 32 0.52±0.05 10.4 32 2.75±0.13 4.6 C ob as I nt eg ra 13 0.64±0.05 7.6 13 2.95±0.14 4.7 12 0.68±0.09 13.7 12 2.83±0.14 4.8 C ent au r 7 0.76±0.05 6.5 7 3.03±0.16 5.2 7 0.74±0.05 6.7 7 3.13±0.10 3.3 C ob as 6000 4 0.73±0.11 15 4 2.95±0.11 3.8 4 0.68±0.04 6.4 4 2.80±0.07 2.5 M od ul ar E-170 5 0.62±0.04 6.5 5 3.36±0.14 4.0 4 0.70±0 0 4 3.58±0.16 4.6 A rch ite ct c 1 0.60 - 1 0.60 - 2 0.50±0.10 20.0 2 2.70±0.20 7.4 D xC S yn chr on 3 0.63±0.05 7.4 3 2.80±0 0 2 0.60±0 0 2 2.80±0 0 H itac hi 2 0.70±0.20 28.6 2 2.85±0.35 12.3 2 0.70±0.20 28.6 2 3.00±0.2 6.7
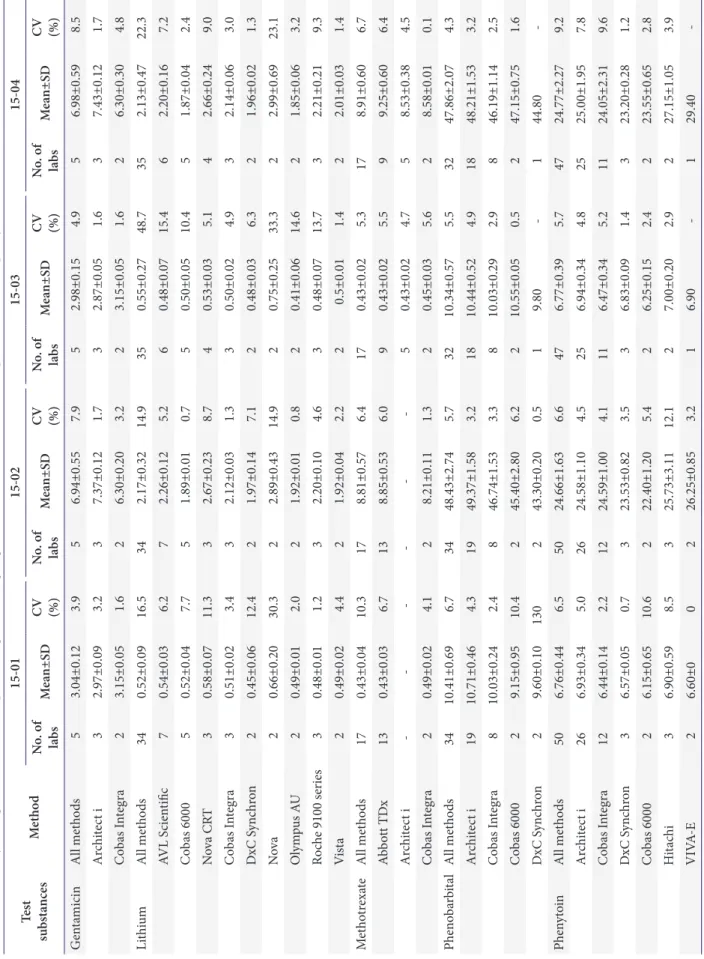
Ta bl e 5. P ro ficien cy t es tin g r es ul ts f or t he t hera peu tic dr ug m oni to rin g o f g en ta micin, li thi um, m et ho trexa te , p hen ob arb ita l, a nd p hen yt oin f or 2015 Tes t su bs ta nces M etho d 15-01 15-02 15-03 15-04 N o. o f lab s M ea n±S D CV (%)
N o. o f lab s M ea n±S D
CV (%)
N o. o f lab s M ea n±S D
CV (%)
N o. o f lab s M ea n±S D
CV (%)
G en ta micin A ll me tho ds 5 3.04±0.12 3.9 5 6.94±0.55 7.9 5 2.98±0.15 4.9 5 6.98±0.59 8.5 A rch ite ct i 3 2.97±0.09 3.2 3 7.37±0.12 1.7 3 2.87±0.05 1.6 3 7.43±0.12 1.7 C ob as I nt eg ra 2 3.15±0.05 1.6 2 6.30±0.20 3.2 2 3.15±0.05 1.6 2 6.30±0.30 4.8 Lit hiu m A ll me tho ds 34 0.52±0.09 16.5 34 2.17±0.32 14.9 35 0.55±0.27 48.7 35 2.13±0.47 22.3 AVL S cien tific 7 0.54±0.03 6.2 7 2.26±0.12 5.2 6 0.48±0.07 15.4 6 2.20±0.16 7.2 C ob as 6000 5 0.52±0.04 7.7 5 1.89±0.01 0.7 5 0.50±0.05 10.4 5 1.87±0.04 2.4 N ova CR T 3 0.58±0.07 11.3 3 2.67±0.23 8.7 4 0.53±0.03 5.1 4 2.66±0.24 9.0 C ob as I nt eg ra 3 0.51±0.02 3.4 3 2.12±0.03 1.3 3 0.50±0.02 4.9 3 2.14±0.06 3.0 D xC S yn chr on 2 0.45±0.06 12.4 2 1.97±0.14 7.1 2 0.48±0.03 6.3 2 1.96±0.02 1.3 No va 2 0.66±0.20 30.3 2 2.89±0.43 14.9 2 0.75±0.25 33.3 2 2.99±0.69 23.1 O ly m pu s AU 2 0.49±0.01 2.0 2 1.92±0.01 0.8 2 0.41±0.06 14.6 2 1.85±0.06 3.2 Ro ch e 91 00 se rie s 3 0.48±0.01 1.2 3 2.20±0.10 4.6 3 0.48±0.07 13.7 3 2.21±0.21 9.3 Vi sta 2 0.49±0.02 4.4 2 1.92±0.04 2.2 2 0.5±0.01 1.4 2 2.01±0.03 1.4 M et ho trexa te A ll me tho ds 17 0.43±0.04 10.3 17 8.81±0.57 6.4 17 0.43±0.02 5.3 17 8.91±0.60 6.7 Ab bo tt TD x 13 0.43±0.03 6.7 13 8.85±0.53 6.0 9 0.43±0.02 5.5 9 9.25±0.60 6.4 A rch ite ct i - - - - - - 5 0.43±0.02 4.7 5 8.53±0.38 4.5 C ob as I nt eg ra 2 0.49±0.02 4.1 2 8.21±0.11 1.3 2 0.45±0.03 5.6 2 8.58±0.01 0.1 Ph en ob ar bit al A ll me tho ds 34 10.41±0.69 6.7 34 48.43±2.74 5.7 32 10.34±0.57 5.5 32 47.86±2.07 4.3 A rch ite ct i 19 10.71±0.46 4.3 19 49.37±1.58 3.2 18 10.44±0.52 4.9 18 48.21±1.53 3.2 C ob as I nt eg ra 8 10.03±0.24 2.4 8 46.74±1.53 3.3 8 10.03±0.29 2.9 8 46.19±1.14 2.5 C ob as 6000 2 9.15±0.95 10.4 2 45.40±2.80 6.2 2 10.55±0.05 0.5 2 47.15±0.75 1.6 D xC S yn chr on 2 9.60±0.10 130 2 43.30±0.20 0.5 1 9.80 - 1 44.80 - Ph en yt oin A ll me tho ds 50 6.76±0.44 6.5 50 24.66±1.63 6.6 47 6.77±0.39 5.7 47 24.77±2.27 9.2 A rch ite ct i 26 6.93±0.34 5.0 26 24.58±1.10 4.5 25 6.94±0.34 4.8 25 25.00±1.95 7.8 C ob as I nt eg ra 12 6.44±0.14 2.2 12 24.59±1.00 4.1 11 6.47±0.34 5.2 11 24.05±2.31 9.6 D xC S yn chr on 3 6.57±0.05 0.7 3 23.53±0.82 3.5 3 6.83±0.09 1.4 3 23.20±0.28 1.2 C ob as 6000 2 6.15±0.65 10.6 2 22.40±1.20 5.4 2 6.25±0.15 2.4 2 23.55±0.65 2.8 H itac hi 3 6.90±0.59 8.5 3 25.73±3.11 12.1 2 7.00±0.20 2.9 2 27.15±1.05 3.9 VIV A-E 2 6.60±0 0 2 26.25±0.85 3.2 1 6.90 - 1 29.40 -
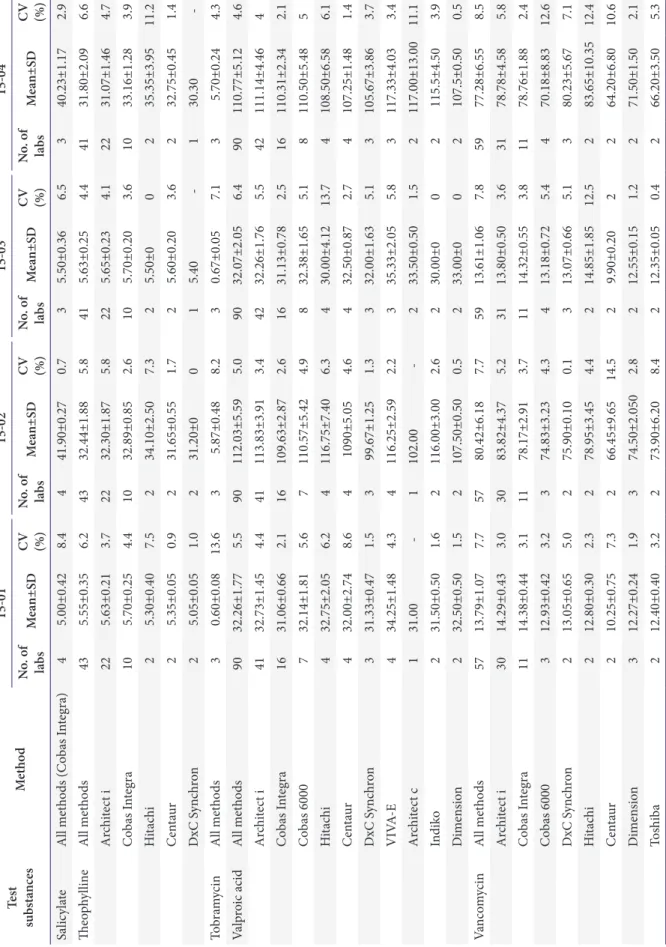
Table 6. Proficiency testing results for the therapeutic drug monitoring of salicylate, theophylline, tobramycin, valproic acid, and vancomycin for 2015 Tes t su bs ta nces M etho d 15-01 15-02 15-03 15-04 N o. o f lab s M ea n±S D CV (%)
N o. o f lab s M ea n±S D
CV (%)
N o. o f lab s M ea n±S D
CV (%)
N o. o f lab s M ea n±S D
CV (%)
Sa lic yl at e A ll m et ho ds (C ob as I nt eg ra) 4 5.00±0.42 8.4 4 41.90±0.27 0.7 3 5.50±0.36 6.5 3 40.23±1.17 2.9 The op hy lli ne A ll me tho ds 43 5.55±0.35 6.2 43 32.44±1.88 5.8 41 5.63±0.25 4.4 41 31.80±2.09 6.6 A rch ite ct i 22 5.63±0.21 3.7 22 32.30±1.87 5.8 22 5.65±0.23 4.1 22 31.07±1.46 4.7 C ob as I nt eg ra 10 5.70±0.25 4.4 10 32.89±0.85 2.6 10 5.70±0.20 3.6 10 33.16±1.28 3.9 H itac hi 2 5.30±0.40 7.5 2 34.10±2.50 7.3 2 5.50±0 0 2 35.35±3.95 11.2 C ent au r 2 5.35±0.05 0.9 2 31.65±0.55 1.7 2 5.60±0.20 3.6 2 32.75±0.45 1.4 D xC S yn chr on 2 5.05±0.05 1.0 2 31.20±0 0 1 5.40 - 1 30.30 - To bra m ycin A ll me tho ds 3 0.60±0.08 13.6 3 5.87±0.48 8.2 3 0.67±0.05 7.1 3 5.70±0.24 4.3 Va lp ro ic acid A ll me tho ds 90 32.26±1.77 5.5 90 112.03±5.59 5.0 90 32.07±2.05 6.4 90 110.77±5.12 4.6 A rch ite ct i 41 32.73±1.45 4.4 41 113.83±3.91 3.4 42 32.26±1.76 5.5 42 111.14±4.46 4 C ob as I nt eg ra 16 31.06±0.66 2.1 16 109.63±2.87 2.6 16 31.13±0.78 2.5 16 110.31±2.34 2.1 C ob as 6000 7 32.14±1.81 5.6 7 110.57±5.42 4.9 8 32.38±1.65 5.1 8 110.50±5.48 5 H itac hi 4 32.75±2.05 6.2 4 116.75±7.40 6.3 4 30.00±4.12 13.7 4 108.50±6.58 6.1 C en ta ur 4 32.00±2.74 8.6 4 1090±5.05 4.6 4 32.50±0.87 2.7 4 107.25±1.48 1.4 D xC S yn chr on 3 31.33±0.47 1.5 3 99.67±1.25 1.3 3 32.00±1.63 5.1 3 105.67±3.86 3.7 VIV A-E 4 34.25±1.48 4.3 4 116.25±2.59 2.2 3 35.33±2.05 5.8 3 117.33±4.03 3.4 A rch ite ct c 1 31.00 - 1 102.00 - 2 33.50±0.50 1.5 2 117.00±13.00 11.1 In di ko 2 31.50±0.50 1.6 2 116.00±3.00 2.6 2 30.00±0 0 2 115.5±4.50 3.9 Dim en sio n 2 32.50±0.50 1.5 2 107.50±0.50 0.5 2 33.00±0 0 2 107.5±0.50 0.5 Va nco m ycin A ll me tho ds 57 13.79±1.07 7.7 57 80.42±6.18 7.7 59 13.61±1.06 7.8 59 77.28±6.55 8.5 A rch ite ct i 30 14.29±0.43 3.0 30 83.82±4.37 5.2 31 13.80±0.50 3.6 31 78.78±4.58 5.8 C ob as I nt eg ra 11 14.38±0.44 3.1 11 78.17±2.91 3.7 11 14.32±0.55 3.8 11 78.76±1.88 2.4 C ob as 6000 3 12.93±0.42 3.2 3 74.83±3.23 4.3 4 13.18±0.72 5.4 4 70.18±8.83 12.6 D xC S yn chr on 2 13.05±0.65 5.0 2 75.90±0.10 0.1 3 13.07±0.66 5.1 3 80.23±5.67 7.1 H itac hi 2 12.80±0.30 2.3 2 78.95±3.45 4.4 2 14.85±1.85 12.5 2 83.65±10.35 12.4 C ent au r 2 10.25±0.75 7.3 2 66.45±9.65 14.5 2 9.90±0.20 2 2 64.20±6.80 10.6 Dim en sio n 3 12.27±0.24 1.9 3 74.50±2.050 2.8 2 12.55±0.15 1.2 2 71.50±1.50 2.1 To sh ib a 2 12.40±0.40 3.2 2 73.90±6.20 8.4 2 12.35±0.05 0.4 2 66.20±3.50 5.3
다. 기관당 평균 검사종목 수는 5.6종목이었다. 가장 많은 기 관에서 회신한 약물농도검사종목은 valproic acid 85.3%, digoxin 67.8%, vancomycin 55.5%, tacrolimus 55.0%, 등 4종목으로서 50.0% 이상의 기관에서 응답하였다. 다음으 로 carbamazepine 46.4%, phenytoin 46.0%, cyclosporine 45.0%, theophylline 39.8% 순이었고, 10% 미만의 회신 을 보인 종목은 amikacin, acetaminophen, gentamicin, salicylate, tobramycin, free phenytoin, free valproic acid 등 의 종목이었다. Amitriptyline과 pirimidone 두 약물의 응답률 은 1회차, 2회차 모두 0%였다(Table 1).
2. 검사장비 이용현황
치료약물농도감시 검사장비는 Architect i System (Abbott Diagnostics, Abbott Park, IL, USA)의 사용률이 46.5%로 가 장 높았고, 그 다음으로 Cobas Integra (Roche Diagnostics, Basel, Switzerland), Cobas c501 (Roche Diagnostics) 순이 었다(Table 2).
3. 치료적약물농도검사
치료적약물농도검사의 검사실 간 평균 변이계수는 저농도 7.3%였고 고농도 7.4%였다(Table 3). 약물 종류별 신빙도조 사결과는 장비를 고려하지 않은 전체 참가기관의 평균, 표준편 차 및 변이계수와 장비를 고려한 평균, 표준편차 및 변이계수 를 구분하여 요약하였다(Tables 4-7). 2015년 시행된 치료적 약물농도검사 신빙도조사에 참여한 모든 기관은 수탁기관 인 정기준을 만족하였다.
4. 남용약물검사
남용약물검사 신빙성조사에 참여한 기관 수는 1차 36기관, 2차 38기관이었다. 첫 번째 회차에서는 모든 기관에서 정답 을 보고하였다. 두 번째 회차에서는 d-Metamphetamine과 Benzoylecgonine에 대하여 한 기관에서 15-03 (urine) 검체 와 15-04 (urine) 검체 모두 오답을 하여 사무적 오차가 의심 되었다. 그 외의 기관에서는 정답을 맞추었다(Table 8).
고찰
대한임상정도관리협회 약물검사분과위원회의 치료적약물 농도검사 신빙도조사사업 참여기관 수는 사업이 시작된 이 후 2007년까지 꾸준히 증가하다가 이후 유사한 수준을 보였 다. 2015년 참가기관 수는 1회차에 105기관, 2회차에 106기 관으로 2014년과 유사하였다. 2015년 평균 회신율은 97.7%
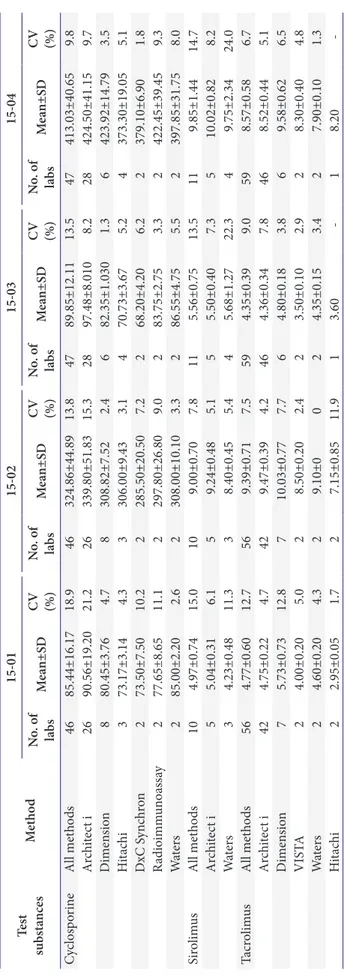
Ta bl e 7. P ro ficien cy t es tin g r es ul ts f or t he t hera peu tic dr ug m oni to rin g o f c yc los po rin e, sir olim us, a nd t acr olim us f or 2015 Tes t su bs ta nces M etho d 15-01 15-02 15-03 15-04 N o. o f lab s M ea n±S D CV (%)
N o. o f lab s M ea n±S D
CV (%)
N o. o f lab s M ea n±S D
CV (%)
N o. o f lab s M ea n±S D
CV (%)
Cy clos po rin e A ll me tho ds 46 85.44±16.17 18.9 46 324.86±44.89 13.8 47 89.85±12.11 13.5 47 413.03±40.65 9.8 A rch ite ct i 26 90.56±19.20 21.2 26 339.80±51.83 15.3 28 97.48±8.010 8.2 28 424.50±41.15 9.7 Dim en sio n 8 80.45±3.76 4.7 8 308.82±7.52 2.4 6 82.35±1.030 1.3 6 423.92±14.79 3.5 H itac hi 3 73.17±3.14 4.3 3 306.00±9.43 3.1 4 70.73±3.67 5.2 4 373.30±19.05 5.1 D xC S yn chr on 2 73.50±7.50 10.2 2 285.50±20.50 7.2 2 68.20±4.20 6.2 2 379.10±6.90 1.8 Radio imm un oa ss ay 2 77.65±8.65 11.1 2 297.80±26.80 9.0 2 83.75±2.75 3.3 2 422.45±39.45 9.3 W ate rs 2 85.00±2.20 2.6 2 308.00±10.10 3.3 2 86.55±4.75 5.5 2 397.85±31.75 8.0 Sir olim us A ll me tho ds 10 4.97±0.74 15.0 10 9.00±0.70 7.8 11 5.56±0.75 13.5 11 9.85±1.44 14.7 A rch ite ct i 5 5.04±0.31 6.1 5 9.24±0.48 5.1 5 5.50±0.40 7.3 5 10.02±0.82 8.2 W ate rs 3 4.23±0.48 11.3 3 8.40±0.45 5.4 4 5.68±1.27 22.3 4 9.75±2.34 24.0 Tacr olim us A ll me tho ds 56 4.77±0.60 12.7 56 9.39±0.71 7.5 59 4.35±0.39 9.0 59 8.57±0.58 6.7 A rch ite ct i 42 4.75±0.22 4.7 42 9.47±0.39 4.2 46 4.36±0.34 7.8 46 8.52±0.44 5.1 Dim en sio n 7 5.73±0.73 12.8 7 10.03±0.77 7.7 6 4.80±0.18 3.8 6 9.58±0.62 6.5 VIS TA 2 4.00±0.20 5.0 2 8.50±0.20 2.4 2 3.50±0.10 2.9 2 8.30±0.40 4.8 W ate rs 2 4.60±0.20 4.3 2 9.10±0 0 2 4.35±0.15 3.4 2 7.90±0.10 1.3 H itac hi 2 2.95±0.05 1.7 2 7.15±0.85 11.9 1 3.60 - 1 8.20 -
로 2014년 98.2%와 유사하였다. 기관당 평균 검사종목 수는 5.6종목으로 2009-2013년 최근 5개년간 평균 5.8종목과 유사 하였다. 대체적으로 각 기관에서 회신한 약물종목은 예년과 유사한 수준이었다. Vancomycin, tacrolimus, cyclosporine, sirolimus 등 약물들의 응답률은 최근 3년(2012-2014) 간 평균 응답률에 비해 증가된 반면 digoxin, phenytoin, carbamazepine, theophylline, phenobarbital 등의 약물들은 응답률이 감소하였다. Tacrolimus, cyclosporine, sirolimus 등의 약물의 응답률은 최근 몇 년간 계속적으로 증가하고 있어 서 장기 이식이 점차 활성화되고 있는 상황을 반영하는 것으로 생각된다. 반면 응답률 감소폭이 가장 큰 약물은 theophylline 과 phenytoin이었다.
약물검사분과에서는 각 기관에 기관별 평가를 위해서 검사 장비 차이를 고려하지 않은 종목별 표준편차지수 값과 검사장 비별 표준편차지수 값을 별도로 계산하여 보고하였다. 2015 년 저농도와 고농도 정도관리물질의 검사실 간 평균 변이계수 는 각각 7.3%, 7.4%로 최근 5개년의 평균 검사실 간 변이계 수인 저농도 10.0%, 고농도 8.1%에 비해 변이계수가 감소하 여 정밀도가 향상된 소견을 보였다. 약물별 검사실 간 변이계 수는 대체로 예년과 유사하였다. 두 기관에서 cyclosporine과 tacrolimus에서 고농도와 저농도 물질의 값을 잘못 입력한 것 으로 추정되는 오류가 발견되었다.
2015년 남용약물검사 신빙도조사 참여기관 수는 1회차 36 기관, 2회차 38기관으로 2014년에 비해 약 16% 증가하였다.
남용약물검사 신빙도조사 정답률은 예년과 유사하였지만 2차 에서 1 기관에서 사무적 오차가 의심되는 답을 하였다. 양성 및 음성 정도관리물질농도 차이가 매우 크므로 정성검사에서 오답을 보고한 기관은 결과보고 시 사무적 오차가 있었는지 여 부와 남용약물검사의 cut-off를 점검할 필요가 있었다. 또한 남 용약물검사 의뢰건수가 적은 기관에서는 검사 kit의 유통기한 을 확인한 후 남용약물검사를 실시해야 할 것으로 생각되었다.
결론적으로 2015년 치료적약물농도검사 신빙도조사에서 참 여기관 수는 최근 5년간 유사하였고, 저농도 및 고농도 정도관 리물질검사의 검사실 간 변이계수는 2012-2014년보다 감소하 여 전반적으로 약물검사의 정밀도가 향상된 소견을 보였다. 남 용약물검사 참여기관 수는 2014년에 비해 16% 가량 증가하였 다. 치료적약물농도검사는 환자 개개인의 적정약물요법을 위 해 필수적인 검사로 각 검사실에서는 지속적인 신빙도조사사 업 참여를 통하여 검사의 질을 높여나가야 할 것으로 생각되었 다.
약물검사분과위원회 위원(2015)
전사일(위원장, 울산의대), 구금경(간사, 서울아산병원), 고 Table 8. Drugs of abuse and the number of participating laboratories showing the percentage of tests deemed reliableviable following proficiency testing by Korean Association of External Quality Assessment Service for 2015
Test substances Participating laboratories during 2015
15-01 (urine) 15-02 (urine) 15-03 (urine) 15-04 (urine)
D-Methamphetamine 33 (100) 33 (100) 35 (97) 35 (97)
Morphine, free 29 (100) 29 (100) 31 (100) 31 (100)
9-COOH-11-nor-△9-THC 27 (100) 27 (100) 28 (100) 28 (100)
Benzoylecgonine 26 (100) 26 (100) 27 (96) 27 (96)
D-Amphetamine 22 (100) 22 (100) 24 (100) 24 (100)
3,4-Methylenedioxymethamphetamine 15 (100) 15 (100) 16 (100) 16 (100)
Phencyclidine (PCP) 9 (100) 9 (100) 9 (100) 9 (100)
Oxazepam 6 (100) 6 (100) 7 (100) 7 (100)
Nordiazepam 5 (100) 5 (100) 5 (100) 5 (100)
Methadone 3 (100) 3 (100) 3 (100) 3 (100)
Ethanol 3 (100) 3 (100) 3 (100) 3 (100)
Nortriptyline 3 (100) 3 (100) 3 (100) 3 (100)
Secobarbital 2 (100) 2 (100) 2 (100) 2 (100)
Propoxyphene 2 (100) 2 (100) 2 (100) 2 (100)
Lysergic acid diethylamide (LSD) 1 (100) 1 (100) 1 (100) 1 (100)
Values are presented as number of laboratories examined and percentage of laboratories passing.
대현(울산의대), 권계철(충남의대), 김병광(세브란스병원), 김 승완(건국대학교병원), 김정호(연세의대), 서순팔(전남의대), 송경은(경북의대), 송정한(서울의대), 윤여민(건국의대), 이수 연(성균관의대), 이용화(순천향의대), 정태동(가톨릭의대), 홍 수지(서울대학교병원)
REFERENCES
1. Kim JQ, Jung YS, Kwon OH, Kwon HJ, Kim YK, Kim JW, et al. Annual report on external quality assessment in therapeutic drug monitoring in Korea (1995). J Clin Pathol Qual Control 2009;18:119-25.
2. Kim JH, Kim BK, Lee SY, Chun S, Kwon GC, et al.
Annual report on quality assessment in therapeutic drug monitoring and drug of abuse in Korea (2007). J Lab Med
Qual Assur 2008;30:133-49.
3. Jeong TD, Gu GG, Chun S, Kim JH; Therapeutic Drug Monitoring Subcommittee, The Korean Association of Quality Assurance for Clinical Laboratory. Annual report on the external quality assessment of therapeutic drug monitoring and testing for drugs of abuse in Korea (2013).
J Lab Med Qual Assur 2014;36:12-22.
4. Ko DH, Jeong TD, Gu GG, Chun S, Kim JH; Therapeutic
Drug Monitoring Subcommittee, The Korean Association
of Quality Assurance for Clinical Laboratories. Annual
report on the external quality assessment scheme for
therapeutic drug monitoring and testing for drugs of
abuse in Korea (2014). J Lab Med Qual Assur 2015;37:12-
22.
치료적약물농도검사 및 남용약물검사 신빙도조사 결과보고 (2015)
고대현
1• 구금경
1• 조은정
1• 신은숙
1• 전사일
1• 김정호
2• 대한임상검사정도 관리협회 약물검사분과위원회
1