The Correlation of Metabolic Syndrome Factors and Bone Mineral Density on Postmenopausal Osteoporosis Patients with Low Back Pain under Korean Medicine Treatment
Jong Deok Lee, M.D., Dong Woung Kim, M.D.*, Young Dal Kwon, O.M.D.
†Departments of Radiology Medicine, Internal Medicine*, Rehabilitation Medicine
†, College of Korean Medicine, Wonkwang University
This paper was supported by Wonkwang University in 2011.
RECEIVED December 31, 2013 REVISED January 21, 2014 ACCEPTED January 21, 2014
CORRESPONDING TO
Dong Woung Kim, Department of Internal Medicine, GwangJu Korean Medicine Hospital, Wonkwang University, 543-8, Juwhel-dong, Nam-gu, Gwangju 503-310, Korea
TEL (062) 670-6484 FAX (062) 670-6767 E-mail [email protected]
Copyright © 2014 The Society of Korean Medicine Rehabilitation
Objectives The relationship between metabolic syndrome causes and bone mineral density (BMD) was explored by taking 60 female chronic low back pain patients with age 61 years old or elder having metabolic syndrome and osteoporosis as study subjects.
Methods Fasting blood glucose, serum total-cholesterol, triglyceride and HDL were measured by biochemical tests. Anthropometric elements and blood pressure were measured.
Results Average BMD and T-score of part number 1 to 3 of lumbar vertebra were esti- mated by Quantitative Computed Tomography (QCT). In order to find the relationship be- tween clinical factors and osteoporosis, correlation analysis was done on T-score. Age (r=0.679, p<0.01) had significant negative correlation and weight (r=0.342, p<0.01) and height (r=0.475, p<0.01) had significant positive correlation. Blood glucose, blood pres- sure, total cholesterol, triglyceride, HDL and body mass index did not have significant correlation. BMD had negative correlation with age (r=0.317, p<0.05). Regression analy- sis was done by taking T-score as independent variables and taking other factors as de- pendent variables. It was possible to know that age (β=-0.471, t=-7.050) with p<0.001, height (β=0.277, t=4.120) and weight (β=2.856, t=2.780) with p<0.05 have significant impact on osteoporosis.
Conclusions Therefore, it was possible to know that T-score and BMD decrease as one gets older and T-score and BMD increase as one is taller and heavier. (J Korean Med Rehab 2014;24(1):101-109)
Key words Metabolic syndrome, Bone mineral density, Osteoporosis, Low back pain
Introduction»»»
Osteoporosis is the most common disease among the metabolic diseases of bone. Osteoporosis is a state in which the bone mass is significantly decreased com- pared to normal person in same age and same gen- der
1). Osteoporosis can also be defined as having clin- ical fracture, as having decrease of bone matrix per unit volume in terms of histo-morphometrics and as
having increase of fracture risk in terms of epidemiol- ogy
2). Except low back pain, osteoporosis does not have any clear subjective symptom; therefore, it is dif- ficult to detect osteoporosis early. The frequent frac- tures and fat embolism of osteoporosis sometimes cause femur fracture which has the fatality rate of 10%
within a year
3). In general, female has six times higher
probability of getting osteoporosis than male because
male has more bone mass and less bone loss than fe-
male
4).
Metabolic syndrome is getting more attention as one of the important causes of cardiovascular system di- sease. Metabolic syndrome is defined as having three or more of hyperglycemia, triglyceridemia, low high density lipoprotein (HDL) in serum, high blood pres- sure and central obesity. Reaven
5)first used the termi- nology of Syndrome X in 1988, which means three or more of hypertension, glucose intolerance, insulin re- sistance, hyperinsulinemia, low HDL or high very low density (VLDL) lipoprotein occur at the same time.
NCEP ATP III is the most commonly used clinical in- dicator and it suggested a criteria focusing on abdomi- nal obesity in 2001, which is simple and easy to apply on diagnosis
6).
According to previous study related to the clinical characteristics of metabolic syndrome and osteoporosis, the physical characteristics such as height, weight and body mass index (BMI) have impact on bone mineral density (BMD). Osteoporosis and cardiovascular dis- ease have significant correlation and osteoporosis in- creases the risk factor of cardiovascular disease
7). Among the previous studies on the osteoporosis of fe- male in menopause and the clinical characteristics of metabolic syndrome, there is a study on blood lipid profile which gave results on cholesterol, triglyceride, blood pressure and obesity
8,9). There are many patients with obesity, dyslipidemia, hypertension or diabetes among the female patients who were diagnosed as os- teoporosis by BMD and came to Korean medicine clin- ic to treat low back pain which began after meno- pause. The purpose of this study is to explore the re- lationship between BMD and causes of metabolic syn- drome by taking 60 female patients as study subjects who are 61 years old or elder and who were diag- nosed as having metabolic syndrome in addition.
Subjects and Methods»»»
1. Subjects
60 female patients who met following criteria were chosen as study subjects. Time frame of visiting Korean medicine clinic is from January 2006 to August 2012. The study was approved by Institutional Review Board (IRB) of GwangJu Korean Medicine Hospital, Wonkwang University (No. WKIRB14-1). Age is 61 years old or elder. They came to Korean medicine clinic to treat chronic low back pain. All patients treat- ed acupuncture, moxibustion and cupping treatment according to case by case. They were diagnosed as os- teoporosis based on T-scores by BMD test -2.5 or less.
They were diagnosed as having metabolic syndrome by way of blood pressure measurement, blood chem- istry and body mass measurement at the time first visit our hospital.
2. Methods
1) Anthropometric measurement and history taking Age, past history of hypertension, diabetes, dyslipi- demia and medication history of all subject patients were asked and recorded. After five minutes rest, blood pressure, height and waist circumference, body mass index (BMI) were measured.
2) Biochemistry test
Blood sample was taken after fasting 12 hours or more and fasting glucose, total cholesterol, triglyceride and HDL were measured.
3) Quantitative Computed Tomography (QCT) meas- uring method
Average BMD and T-score were estimated when
subjects visited clinic for the first time by measuring
BMD (mg/cc) of lumbar vertebrae part no. 1-3 using
QCT.
Table I. Baseline Characteristics of the Study Subjects Total (n=60)
Age (years) 69.11±4.52
Height (Cm) 153.20±6.29
Weight (Kg) 57.83±8.98
BMI (Kg/m2) 24.51±2.77
Waist Cir (cm) 80.16±5.63
SBP (mmHg) 137.51±18.80
DBP (mmHg) 80.66±10.36
FBS (mg/dL) 133.18±46.83
TC (mg/dL) 198.08±46.49
TG (mg/dL) 204.01±88.78
HDL (mg/dL) 50.03±12.53
T-score -4.92±1.07
BMD (mg/cc) 54.43±24.6
BMI: body mass index, Cir: circumference, SBP: systolic blood pressure, DBP: diastolic blood pressure, FBS: fasting blood sugar, TC: total cholesterol, TG: triglyceride, HDL: high den- sity lipoprotein, BMD: bone mineral density.
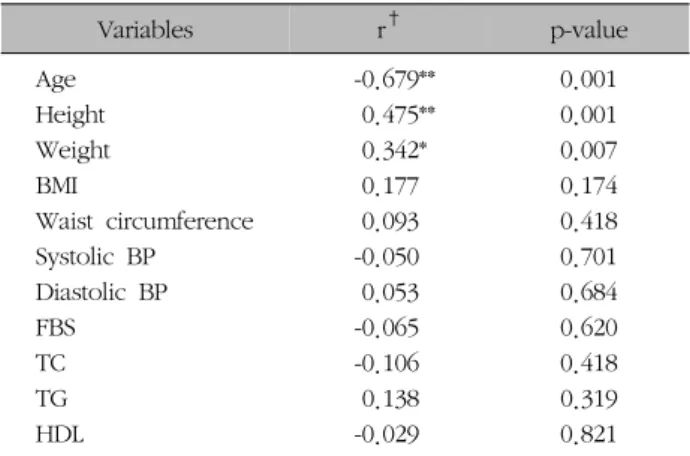
Table II. The Correlations between T-score and Metabolic Syndrome Factor Ect
Variables r† p-value
Age -0.679** 0.001
Height 0.475** 0.001
Weight 0.342* 0.007
BMI 0.177 0.174
Waist circumference 0.093 0.418
Systolic BP -0.050 0.701
Diastolic BP 0.053 0.684
FBS -0.065 0.620
TC -0.106 0.418
TG 0.138 0.319
HDL -0.029 0.821
*p<0.05, **p<0.01. †Pearson’s correlation coefficient.
4) Metabolic syndrome diagnosis criteria
If a subject has 3 or more of following five items in NCEP standard, the subject was diagnosed as having metabolic syndrome
6).
(1) Waist circumference: Men >90 cm, Women > 85 cm
(2) Triglyceride: ≥150 mg/dL
(3) HDL: Male <40 mg/dL, Female <50 mg/dL (4) Blood pressure: ≥130/85 mmHg
(5) Fasting glucose: ≥110 mg/dL 5) Statistical analysis
The measured values are shown as averages and mean±SD. In order to find the relationship between metabolic syndrome causes and BMD, regression anal- ysis was done with BMD as dependent variable. The test used significance level as p<0.05. SAS version 9.1 program was used for statistical analysis.
Result»»»
1. Clinical characteristics of subjects
Among the 60 patients chronic low back pain pa- tients with age 61 years or elder, 27 patients of them had low back pain history of 6 months or less and 33 patients of them had low back pain history longer than 6 months. 21 patients among them had the his- tory of hypertension, 6 patients had the history of dia- betes and 5 patients of them were taking drug for hyperlipemia. The average age of patients was 69.11±4.52 years (Table I).
2. Relationship between osteoporosis and clin- ical factors
In order to find the relationship between clinical fac-
tors and osteoporosis, correlation analysis was done on
T-score. T-score had significant negative correlation
with age (r=0.679, p<0.01) and had significant pos-
itive correlation with weight (r=0.342, p<0.01) and
height (r=0.475, p<0.01). Blood glucose, blood pres-
sure, total cholesterol, triglyceride, HDL and BMI did
not have statistically significant relation with osteopo-
rosis; however, there was a tendency of negative cor-
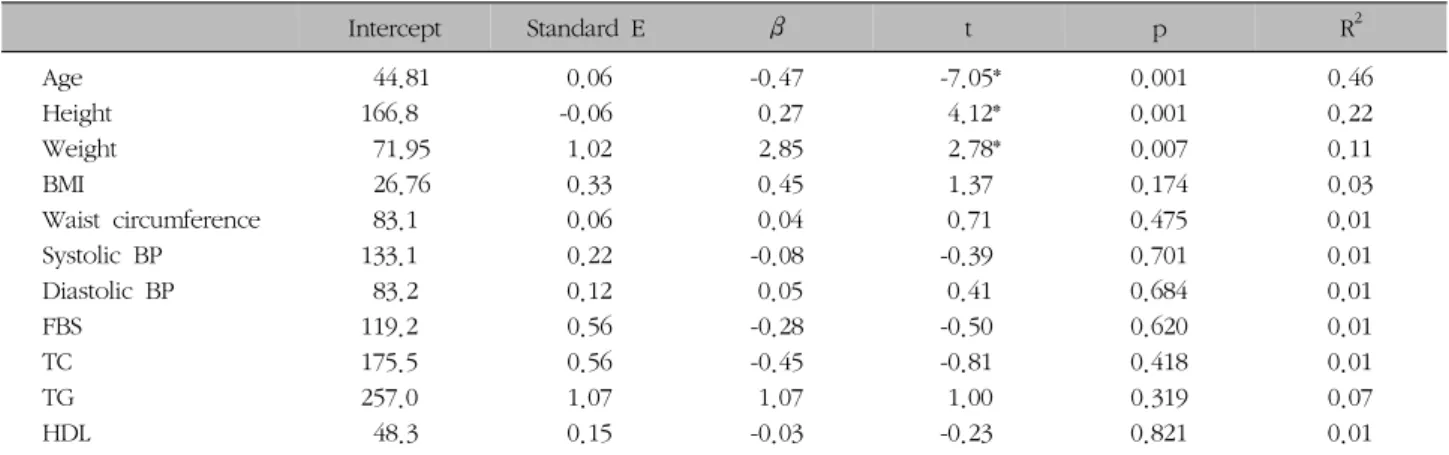
Table III. Regression Analysis of the Relationship between BMD and Metabolic Syndrome Factor Ect
Intercept Standard E β t p R2
Age 44.81 0.06 -0.47 -7.05* 0.001 0.46
Height 166.8 -0.06 0.27 4.12* 0.001 0.22
Weight 71.95 1.02 2.85 2.78* 0.007 0.11
BMI 26.76 0.33 0.45 1.37 0.174 0.03
Waist circumference 83.1 0.06 0.04 0.71 0.475 0.01
Systolic BP 133.1 0.22 -0.08 -0.39 0.701 0.01
Diastolic BP 83.2 0.12 0.05 0.41 0.684 0.01
FBS 119.2 0.56 -0.28 -0.50 0.620 0.01
TC 175.5 0.56 -0.45 -0.81 0.418 0.01
TG 257.0 1.07 1.07 1.00 0.319 0.07
HDL 48.3 0.15 -0.03 -0.23 0.821 0.01
*p<0.05.
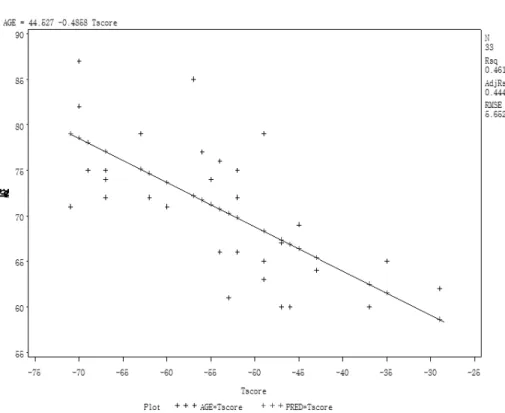
Fig. 1. The correlation between BMD and Tscore.
relation in systolic blood pressure, blood glucose, total cholesterol and HDL in sequence. BMD showed neg- ative correlation with only age (r=0.317, p<0.05) (Table II) and T-score and BMD did not have sig- nificant correlation with each other (Fig. 1).
Regression analysis was done by taking T-score as in- dependent variables and taking other factors as depend- ent variables. It was possible to know that age (β=
-0.471, t=-7.050) with p<0.001, height (β=0.277, t=
4.120) and weight (β=2.856, t=2.780) with p<0.05 have significant impact on osteoporosis (Table III).
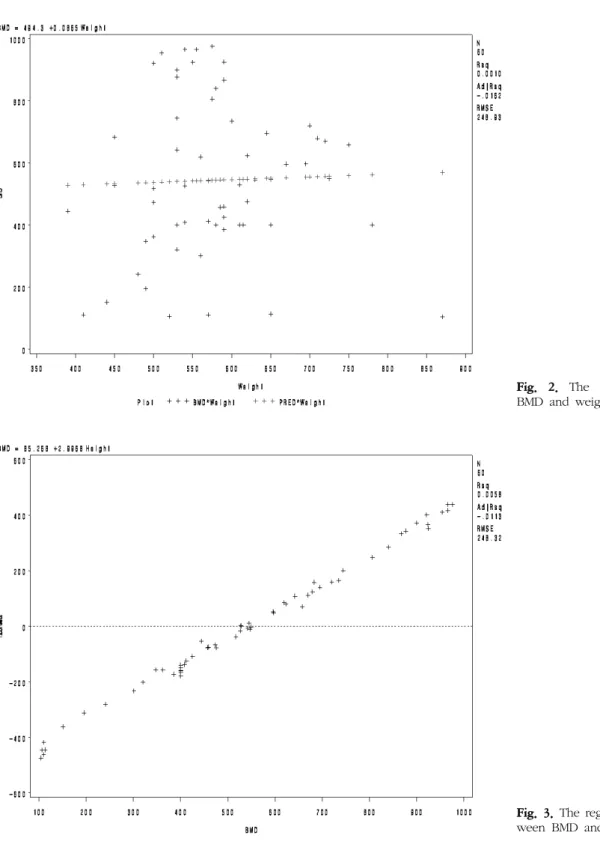
Therefore, it was possible to know that T-score and
BMD decrease as one gets older and T-score and BMD
increase as one is taller and heavier (Table III) (Fig. 2,
3).
Fig. 2. The correlation between BMD and weight.
Fig. 3. The regression analysis bet- ween BMD and height.
3. BMD dependent on the low back pain his- tory and comparison/relationship with clin- ical factors
Patients were divided into two groups, one group
with low back pain history less than 6 months and the
other group with low back pain history longer than 6
months. The clinical characteristics of each group were
compared to BMD. There were significant differences
in height (p<0.05), BMD (p<0.01) and T-score (p
Fig. 4. The correlation between LBP (under 6 ms) and Tscore.
Table IV. Statistical Signification of Various Factors according to Low Back Pain Duration
Over 6 ms (n=33) Under 6 ms (n=27) t value Pr>l t l
Age (years) 70.78±7.58 65.32±4.89 -3.54 0.001
Height (mm) 151.66±5.98 154.71±6.43 2.14 0.036
Weight (Kg) 56.28±8.72 59.48±9.08 1.54 0.129
BMI (Kg/m2) 24.26±2.72 24.77±2.81 0.76 0.449
Waist Cir (cm) 80.57±5.80 80.89±5.41 0.21 0.832
SBP (mmHg) 140.39±21.59 133.92±14.06 -1.32 0.192
DBP (mmHg) 81.93±11.65 78.89±8.41 -1.05 0.297
FBS (mg/dL) 133.66±43.41 136.32±54.28 -0.09 0.930
TC (mg/dL) 198.48±50.09 195.14±43.77 -0.07 0.941
TG (mg/dL) 205.78±95.35 201.25±8.03 -0.17 0.866
HDL (mg/dL) 49.42±13.04 49.46±13.74 0.41 0.680
T-score -5.42±1.06 -4.36±1.77 4.73 <0.001
BMD 46.40±22.67 64.25±23.84 2.95 0.004
BMI: body mass index, Cir: circumference, SBP: systolic blood pressure, DBP: diastolic blood pressure, FBS: fasting blood sugar, TC: total cholesterol, TG: triglyceride, HDL: high density lipoprotein, BMD: bone mineral density.
<0.01) between the two groups. There was no sig- nificant difference between the two groups in blood glucose, blood pressure, total cholesterol, FBS, TG, SBP, DBP, HDL, BMI and T-score (Table IV).
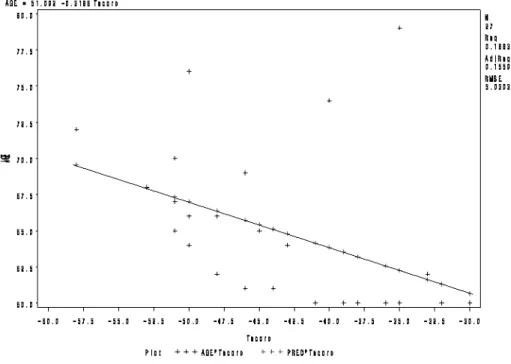
In order to learn the relationship between osteopo- rosis and clinical characteristics dependent on the length of low back pain history, correlation analysis with T-score was done. In case of low back pain his-
tory 6 months or longer, age had negative correlation (r=-0.679, p<0.001) and there were positive correla- tions in weight (r=0.420, p<0.0149), height (r=0.394, p<0.023) and BMI (r=0.368, p<0.0346) in sequence.
In case of low back pain history shorter than 6
months, age (r=-0.403, p<0.037), systolic blood pres-
sure (r=-0.385, p<0.046) and diastolic blood pressure
(r=-0.543, p<0.003) had negative correlations and
Fig. 5. The correlation between LBP (over 6 ms) and Tscore.
there was positive correlation in height (r=0.038, p
<0.019) (Fig. 4, 5). BMD had no clinical characteristic with significant correlation.
Discussion»»»
Osteoporosis is diagnosed when bone mass has de- creased to standard deviation of -2.5 or less compared to maximum BMD value of normal person
3). This study analyzed the relationship among the blood pres- sure related factors, such as physical characteristics, blood pressure and blood lipid level, by taking 60 fe- male patients who have T-score -3.0 or less, have os- teoporosis and metabolic syndrome, who are aged 61 years old or elder and who are under chronic low back pain treatment in oriental medicine clinic.
According to the result of analysis on the relation- ship between physical characteristics and osteoporosis of females who received BMD, T-score and BMD had significant (p<0.05) correlation with age, height and weight. T-score and BMD decrease when a patient is
older therefore, they have negative correlation. Age is known to have the biggest impact on osteoporosis
10,11). Causes for the decrease of BMD of senior persons are presumed as; bone metabolism change as one gets older, change of hormones which control calcium and phosphorous, decrease in physical activity as one gets older, insufficient dietary intake and lower absorption rate
10-13). Factors related to osteopenia and osteoporosis are; age is 51 years old or older, body mass index is 18.5 or less, menopause period has been 10 years or more, female who had early menopause before 45 years old, person who has fracture history, person who has absence of outdoor activity and person with- out job
13). Bone mass rapidly decreases after one pass- es 51 years old and it is generally known to be caused by hormone deficiency and aging process due to ovary function decrease after menopause, insufficient exercise and obesity
14).
This study found that T-score and BMD have pos-
itive correlation with height and weight because
T-score and BMD increase as the height is taller and
weight is heavier. It is known that BMD decrease is
faster in post-menopausal lean person than fat person.
The reason is believed that overweight person gets continuous physical stimulation on skeletal system, overweight person has a buffer when external impact is applied on bone and estrogen preventing bone con- traction is generated in fat tissue; therefore, the de- crease of BMD of obese person is delayed
15,16). BMI was reported to have positive correlation with BMD and T-score
17)however, they had no impact on each other in this study. Waist circumference is known to be a better significant indicator of obesity for Oriental people than Western people than BMI among the clin- ical characteristics of metabolic syndrome; however, there was no significance of it in this study.
According to the analysis result on the relationship between blood pressure and osteoporosis, both T-score and BMD of all patients did not have significant corre- lation with systolic blood pressure and diastolic blood pressure. It is different from previous study result which suggested that T-score and BMD decrease as blood pressure increase
18). Blood glucose and serum lipid level did not have significant correlation with T-score or BMD. This study also suggested different re- sult from previous study which suggested that total cholesterol and LDL have correlation with lumbar ver- tebra BMD. Previous studies suggested that T-score and BMD have positive correlation with HDL, which is a risk factor of cardiovascular diseases and have neg- ative correlation with total cholesterol, triglyceride and LDL
18). Cui et al.
19)reported that total cholesterol and LDL levels of pre-menopausal female have negative correlation with lumbar vertebra BMD. On the other hand, multiple studies
20-22)reported that lumbar verte- bra BMD and LDL had positive correlation, which are conflicting results with previous study. These studies did not find relationship between the BMD of post-menopausal female and serum HDL. Tanko
23)re- ported that females with osteoporosis who had meno- pause at average age have 3.9 times of cardiovascular diseases risk than females with osteopenia. and also
reported that risk of cardiovascular disease increases significantly when the patient has vertebra fracture or the number of fracture is higher.
Hyperlipidemia caused by the accumulation of cho- lesterol and triglyceride in blood vessel increases the risk of cardiovascular diseases by inducing coronary ar- tery disease. Especially, cholesterol influences the dif- ferentiation of osteoblast cell and changes BMD
24). Like this, the correlation between serum lipid level and BMD is different by each study therefore, it is difficult to make a definite conclusion on the correlation. The reason for different result by researcher is believed to be genetic difference and the variety of factors related to bone and serum lipid level.
This study is to evaluate the correlation between BMD and metabolic syndrome diagnostic criteria fac- tors. The subjects were postmenopausal osteoporosis patients with low back pain under traditional Korean medicine treatment. BMD showed negative correlation with age and significant positive correlation with weight and height. There was no significant correlation with blood glucose, blood pressure, total cholesterol, FBS, TG, blood pressure, HDL cholesterol. This results was not different from previous studies.
Therefore, if analysis would be done in the future after correcting the clinical characteristics by including other metabolic syndrome clinical characteristics such as lipid profile, it is believed that more accurate and definite conclusion may be drawn.
References»»»
1. Hall III JW, Kennedy BJ. Idiopathic osteoporosis. Arch Int Med. 1991;18:448.
2. Cho SH. Menopausal and osteoporosis. The Journal of the Korean Med Asso. 1992;35(5):587-98.
3. Takuo Fujita. Recent advances on osteoporosis. The Journal of Korean Society of Endocrinology. 1990;5(2):
92-100.
4. Claus Christiansen. The third symposium for osteopo- rosis in seoul. Cheil general hospital. 1995;43-5.
5. Reaven GM. Banting lecture 1988. Role of insulin resist- ance in human disease. Diabetes. 1988;37:1595-607.
6. Executive Summary of the Third report of the National Cholesterol Education program (NCEP) Expert Panel on Detection, Evaluation, and treatment of high Blood cho- lesterol in Adults (Adult Treatment Pannel III). JAMA.
2001;28:2486-97.
7. Baldini. Benefits of 2 years of intense exercise on bone density, physical fitness, and blood lipids in early post- menopausal osteopenic women. Archives of Internal Medicine. 2005;164:1084-91.
8. Yamaguchi T, Sugimoto T, Yano S, Yamauchi M, Sowa H, Chen Q, Chihara K. Plasma lipids and osteoporosis in postmenopausal women. A pilot study. J Am Geriatr Soc. 2003;(51):1510-1.
9. Andrea Poli, Fiorenza Bruschi, Bruno Cesana, Monica Rossi, Rodolfo Paoletti, Pier Giorgio Crosignani. Plasma low-density lipoprotein cholesterol and bone mass densi- tometry in postmenopausal women. Obstet Gynecol.
2003;102:922-6.
10. Mazess RB. On aging bone loss. Clin Orthopaed Relat Res. 1982;165:239-52.
11. Morgan DB. Aging and osteoporosis in particular spinal osteoporosis. Clin Endocronol Metabol. 1973;1:187-210.
12. Riggs BL, Wahner HW, Dunn WL, Mazess RB, Offord KP, Melton LJ. Differential changes in bone mineral den- sity of the appendicular and axial skeleton with aging:
relationship to spinal osteoporosis. J Clin Invest. 1981;
67:328-35.
13. Saville PD. Changes in bone mass with age and alcohol- ism, J Bone Joint Surg. 1965;47A(3):492-99.
14. John JB. Anderson. The role of nutrition in the function- ing of skeletal tissue. Nutrition Reviews. 1992;50(12):
388-94.
15. Daiell H. Osteoporosis of the slender smoker. Ach
Intern Med. 1976;13:298.
16. Schindler AE, Ebert A, Friedrich E. Conversion of and rostendione to estron by human fat tissue. J Clin Endocrinol Metab. 2005;32.
17. Carranza-lira S, Rosas N, Murillo A, Martinez N, Santos J.
Osteoporosis in post menopausal women (mexico City) 1. risk factor. Int J Fertil Women Med. 2002;47(1):22-5.
18. Stolk RP, Hoes AW, Pols HA, Hofman A, DeJong PT, Lamberts SW, Grobbee DE. Insulin, hypertension and anti-hypertensitive drugs in elderly patients. J Hypertens.
1996;14(2):234-42.
19. Cui LH, Shin MH, Chung EK. Association between bone mineral densities and serum lipid profile of pre and post-menopausal women in South Korea. Osteoporosis Int. 2005;16:1975-81.
20. D’Amelio P, Pescarmona GP, Gariboldi A, Isaia GC.
High density lipoproteins (HDL) in women with post- menopausal osteoporosis: a preliminary study. Meno- pause. 2001;8:429-32.
21. Adami S, Brage V, Zamboni M. Relationship between lipids and bone mass in 2 cohorts of healthy women and men. Calcif Tissue Int. 2004;74:136-42.
22. Poli A, Bruschi F, Cesana B, Rossi M, Paoletti R, Crosignani PG. Plasma low-density lipoprotein cholester- ol and bone mass densitometry in postmenopausal women. Obste & Gynecol. 2003;102:922-6.
23. Tanko LB, Christiansen C, Cox DA, Geiger MJ, McNabb MA, Cummings SR. Relationship between osteoporosis and cardiovascular disease in postmenopausal women.
Journal of Bone & Mineral Research. 2005;20(11):1912- 20.
24. Parhami F, Garfinkel A, Demer LL. Role of lipids in osteoporosis. Arteriosclerosis, Thrombosis & Vascular Biology. 2000;20(11):2346-8.