Background and Purpose Gait impairment in patients with cognitive decline has received considerable attention over the past several decades. However, gait disturbance in dementia is often underdiagnosed. The Mini Mental State Examination (MMSE) is the most widely used screening test for dementia, and the Montreal Cognitive Assessment (MoCA) has been devel- oped for more accurate assessments of mild cognitive impairment (MCI). The purpose of this study was to determine the correlation between gait status and the scores on these screening tests for dementia.
Methods We recruited 18 patients with MCI and 19 patients with early-stage dementia. All of the participants were examined using the Korean versions of the MMSE and MoCA developed for screening dementia (MMSE-DS and MoCA-K, respectively) and a neuropsychological test to determine cognitive function. A three-dimensional motion-capture system was used to per- form objective measurements of gait in all participants. We evaluated the correlation between the screening scores and gait parameters.
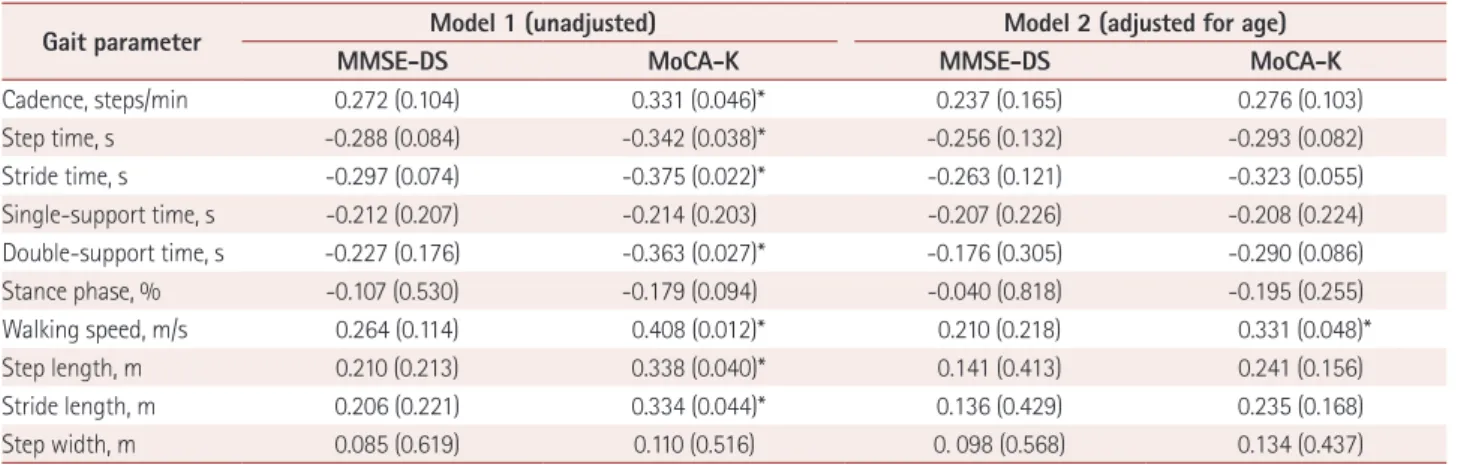
Results The MoCA-K score was significantly correlated with the walking speed (r=0.408, p<
0.05) and stride length (r=0.334, p<0.05). After adjusting for age, the MoCA-K score remained correlated with the walking speed (r=0.331, p<0.05), whereas the MMSE-DS score (r=0.264, p=0.11) and stride length (r=0.206, p=0.22) were not. The neuropsychological test revealed that walking speed and stride length were significantly correlated with memory and frontal lobe function.
Conclusions We found that the MoCA-K reflects the gait status in patients with cognitive de- cline more accurately than does the MMSE-DS. Our results suggest that the MoCA-K has more advantages than the MMSE-DS as a screening tool for dementia.
Key Words mild cognitive impairment, cognitive dysfunction, Alzheimer disease, gait analysis, mental status and dementia test.
The Correlation between Cognition Screening Scores and Gait Status from Three-Dimensional Gait Analysis
INTRODUCTION
The incidence of dementia is increasing rapidly worldwide as populations age, which is in- creasing social burdens. Alzheimer’s disease (AD) is the most common of the various eti- ologies of dementia.1 Reportedly 1.0–2.5% of elderly people with normal cognition progress to dementia annually, while 10–15% of mild cognitive impairment (MCI) patients progress to AD within 5 years.2 MCI is thus the prodromal state prior to AD.3 This trend has result- ed in recent research and health policy strategies focusing on the early diagnosis and iden- tification of biomarkers of AD. Therefore, a brief cognitive screening test that is easy to use in outpatient clinics is crucial for the early diagnosis of dementia.
The Mini Mental Status Examination (MMSE), which was developed in 1975, is the most widely used screening tool in clinical practice. The MMSE is both easy to apply and rapid.4 Jongki Choia
Jinse Parkb Byung-Inn Leeb Kyoung jin Shinb Sunmi Yooa Hyoeun Kima Wooyoung Jangc Ji Sun Kimd Jinyoung Yound Engseok Ohe
a Departments of Family Medicine and
b Neurology, Haeundae Paik Hospital, Busan, Korea
c Department of Neurology, Gangneung Asan Hospital,
University of Ulsan College of Medicine, Gangneung, Korea
d Department of Neurology, Samsung Medical Center, College of Medicine Sungkyunkwan University, Seoul, Korea
e Department of Neurology,
Chungnam National University Hospital, Daejeon, Korea
pISSN 1738-6586 / eISSN 2005-5013 / J Clin Neurol 2019;15(2):152-158 / https://doi.org/10.3988/jcn.2019.15.2.152
Received May 3, 2018 Revised October 15, 2018 Accepted October 15, 2018 Correspondence Jinse Park, MD
Department of Neurology, Haeundae Paik Hospital, 875 Haeun-daero,
Haeundae-gu, Busan 48108, Korea Tel +82-51-797-2086
Fax +82-51-797-0298 E-mail [email protected]
cc This is an Open Access article distributed under the terms of the Creative Commons Attribution Non-Com- mercial License (https://creativecommons.org/licenses/by-nc/4.0) which permits unrestricted non-commercial use, distribution, and reproduction in any medium, provided the original work is properly cited.
JCN
Open Access ORIGINAL ARTICLEChoi J et al.
JCN
However, the sensitivity of the MMSE for detecting MCI or early-stage dementia is insufficient due to a ceiling effect.
The ceiling effect is a limitation of measurement which can- not distinguish patients with from normal elderly.5 Further- more, the MMSE is greatly influenced by education level and is not useful for illiterate patients.6 To overcome this limita- tion, the Montreal Cognitive Assessment (MoCA) was de- veloped in 2005 as a brief screening tool for MCI.7 It has been demonstrated that the MoCA can sufficiently assess various cognitive domains such as executive function and attention that could not be assessed well using the MMSE.
The MoCA is also known to be more sensitive than the MMSE for assessing MCI.
Gait disturbance in the elderly, termed “senile gait,” has received considerable attention during the past decade. It is well known that gait impairment in the elderly is a major factor contributing to hospitalization, institutionalization, and death.8 Gait deficits and falls are more common in pa- tients with dementia than in cognitively normal elderly per- sons,9 with the severity of gait disturbance being closely relat- ed to the severity of cognitive impairment.10 The correlation between cognitive impairment and gait disturbance is well es- tablished, as reported in many recently published papers.11-13 Executive function is the cognitive domain that is most rele- vant to gait performance, and it plays a key role in the plan- ning, goal-directed action, and coordination of complex lo- comotion.14
Based on this evidence, the gait status is well reflected in cognitive screening tests that assess executive function. This makes it possible to assess not only the cognitive function but also the gait status in the elderly, with appropriate inter- ventions then being applied if necessary. However, to our knowledge no previous study has investigated the correlation between gait parameters and scores on cognitive screening tests such as the MMSE and MoCA in patients with cogni- tive impairment. The purpose of the present study was there- fore to determine the correlation between cognitive screening scores and gait parameters in patients with cognitive impair- ment using objective gait measurements.
METHODS
This study had a prospective, cross-sectional, observational design. The primary endpoint was to investigate the correla- tion between dementia screening tools and gait parameters, and the main secondary endpoint was to compare the gait status between MCI and dementia patients. An additional secondary endpoint was to evaluate the correlation between cognitive function and gait parameters.
Subjects
This study enrolled 37 subjects. The inclusion criteria were as follows: 1) aged 60–90 years, 2) score on the Korean ver- sion of the MMSE for screening dementia (MMSE-DS) be- low two SDs compared to age- and education-matched healthy persons, 3) able to walk, and 4) willing to participate in the study. The exclusion criteria were as follows: 1) difficulty walking due to additional medical issues such as orthopedic or neurological conditions, 2) presence of cardiopulmonary disease, 3) high risk of falling during the examinations, 4) psy- chiatric disease such as depression or anxiety, or 5) abnormal brain CT or MRI findings in an initial examination of de- mentia, including vascular burden or ventricular enlargement.
Because psychiatric diseases were excluded, none of the in- cluded participants were taking medications (including anti- psychotic medications) that are known to cause gait distur- bance.15 We could not exclude the presence of hypertension, but none of the participants were taking flunarizine or cin- narizine.
All of the study procedures were approved by the Human Research Ethics Committee of Haeundae Paik Hospital (IRB No: 2018-04-022), and all of the participants provided writ- ten informed consent.
Study design and neuropsychological battery The Korean version of the MMSE developed for screening dementia (MMSE-DS) was applied as a screening test at De- mentia Support Center in Korea. Persons with cognitive im- pairment suspected to be dementia were referred to Hospital for a definitive diagnosis. We defined cognitive impairment as cognitive decline quantified by an MMSE-DS score that was at least two SDs below the mean values for age- and education- matched healthy persons.
After being interviewed by a neurologist, all participants were assessed for a diagnosis of dementia using the Korean version of the Consortium to Establish a Registry for Alzheim- er’s Disease (CERAD-K) as a neuropsychological battery, the Korean version of the Instrumental Activities of Daily Living (K-IADL), and the Korean version of the MoCA de- veloped for screening dementia (MoCA-K), a brain CT scan, and a laboratory test. The neurologist provided a final diag- nosis after all of the tests had been completed.
Based on neuropsychiatric and laboratory tests, MCI and AD were diagnosed by applying clinical criteria.16,17
Gait analysis
Objective gait quantification was performed using three-di- mensional (3D) motion-capture system at Haeundae Paik Hospital. We used the VICON (Oxford, UK) motion analysis system at a sampling rate of 100 Hz to assess the spatiotem-
Cognition Scores and Gait Status in Cognitive Decline
JCN
poral variables of gait performance. This 3D motion-capture system has high test–retest and intertester reliabilities.18 The subjects were instructed to walk along a 6-m track while being monitored by 12 infrared cameras installed on the ceiling for capturing their motion in a quiet and comfort- able environment. All participants were instructed to walk at their usual pace without any walking aids, and attempted to perform the test three times. Our 3D motion-analysis system captured a single gait cycle in the middle of the track.
All data were calculated as the average of the gait parameters in three trials.
A recent study of gait analysis in the elderly classified the spatiotemporal gait performance into the following five do- mains19: 1) the “rhythm” domain was characterized by ca- dence, step time, stride time, swing time, stance time, and single-support time, 2) the “phases” domain was character- ized by swing, stance, single-support time, and double-sup- port time, 3) the “pace” domain was characterized by walk- ing speed, step length, and stride length, 4) the “base-of- support domain” was characterized by step width and step- width variability, and 5) the “variability” domain was characterized by variability parameters other than step-width variability. In the present study we measured cadence, step time, stride time, single-support time, double-support time, stance phase, walking speed, step length, stride length, and step width. We also estimated the gait variability by calculat- ing the coefficient of variance (CoV) as (SD/mean)×100%.
Statistical analyses
The SPSS software (version 18, SPSS Inc., Chicago, IL, USA) was used for statistical analyses. Continuous variables are ex- pressed as mean±SD values. Categorical variables in demo- graphic data were analyzed using the chi-square test. The Pearson correlation coefficient was used for investigating correlations.
The independent t-test was adopted for comparing the gait status between MCI and AD. We used analysis of covariance (ANCOVA) to adjust for confounding factors in correlation analyses. Because age is a major factor correlated with the de- mentia score, we attempted to determine the net effect of gait
on MMSE-DS and MoCA-K by adjusting age using AN- COVA.
RESULTS
Table 1 lists the demographic data of all participants in the MCI and AD groups, including age, sex, height, weight, body mass index, and length of education. The 37 included sub- jects were aged 76.70±7.52 years (range 61–89 years) and consisted of 15 males and 22 females with a length of edu- cation of 7.51±3.96 years (range 0–14 years). The mean ages were 74.72 years and 78.58 years in the MCI and AD groups, respectively (p=0.120), the corresponding mean heights were 156.69 cm and 157.84 cm (p=0.696), and the correspond- ing mean lengths of education were 7.72 years and 7.32 years (p=0.760).
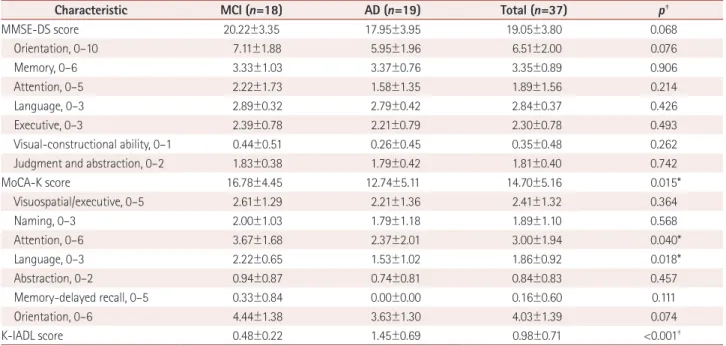
The results of the cognitive screening tests and the K- IADL are summarized in Table 2. The mean MMSE-DS and MoCA-K total scores were 19.05 and 14.70, respectively. The mean MMSE-DS score did not differ significantly between the MCI and AD groups (20.22 and 17.95, respectively, p=
0.068), while the mean MoCA-K score was significantly high- er in the MCI group than in the AD group (16.78 and 12.74, respectively, p=0.015). The attention and language subscale scores on the MoCA-K differed significantly between the two groups, whereas there were no significant differences in the subscale scores on the MMSE-DS. The K-IADL is a ma- jor tool for discriminating MCI and AD, and the mean K- IADL score differed significantly between the two groups (p<
0.001).
In addition to the MoCA-K and K-IADL scores, the follow- ing gait parameters also differed between the MCI and AD groups after adjusting age: cadence, step time, stride time, double-support time, and walking speed (Table 3). There were no differences in CoV between MCI and AD for any of the gait parameters that reflect gait variability. The cadence, walking speed, step length, and stride length were significantly lower in the AD group than in the MCI group, while the step time, stride time, double-support time, and stance phase were Table 1. General characteristics of the participants
Characteristic MCI (n=18) AD (n=19) Total (n=37) p*
Age, years 74.72±7.14 78.58±57.56 76.70±7.52 0.120
Gender, male/female 7/11 8/11 15/22 N/A
Height, cm 156.69±7.80 157.84±9.83 157.28±8.80 0.696
Weight, kg 57.89±8.21 57.72±10.66 57.80±9.42 0.958
BMI, kg/m2 23.66±3.64 23.01±2.48 23.32±3.07 0.528
Education, years 7.72±4.01 7.32±4.00 7.51±3.96 0.760
Data are mean±SD or n values.
*Independent t-test.
AD: Alzheimer’s disease, BMI: body mass index, MCI: mild cognitive impairment, N/A: not applicable.
Choi J et al.
JCN
significantly higher in the AD group. There was no signifi- cant intergroup difference in step width.
There were no significant correlations between the total
MMSE-DS score and any of the gait parameters in either group, whereas the total MoCA-K score was significantly correlated with most of the gait parameters including cadence, step time, Table 2. Cognitive assessments and scores on the K-IADL
Characteristic MCI (n=18) AD (n=19) Total (n=37) p‡
MMSE-DS score 20.22±3.35 17.95±3.95 19.05±3.80 0.068
Orientation, 0–10 7.11±1.88 5.95±1.96 6.51±2.00 0.076
Memory, 0–6 3.33±1.03 3.37±0.76 3.35±0.89 0.906
Attention, 0–5 2.22±1.73 1.58±1.35 1.89±1.56 0.214
Language, 0–3 2.89±0.32 2.79±0.42 2.84±0.37 0.426
Executive, 0–3 2.39±0.78 2.21±0.79 2.30±0.78 0.493
Visual-constructional ability, 0–1 0.44±0.51 0.26±0.45 0.35±0.48 0.262
Judgment and abstraction, 0–2 1.83±0.38 1.79±0.42 1.81±0.40 0.742
MoCA-K score 16.78±4.45 12.74±5.11 14.70±5.16 0.015*
Visuospatial/executive, 0–5 2.61±1.29 2.21±1.36 2.41±1.32 0.364
Naming, 0–3 2.00±1.03 1.79±1.18 1.89±1.10 0.568
Attention, 0–6 3.67±1.68 2.37±2.01 3.00±1.94 0.040*
Language, 0–3 2.22±0.65 1.53±1.02 1.86±0.92 0.018*
Abstraction, 0–2 0.94±0.87 0.74±0.81 0.84±0.83 0.457
Memory-delayed recall, 0–5 0.33±0.84 0.00±0.00 0.16±0.60 0.111
Orientation, 0–6 4.44±1.38 3.63±1.30 4.03±1.39 0.074
K-IADL score 0.48±0.22 1.45±0.69 0.98±0.71 <0.001†
Data are mean±SD or n values.
*p<0.05, †p<0.01, ‡Independent t-test.
AD: Alzheimer’s disease, K-IADL: Korean Instrumental Activities of Daily Living, MCI: mild cognitive impairment, MMSE-DS: Mini Mental Status Exami- nation-dementia screening, MoCA-K: Korean version of the Montreal Cognitive Assessment.
Table 3. Comparison of gait performance between MCI and AD patients
Gait parameter Model 1 (unadjusted) Model 2 (adjusted for age)
MCI (n=18) AD (n=19) p‡ MCI (n=18) AD (n=19) p§
Cadence, steps/min 103.67±10.63 92.68±8.53 0.001† 103.15±2.29 93.17±2.23 0.004†
Cadence CoV, % 4.03±2.57 4.88±2.19 0.285 4.15±0.57 4.76±0.55 0.453
Step time, s 0.57±0.06 0.63±0.06 0.006† 0.57±0.02 0.63±0.01 0.015*
Step time CoV, % 4.46±2.75 4.88±2.98 0.657 4.62±0.68 4.73±0.67 0.913
Stride time, s 1.17±0.13 1.31±0.12 0.002† 1.18±0.03 1.30±0.03 0.007†
Stride time CoV, % 4.04±2.50 4.96±2.23 0.247 4.16±0.57 4.85±0.55 0.393
Single-support time, s 0.42±0.05 0.44±0.06 0.147 0.42±0.01 0.44±0.01 0.163
Single-support time CoV, % 4.71±4.04 6.69±3.63 0.126 4.71±0.93 6.69±0.91 0.146
Double-support time, s 0.34±0.06 0.43±0.10 0.002† 0.35±0.02 0.43±0.02 0.008†
Double-support time CoV, % 10.55±5.33 9.35±5.90 0.519 10.55±1.37 9.36±1.33 0.545
Stance phase, % 64.73±1.85 66.77±2.92 0.016* 64.98±0.56 66.54±0.54 0.057
Stance phase CoV, % 2.11±1.17 2.11±1.40 0.995 2.13±0.31 2.08±0.30 0.916
Walking speed, m/s 0.78±0.16 0.60±0.15 0.002† 0.76±0.03 0.63±0.03 0.006†
Walking speed CoV, % 7.96±5.12 7.73±5.63 0.894 8.33±1.27 7.38±1.23 0.598
Step length, m 0.46±0.07 0.40±0.10 0.037* 0.45±0.02 0.41±0.02 0.153
Step length CoV, % 6.50±4.02 5.78±6.20 0.681 6.96±1.21 5.34±1.18 0.350
Stride length, m 0.90±0.14 0.79±0.19 0.046* 0.87±0.03 0.81±0.03 0.188
Stride length CoV, % 6.56±4.12 5.34±5.57 0.454 7.06±1.11 4.87±1.08 0.176
Step width, m 0.17±0.05 0.19±0.05 0.148 0.17±0.01 0.19±0.01 0.173
Step width CoV, % 8.48±5.30 8.28±4.57 0.906 8.54±1.20 8.22±1.17 0.849
Data are mean±SD in Model 1 and mean±standard-error in Model 2.
*p<0.05, †p<0.01, ‡Independent t-test, §Analysis of covariance.
AD: Alzheimer’s disease, CoV: coefficient of variance, MCI: mild cognitive impairment.
Cognition Scores and Gait Status in Cognitive Decline
JCN
stride time, double-support time, stance phase, walking speed, step length, and stride length in both groups (Table 4). Among these gait parameters, walking speed exhibited the strongest correlation with the total MoCA-K score (r=0.408, p<0.05;
Fig. 1). After adjusting age, there was a strong correlation be- tween MoCA-K score and walking speed (r=0.331, p=0.048).
The correlations between the gait parameters and the sub- scale items of the CERAD-K, which is a precise neuropsycho- logical test rather than a cognitive screening test, were ana- lyzed (Table 5). The results indicated that walking speed was correlated with verbal fluency (reflecting executive function),
word-list memory, and word-list recall (reflecting short-term memory and delay memory, respectively).
DISCUSSION
The results obtained in this study demonstrate that the MoCA- K assesses gait status more accurately than does the MMSE- DS, which is in accordance with previous reports. Some per- formance criteria in the timed up-and-go with dual-task test were previously found to be significantly correlated with the MoCA score but not associated with the MMSE score in subjects older than 60 years who exercised regularly.20 An- other study demonstrated that the MoCA was more closely associated with fragility status than was the MMSE.21 Previ- ous reports have demonstrated that the MoCA has a lower ceiling effect. In a comparative validation study of the MoCA and the MMSE for evaluating MCI and AD, the MoCA ex- hibited high sensitivities of 90% and 100%, respectively, whereas the MMSE exhibited sensitivities of only 18% and 78%.18 Those findings support the strengths and advantages of the MoCA-K over the MMSE-DS as a dementia screening tool. Our results have demonstrated that the MoCA-K can discriminate MCI from AD and be used to quantify the gait status and frontal lobe function.
We can postulate several possible explanations for our re- sults. First, the MoCA-K may be a better tool for determin- ing gait status because the ceiling effect is smaller than that for the MMSE-DS.20-22 Indeed, the MoCA-K scores in the present study differed significantly between the MCI and AD groups, whereas the MMSE-DS scores did not. It is well es- tablished that gait is closely related to cognition in patients with dementia. Our results also showed that memory and executive function were significantly correlated with gait pa- rameters in CERAD-K. We postulate that the MoCA-K score Table 4. Correlation between the screening scores and gait parameters
Gait parameter Model 1 (unadjusted) Model 2 (adjusted for age)
MMSE-DS MoCA-K MMSE-DS MoCA-K
Cadence, steps/min 0.272 (0.104) 0.331 (0.046)* 0.237 (0.165) 0.276 (0.103)
Step time, s -0.288 (0.084) -0.342 (0.038)* -0.256 (0.132) -0.293 (0.082)
Stride time, s -0.297 (0.074) -0.375 (0.022)* -0.263 (0.121) -0.323 (0.055)
Single-support time, s -0.212 (0.207) -0.214 (0.203) -0.207 (0.226) -0.208 (0.224)
Double-support time, s -0.227 (0.176) -0.363 (0.027)* -0.176 (0.305) -0.290 (0.086)
Stance phase, % -0.107 (0.530) -0.179 (0.094) -0.040 (0.818) -0.195 (0.255)
Walking speed, m/s 0.264 (0.114) 0.408 (0.012)* 0.210 (0.218) 0.331 (0.048)*
Step length, m 0.210 (0.213) 0.338 (0.040)* 0.141 (0.413) 0.241 (0.156)
Stride length, m 0.206 (0.221) 0.334 (0.044)* 0.136 (0.429) 0.235 (0.168)
Step width, m 0.085 (0.619) 0.110 (0.516) 0. 098 (0.568) 0.134 (0.437)
Data are Pearson correlation coefficient (p) values.
*p<0.05.
MMSE-DS: Mini Mental Status Examination-dementia screening, MoCA-K: Korean version of the Montreal Cognitive Assessment.
1.4 1.2 1.0 0.8 0.6 0.4 0.2 0.0
Walking speed (m/s)
0 5 10 15 20 25 30 MoCA-K
Fig. 1. Correlation between the walking speed and the MoCA score.
Walking speed as determined by the three-dimensional motion-cap- ture system was significantly correlated with the score on the MoCA- K in patients with mild cognitive impairment or Alzheimer’s disease (r=0.408, p<0.05). MoCA-K: Korean version of the Montreal Cognitive Assessment.
Choi J et al.
JCN
reflects the gait performance as well as changes in cognition in MCI.
Second, the MoCA-K contains items for evaluating frontal lobe function. Frontal lobe function, and in particular execu- tive function, is closely related to the initiation and modu- lation of gait performance in humans.23 Indeed, normal- pressure hydrocephalus and vascular parkinsonism—wherein the projection fibers from the basal ganglia to the frontal cortex are disrupted—cause gait disturbance. We postulate that the MoCA-K can be used to determine the gait status because this tool assesses frontal lobe function, whereas the MMSE-DS does not.
This study is the first to have quantitatively investigated gait status and compare the scores on screening tests for de- mentia using a 3D motion-capture system. Such systems are considered the most accurate in the field of gait research.
We found that all gait parameters including cadence, step time, stride time, double-support time, walking speed, step length, and stride length were significantly associated with the MoCA-K score. Gait parameters interact each other, but walking speed is a representative gait parameter that is com- monly used for investigating physical activity and gait per- formance in the elderly.22
We applied the CERAD-K as a precise neuropsychologi- cal assessment containing word fluency, Boston naming, memory recall (verbal and constructional), and apraxia tests. We found that walking speed was significantly corre- lated with word fluency and memory function. Although memory function is the most-prominent cognitive domain associated with gait performance, scores on the word fluen- cy test were also found to be related to gait status, which is in accordance with previous reports.11 Our results indicated that apraxia is not associated with cadence, walking speed, or stride length (except for the double-support time). These findings suggest that gait disturbance in patients with cogni- tive impairment is associated with a hypokinetic gait rather than gait apraxia.
We also found that all of gait parameters of the MCI pa- tients differed significantly from those of early-stage demen- tia patients. The patients with MCI could perform physical activities at a normal level, unlike the patients with dementia.
Many reports on gait impairment in MCI have been pub- lished over the past few decades, and several studies have demonstrated that gait impairment is the earliest sign of cog- nitive decline.11 Additionally, gait and physical activity are strongly correlated with the prognosis of patients with demen- Table 5. Correlation between the items of the Korean version of the Consortium to Establish a Registry for Alzheimer’s Disease and gait parameters
Gait parameters Verbal fluency
Boston naming test
Word-list memory
(first)
Word-list memory (second)
Word-list memory
(third)
Word-list recall
Word-list recognition
Constructional praxis
Constructional recall Cadence, steps/min 0.189
(0.262)
0.272 (0.103)
0.338 (0.041)*
0.352 (0.033)*
0.322 (0.052)
0.414 (0.011)*
0.308 (0.064)
0.288 (0.084)
0.211 (0.217)
Step time, s -0.154
(0.364)
-0.290 (0.082)
-0.335 (0.043)*
-0.344 (0.037)*
-0.304 (0.067)
-0.384 (0.019)*
-0.338 (0.041)*
-0.314 (0.058)
-0.220 (0.197) Stride time, s -0.212
(0.208)
-0.317 (0.056)
-0.339 (0.040)*
-0.352 (0.033)*
-0.311 (0.061)
-0.405 (0.013)*
-0.299 (0.072)
-0.321 (0.053)
-0.251 (0.140) Single-support time, s -0.156
(0.356)
-0.221 (0.188)
-0.226 (0.179)
-0.189 (0.262)
-0.157 (0.354)
-0.226 (0.179)
-0.112 (0.510)
-0.051 (0.765)
-0.204 (0.233) Double-support time, s -0.201
(0.233)
-0.266 (0.112)
-0.267 (0.110)
-0.338 (0.041)*
-0.305 (0.067)
-0.375 (0.022)*
-0.305 (0.066)
-0.443 (0.006)†
-0.196 (0.252) Stance phase, % -0.246
(0.143)
-0. 171 (0.313)
-0.141 (0.406)
-0.228 (0.175)
-0.225 (0.180)
-0.297 (0.074)
-0.173 (0.306)
-0.348 (0.035)*
-0.157 (0.359) Walking speed, m/s 0.339
(0.040)*
0.255 (0.128)
0.311 (0.061)
0.379 (0.021)*
0.419 (0.010)†
0.520 (0.001)†
0.183 (0.278)
0.279 (0.095)
0.210 (0.219)
Step length, m 0.290
(0.082)
0.194 (0.250)
0.223 (0.185)
0.307 (0.065)
0.328 (0.047)*
0.397 (0.015)*
0.083 (0.625)
0.240 (0.153)
0.176 (0.306) Stride length, m 0.281
(0.092)
0.186 (0.270)
0.217 (0.198)
0.298 (0.073)
0.332 (0.045)*
0.388 (0.018)*
0.065 (0.701)
0.235 (0.162)
0.153 (0.372)
Step width, m -0.167
(0.322)
0.275 (0.099)
-0.255 (0.128)
-0.124 (0.463)
-0.211`
(0.210)
-0.006 (0.974)
0.112 (0.508)
0.005 (0.979)
-0.025 (0.884) Data are Pearson correlation coefficient (p) values.
*p<0.05, †p<0.01.
Cognition Scores and Gait Status in Cognitive Decline
JCN
tia.23 Our results suggest that, like the activities of daily living, gait status differs between AD and MCI. Based on our results and previous evidence, measuring the gait status should be considered for the screening and monitoring of dementia.
The MMSE-DS is used in Korea for the nationwide screen- ing of dementia in accordance with the guidelines set by the Ministry of Public Health and Welfare. The current findings suggest that the current screening system should be replaced by new screening tools. Our results propose that combining the MoCA-K with the K-IADL would constitute the most-ap- propriate screening tool for dementia.
This study was subject to the following limitations: 1) the sample was small, 2) we could not compare the results for the patients with those of age-matched controls, 3) we could not check various walking situations such as fast walking, dual-task walking, and running, 4) we could not estimate the exact gait variability due to small number of trials, and 5) de- spite the application of several exclusion criteria, we could not perfectly control various confounding factors including personal variability. Future studies should therefore investi- gate various gait patterns, gait variability, considering addi- tional confounding factors.
In conclusion, this study has shown that the MoCA-K is a more helpful screening tool than the MMSE-DS for reflect- ing gait status as well as discriminating MCI and AD. There was a significant difference in the gait parameters between the MCI and AD groups as well as MoCA-K and K-IADL scores.
Our results suggest that the MoCA-K has several advantag- es over the MMSE-DS for screening dementia.
Conflicts of Interest
The authors have no potential conflicts of interest to disclose.
Acknowledgements
This research was supported by the 2016 University Specialization Project.
REFERENCES
1. Kukull WA, Higdon R, Bowen JD, McCormick WC, Teri L, Schellen- berg GD, et al. Dementia and Alzheimer disease incidence: a prospec- tive cohort study. Arch Neurol 2002;59:1737-1746.
2. Plassman BL, Langa KM, Fisher GG, Heeringa SG, Weir DR, Of- stedal MB, et al. Prevalence of cognitive impairment without demen- tia in the United States. Ann Intern Med 2008;148:427-434.
3. Dubois B, Albert ML. Amnestic MCI or prodromal Alzheimer’s dis- ease? Lancet Neurol 2004;3:246-248.
4. Folstein MF, Folstein SE, McHugh PR. “Mini-mental state.” A practi- cal method for grading the cognitive state of patients for the clinician.
J Psychiatr Res 1975;12:189-198.
5. Nelson A, Fogel BS, Faust D. Bedside cognitive screening instru- ments. A critical assessment. J Nerv Ment Dis 1986;174:73-83.
6. Uhlmann RF, Larson EB. Effect of education on the mini-mental state
examination as a screening test for dementia. J Am Geriatr Soc 1991;
39:876-880.
7. Nasreddine ZS, Phillips NA, Bédirian V, Charbonneau S, Whitehead V, Collin I, et al. The Montreal Cognitive Assessment, MoCA: a brief screening tool for mild cognitive impairment. J Am Geriatr Soc 2005;
53:695-699.
8. Verghese J, LeValley A, Hall CB, Katz MJ, Ambrose AF, Lipton RB.
Epidemiology of gait disorders in community-residing older adults. J Am Geriatr Soc 2006;54:255-261.
9. Montero-Odasso M, Verghese J, Beauchet O, Hausdorff JM. Gait and cognition: a complementary approach to understanding brain func- tion and the risk of falling. J Am Geriatr Soc 2012;60:2127-2136.
10. Mielke MM, Roberts RO, Savica R, Cha R, Drubach DI, Christianson T, et al. Assessing the temporal relationship between cognition and gait: slow gait predicts cognitive decline in the Mayo Clinic Study of Aging. J Gerontol A Biol Sci Med Sci 2013;68:929-937.
11. Savica R, Wennberg AM, Hagen C, Edwards K, Roberts RO, Hollman JH, et al. Comparison of gait parameters for predicting cognitive de- cline: the Mayo Clinic Study of Aging. J Alzheimers Dis 2017;55:559- 12. Ble A, Volpato S, Zuliani G, Guralnik JM, Bandinelli S, Lauretani F, 567.
et al. Executive function correlates with walking speed in older per- sons: the InCHIANTI study. J Am Geriatr Soc 2005;53:410-415.
13. Verghese J, Wang C, Lipton RB, Holtzer R, Xue X. Quantitative gait dysfunction and risk of cognitive decline and dementia. J Neurol Neu- rosurg Psychiatry 2007;78:929-935.
14. Alvarez JA, Emory E. Executive function and the frontal lobes: a me- ta-analytic review. Neuropsychol Rev 2006;16:17-42.
15. Shin HW, Chung SJ. Drug-induced parkinsonism. J Clin Neurol 2012;
8:15-21.
16. Albert MS, DeKosky ST, Dickson D, Dubois B, Feldman HH, Fox NC, et al. The diagnosis of mild cognitive impairment due to Al- zheimer’s disease: recommendations from the National Institute on Aging-Alzheimer’s Association workgroups on diagnostic guidelines for Alzheimer’s disease. Alzheimers Dement 2011;7:270-279.
17. McKhann GM, Knopman DS, Chertkow H, Hyman BT, Jack CR Jr, Kawas CH, et al. The diagnosis of dementia due to Alzheimer’s dis- ease: recommendations from the National Institute on Aging-Al- zheimer’s Association workgroups on diagnostic guidelines for Al- zheimer’s disease. Alzheimers Dement 2011;7:263-269.
18. Meldrum D, Shouldice C, Conroy R, Jones K, Forward M. Test-retest reliability of three dimensional gait analysis: including a novel ap- proach to visualising agreement of gait cycle waveforms with Bland and Altman plots. Gait Posture 2014;39:265-271.
19. Hollman JH, McDade EM, Petersen RC. Normative spatiotemporal gait parameters in older adults. Gait Posture 2011;34:111-118.
20. Lima LC, Ansai JH, Andrade LP, Takahashi AC. The relationship be- tween dual-task and cognitive performance among elderly partici- pants who exercise regularly. Braz J Phys Ther 2015;19:159-166.
21. Chen S, Honda T, Narazaki K, Chen T, Nofuji Y, Kumagai S. Global cognitive performance and frailty in non-demented community-dwell- ing older adults: findings from the Sasaguri Genkimon Study. Geriatr Gerontol Int 2016;16:729-736.
22. Graham JE, Fisher SR, Bergés IM, Kuo YF, Ostir GV. Walking speed threshold for classifying walking independence in hospitalized older adults. Phys Ther 2010;90:1591-1597.
23. Cesari M, Kritchevsky SB, Penninx BW, Nicklas BJ, Simonsick EM, Newman AB, et al. Prognostic value of usual gait speed in well-func- tioning older people--results from the Health, Aging and Body Com- position Study. J Am Geriatr Soc 2005;53:1675-1680.