Introduction
The clinical application of echocardiography for prenatal imaging has the major advantage that it is non-invasive, easy accessible and can be used in pregnancy to study the fetus in a truly physiological state. A wide variety of echocardiographic methods have been used for evaluation of fetal anatomy and cardiac function.1)
There are several reports about diastolic cardiac function in the human fetal heart. However, the data was different accord- ing to investigators.2-7)
Diastolic performances of right and left ventricles change in a fetus and E/A ratio of atrioventricular valves and ventricular diastolic compliance change before and after birth. The major- ity of diastolic filling during the initial fetal period occurs to- wards the end diastolic period and this pattern is observed in
adults with disease.8-10) A fetus relies on atrial contraction which is used as an additional pump that increases ventricular filling.11) Diastolic pattern of left and right ventricles changes as age increases but the normal diastolic filling pattern present in adults is not observed until 1 year of postnatal life during which diastolic filling pattern constantly changes.11)
Diastolic function is complex and its interpretation by Dop- pler investigation is challenging in abnormal conditions such as congenital heart diseases, intrauterine growth retardation,12) fetuses of diabetic mothers.13) Gestational diabetes mellitus has been used as a model of diastolic dysfunction in fetuses owing to myocardial hypertrophy and the consequent reduc- tion of ventricular compliance.13)
Pseudonormalization may mask severe dysfunction with re- duced compliance and relaxation. Furthermore, Doppler flow ORIGINAL ARTICLE J Cardiovasc Ultrasound 2012;20(2):85-89
Atrioventricular Flow Wave Patterns before and after Birth by Fetal
Echocardiography
Han Wool Kim, MD, Hyo Yeon Lee, MD, Soo Jin Baik, BS and Young Mi Hong, MD
Department of Pediatrics, School of Medicine, Ewha Womans University, Seoul, Korea
Background: Doppler echocardiographic measurements of both valves during intrauterine life can be used to calculate peak early filling velocity (E)/late peak atrial filling velocity (A) ratio as a single index of diastolic performance. The purposes of this study were to estimate the changes in atrioventricular valve flow from gestational age 37-40 weeks to 1 month of postnatal life and to clarify the difference in right and left ventricular diastolic filling patterns.
Methods: Atrioventricular flow waves were analyzed in 24 full-term pregnant women by fetal echocardiography. Postnatal follow-up studies were performed at 1 hour, 6 hours, 24 hours, 3 days, 1 week and 1 month. In each time point, pulsed Doppler echocardiography was used to interrogate Doppler waveform of E velocity, A velocity, total area under the curve (time velocity integral) and heart rate.
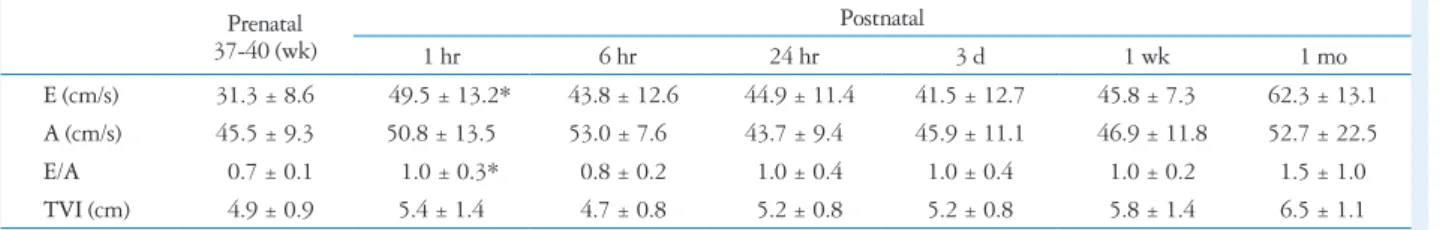
Results: Mitral E/A ratio significantly increased from 0.7 ± 0.1 before birth to 1.0 ± 0.3 at postnatal 1 hour, 1.0 ± 0.2 at 1 week, and 1.5 ± 1.0 at 1 month. Tricuspid flow E/A ratio was 0.8 ± 0.3 before birth, 0.8 ± 0.1 at 1 hour, 0.8 ± 0.2 at 3 days, 0.9 ± 1.0 at 1 month. Time velocity integral of tricuspid flow was significantly higher than that of mitral flow before birth, but there was no difference after birth.
Conclusion: The dominance of mitral A wave before birth was changed very quickly after birth to the dominance of E wave, but the dominance of tricuspid A wave was maintained at 1 month. Diastolic function and compliance of mitral valve were better than those of the tricuspid valve after birth.
KEY WORDS: Fetal echocardiography · Atrioventricular valve flow.
• Received: February 15, 2012 • Revised: April 26, 2012 • Accepted: May 15, 2012
• Address for Correspondence: Young Mi Hong, Department of Pediatrics, School of Medicine, Ewha Womans University, 1071 Anyangcheon-ro, Yangcheon-gu, Seoul 158-710, Korea Tel: +82-2-2650-2841, Fax: +82-2-2653-3718, E-mail: [email protected]
• This is an Open Access article distributed under the terms of the Creative Commons Attribution Non-Commercial License (http://creativecommons.org/licenses/by-nc/3.0) which permits unrestricted non-commercial use, distribution, and reproduction in any medium, provided the original work is properly cited.
velocity patterns are influenced by loading conditions.14) This study aims to examine the difference in atrioventricu- lar diastolic performances by evaluating the changes in atrio- ventricular valve flow from gestational age 37-40 weeks to the first month of postnatal life.
Methods
Study population
Fetal echocardiography was prospectively performed in 24 normal human fetuses of gestational age 37-40 weeks and at 1 hour, 6 hours, 24 hours, 3 days, 1 week and 1 month of post- natal life between Jan 2003 and Dec 2008.
Normal pregnant women without diabetes, hypertension or eclampsia were only included and fetuses with cardiac disease and twins were excluded. This study was carried out with the approval of the ethics committee of Ewha Womans University Hospital Institutional Review Board and written informed consents were obtained from all subjects.
Echocardiography
Fetal echocardiography was performed according to stan- dard recommendations15) using IU22 (Philips Medical Sys- tems, Bothwell, WA, USA) with 5 MHz, 3.5 MHz transduc- ers. Sample volume size used in Doppler echocardiography was 2 mm and 100 Hz filter was used. The Doppler beam in- tercepted blood flow at an angle less than 20 and Doppler echocardiographic measurements were made while the fetus made no movement. The anatomical structure of a normal fe-
tus was confirmed in 4 chamber, short axis, aortic arch and ductal views. Doppler waveform across mitral and tricuspid valves was measured distal to the valves using a 4 chamber view. Peak early filling velocity (E) during the early diastolic phase and peak atrial filling velocity (A) during the late dia- stolic phase or atrial contraction were measured to assess dia- stolic function.16) Time-velocity integral (TVI) and heart rate were measured as well.
Statistical analyses
Statistical analyses were performed using the Statistical Package for Social Sciences version (SPSS Inc., Chicago, IL, USA). The average and standard deviation of all measure- ments were collected. Statistical analysis was done using t-test and a p-value of less than 0.05 was regarded as significant.
Results
Changes in mitral flow
E velocity of prenatal mitral flow was 31.3 ± 8.6 cm/sec and it was 49.5 ± 13.2 cm/sec at 1 hour (p < 0.05), 43.8 ± 12.6 cm/sec at 6 hours, 44.9 ± 11.4 cm/sec at 24 hours, 41.5 ± 12.7 cm/sec at 3 days, 45.8 ± 7.3 cm/sec at 1 week, 62.3 ± 13.1 cm/sec at 1 month of postnatal life (Table 1, Fig. 1).
A velocity of prenatal mitral flow was 45.5 ± 9.3 cm/sec and it was 50.8 ± 13.5 cm/sec at 1 hour, 53.0 ± 7.6 cm/sec at 6 hours, 43.7 ± 9.4 cm/sec at 24 hours, 45.9 ± 11.1 cm/sec at 3 days, 46.9 ± 11.8 cm/sec at 1 week, 52.7 ± 22.5 cm/sec at 1 month of postnatal life (Table 1, Fig. 1).
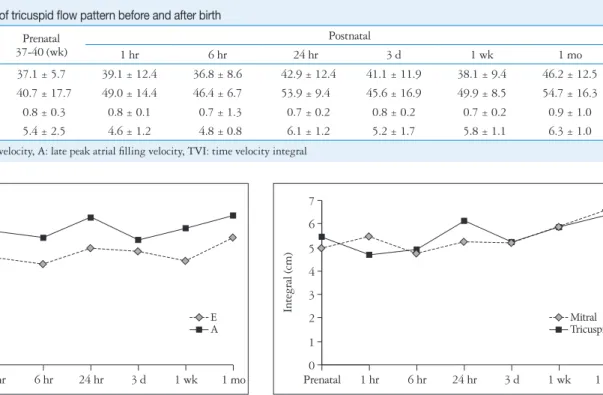
Fig. 1. Changes of mitral wave velocity according to age. *p < 0.05. E:
peak early filling velocity, A: late peak atrial filling velocity. Fig. 2. Change of E/A ratio according to age. *p < 0.05. E: peak early filling velocity, A: late peak atrial filling velocity.
0 0
10
20 0.4
30
40 0.8
60
50 1.2
70 1.6
Prenatal 1 hr 6 hr Prenatal 1 hr
* *
6 hr
24 hr 3 d 1 wk 1 mo 24 hr 3 d 1 wk 1 mo
Mitral velocity (cm/s) E/A ratio
E A Mitral
Tricuspid Table 1. Changes of mitral flow pattern before and after birth
Prenatal 37-40 (wk)
Postnatal
1 hr 6 hr 24 hr 3 d 1 wk 1 mo
E (cm/s) 31.3 ± 8.6 49.5 ± 13.2* 43.8 ± 12.6 44.9 ± 11.4 41.5 ± 12.7 45.8 ± 7.3 62.3 ± 13.1 A (cm/s) 45.5 ± 9.3 50.8 ± 13.5 53.0 ± 7.6 43.7 ± 9.4 45.9 ± 11.1 46.9 ± 11.8 52.7 ± 22.5
E/A 0.7 ± 0.1 1.0 ± 0.3* 0.8 ± 0.2 1.0 ± 0.4 1.0 ± 0.4 1.0 ± 0.2 1.5 ± 1.0
TVI (cm) 4.9 ± 0.9 5.4 ± 1.4 4.7 ± 0.8 5.2 ± 0.8 5.2 ± 0.8 5.8 ± 1.4 6.5 ± 1.1
*p < 0.05. E: peak early filling velocity, A: late peak atrial filling velocity, TVI: time velocity integral
A significant increase in E/A ratio was observed from prenatal to postnatal life. Mitral flow changed from 0.7 ± 0.1 during prenatal period to 1.0 ± 0.3 at 1 hour (p < 0.05), 0.8 ± 0.2 at 6 hours, 1.0 ± 0.4 at 1 week and 1.5 ± 1.0 at 1 month of postna- tal life (Table 1, Fig. 2).
Changes in tricuspid flow
E velocity of prenatal tricuspid flow was 37.1 ± 5.7 cm/sec and it was 39.1 ± 12.4 cm/sec at 1 hour, 36.8 ± 8.6 cm/sec at 6 hours, 42.9 ± 12.4 cm/sec at 24 hours, 41.1 ± 11.9 cm/sec at 3 days, 38.1 ± 9.4 cm/sec at 1 week, 46.2 ± 12.5 cm/sec at 1 month of postnatal life (Table 2, Fig. 3).
A velocity of prenatal tricuspid flow was 40.7 ± 17.7 cm/
sec and it was 49.0 ± 14.4 cm/sec at 1 hour, 46.4 ± 6.7 cm/
sec at 6 hours, 53.9 ± 9.4 cm/sec at 24 hours, 45.6 ± 16.9 cm/sec at 3 days, 49.9 ± 8.5 cm/sec at 1 week, 54.7 ± 16.3 cm/sec at 1 month of postnatal life (Table 2, Fig. 3).
No significant increase in E/A ratio from prenatal to postna- tal tricuspid flow was observed as it was 0.8 ± 0.3 at prenatal life, 0.8 ± 0.1 at 1 hour, 0.7 ± 1.3 at 6 hours, 0.7 ± 0.2 at 24 hours, 0.8 ± 0.2 at 3 days, 0.7 ± 0.2 at 1 week and 0.9 ± 1.0 at 1 month of postnatal life. E/A value of tricuspid valve was higher than that of mitral valve before birth but E/A value of mitral valve increased and was higher than that of tricuspid valve after birth (Table 2, Fig. 2).
A-wave dominance in mitral valve before birth quickly changed to E-wave dominance in mitral valve after birth, but A-wave dominance of prenatal tricuspid valve was maintained at least until 1 month of postnatal life. It is shown that dia-
stolic performance and compliance of left ventricle are superi- or to those of right ventricle after birth.
Time velocity integral
TVI of prenatal mitral flow was 4.9 ± 0.9 cm and it was 5.4
± 1.4 cm at 1 hour, 4.7 ± 0.8 cm at 6 hours, 5.2 ± 0.8 cm at 3 days, 5.8 ± 1.4 cm at 1 week, 6.5 ± 1.1 cm at 1 month of postnatal life (Table 1, Fig. 4).
TVI of prenatal tricuspid flow was 5.4 ± 2.5 cm and it was 4.6 ± 1.2 cm at 1 hour, 4.8 ± 0.8 cm at 6 hours, 6.1 ± 1.2 cm at 24 hours, 5.2 ± 1.7 cm at 3 days, 5.8 ± 1.1 cm at 1 week, 6.3 ± 1.0 cm at 1 month of postnatal life. TVI of tricuspid flow was significantly higher than that of mitral flow before birth, but there was no difference after birth (Table 2, Fig. 4).
Discussion
In this study, we demonstrated that the dominance of mi- tral A wave before birth was changed very quickly after birth to the dominance of E wave, but the dominance of tricuspid A wave was maintained at 1 month. Diastolic function and com- pliance of mitral valve were better than those of the tricuspid valve after birth.
The clinical application of echocardiography has advantage for prenatal diagnosis. It is noninvasive, easy accessible and can be used in pregnancy to study the fetus in a truly physio- logical state.
Blood flow patterns across atrioventricular valves in normal human fetus is examined as E and late peak A. E is related to preload and active dilation of the ventricular muscle. Late
Fig. 3. Change of tricuspid wave velocity according to age. E: peak
early filling velocity, A: late peak atrial filling velocity. Fig. 4. Change of atrioventricular valve time velocity integral according to age.
0 0
10 1
20 2
30 3
40
4 50 6
5
60 7
Prenatal 1 hr 6 hr 24 hr 3 d 1 wk 1 mo Prenatal 1 hr 6 hr 24 hr 3 d 1 wk 1 mo
Tricuspid wave velocity (cm/s) Integral (cm)
E A Mitral
Tricuspid Table 2. Changes of tricuspid flow pattern before and after birth
Prenatal 37-40 (wk)
Postnatal
1 hr 6 hr 24 hr 3 d 1 wk 1 mo
E (cm/s) 37.1 ± 5.7 39.1 ± 12.4 36.8 ± 8.6 42.9 ± 12.4 41.1 ± 11.9 38.1 ± 9.4 46.2 ± 12.5 A (cm/s) 40.7 ± 17.7 49.0 ± 14.4 46.4 ± 6.7 53.9 ± 9.4 45.6 ± 16.9 49.9 ± 8.5 54.7 ± 16.3
E/A 0.8 ± 0.3 0.8 ± 0.1 0.7 ± 1.3 0.7 ± 0.2 0.8 ± 0.2 0.7 ± 0.2 0.9 ± 1.0
TVI (cm) 5.4 ± 2.5 4.6 ± 1.2 4.8 ± 0.8 6.1 ± 1.2 5.2 ± 1.7 5.8 ± 1.1 6.3 ± 1.0
E: peak early filling velocity, A: late peak atrial filling velocity, TVI: time velocity integral
peak A is influenced by atrial contraction and ventricular compliance.17)
Diastolic filling of normal adults without any cardiac disease is divided into 3 phases. Early filling as the first phase consists of responses to pressure difference across atrium and ventricle and early dilation filling as valves open due to suction power follow- ing ventricular dilation during which ventricular pressure drops below atrial pressure. Early filling is influenced by the extent of ventricular dilation, ventricular compliance, atrial pressure, car- diac anatomy and pressures and volumes of cardiac structures.
Three-fourths of filling occurs at this phase at adulthood. The second phase is referred to as diastasis during which blood flow comes to a halt after early filling phase. The last phase consists of atrial contraction and the remaining one third blood flow is forced into ventricles.18)
The blood flow velocity of late dilation period which coin- cides with atrial contraction is higher than that of early dila- tion period across atrioventricular valves. This reflects the de- crease in compliance in fetal cardiac dilation.19) The majority of diastolic filling during the initial fetal period occurs to- wards the end diastolic period and this pattern is observed in adults with disease.8-10) A fetus relies on atrial contraction which is used as an additional pump that increases ventricular fill- ing.18) Diastolic pattern of left and right ventricles changes as age increases but the normal diastolic filling pattern present in adults is not observed until 1 year of postnatal life during which diastolic filling pattern constantly changes.18)
As gestational age increased, E/A value of both mitral and tricuspid valves increased significantly.18) When the late gesta- tion and the immediately period after birth were compared, E/A value of mitral valve significantly increased while that of tricuspid valve did not show a significant change. E/A value of mitral valve increased significantly during the first year after birth and that of tricuspid valve also increased but the increase was insignificant. Comparing mitral and tricuspid valves of fetal and neonatal periods, E/A values showed a significant changes and a greater variation was observed in a fetal period.
E/A values of mitral and tricuspid valves exhibited significant differences during the fetal period while no such pattern was observed during the neonatal period.
The data was different according to investigators. Ishii et al.20) reported that although A-wave dominance of prenatal mitral valve quickly changes after birth to E-wave dominance, A-wave dominance of prenatal tricuspid valve is maintained for at least 5 days after birth. Hong10) measured peak early sys- tolic velocity and peak late systolic velocity of mitral valve at 1 day, 1 week and 1 month after birth and reported that the velocities increased significantly over time. E/A values also in- creased significantly. After one month of postnatal life, left ven- tricular diastolic function increased analogously to that in childhood. In our study, prenatal mitral A wave dominance changed quickly to E wave dominance after birth as well.
However, tricuspid A wave dominance was maintained until
at least 1 month after birth. Diastolic function and compli- ance of left ventricle were superior to those of right ventricle after birth.
According to Veille et al.21) the TVI of mitral and tricuspid flow increases constantly over the fetal period during which the TVI of tricuspid flow is significantly higher than that of mitral flow. Mitral flow TVI increases significantly while that of tricuspid flow shows a constant increase that is statistically insignificant. The TVI of the right ventricle takes dominance in fetal period which changes to the left ventricle TVI domi- nance in neonatal period. Fernández Pineda et al.9) demon- strated that E and E/A values show a significant linear increase in both mitral and tricuspid valves while A value has no varia- tion during the gestational period. Doppler velocity through tricuspid valve is higher than that through mitral valve. Mi- tral E/A ratio is greater than that of tricuspid which decreases over time. A value, however, does not change over time and this indicates that tricuspid compliance is maintained. E value influences the E/A value variation and this implies that ven- tricular dilation, compliance and preload increase over time.
Reed et al.22) reported A wave dominance in 97% of the fe- tuses studied. Both mitral and tricuspid E/A ratios increase significantly over gestational period. Also, peak E of mitral valve increases according to gestational age while constant.
Diastolic function of a fetus is in accord with compliance which increases over the gestational period.1) E wave, A wave and E/A ratio of tricuspid valve was reported to be significant- ly higher than those of mitral valve in other studies,23-26) but no significant difference between tricuspid and mitral valves was observed in our study.
The limitation of this study includes the small population size. Inter-observer correlation was not determined in this study because all data were analyzed by the same investigator.
In conclusion, the dominance of mitral A wave before birth was changed very quickly after birth to the dominance of E wave, but the dominance of tricuspid A wave was maintained at 1 month. Diastolic function and compliance of mitral valve were better than those of the tricuspid valve after birth.
Further studies are needed to identify definite predictors of poor prognosis in high-risk pregnancies. Future prospective studies including those with multicenters and a larger popula- tion group are warranted.
References
1. Watanabe S, Hashimoto I, Saito K, Watanabe K, Hirono K, Uese K, Ichida F, Saito S, Miyawaki T, Niemann P, Sahn DJ. Character- ization of ventricular myocardial performance in the fetus by tissue Doppler imaging. Circ J 2009;73:943-7.
2. Pacileo G, Paladini D, Russo MG, Pisacane C, Santoro G, Calabrò R. Echocardiographic assessment of ventricular filling pressure during the second and third trimesters of gestation. Ultrasound Obstet Gynecol 2000;
16:128-32.
3. Miyake T. Doppler echocardiographic studies of diastolic cardiac function in the human fetal heart. Kurume Med J 2001;48:59-64.
4. Aoki M, Harada K, Ogawa M, Tanaka T. Quantitative assessment of right ventricular function using doppler tissue imaging in fetuses with and without heart failure. J Am Soc Echocardiogr 2004;17:28-35.
5. Carceller-Blanchard AM, Fouron JC. Determinants of the Doppler flow velocity profile through the mitral valve of the human fetus. Br Heart J 1993;70:457-60.
6. Huhta JC, Strasburger JF, Carpenter RJ, Reiter A, Abinader E.
Pulsed Doppler fetal echocardiography. J Clin Ultrasound 1985;13:247- 54.
7. Huhta JC. Right ventricular function in the human fetus. J Perinat Med 2001;29:381-9.
8. Kim HS, Hong YM, Kim GH. Evaluation of pulmonary venous, mi- tral and aortic flow pattern by Doppler echocardiography in neonates. J Ko- rean Pediatr Soc 1994;37:596-605.
9. Fernández Pineda L, Tamariz-Martel Moreno A, Maître Azcárate MJ, López Zea M, Rico Gómez F, Cazzaniga Bullón M, Quero Ji- ménez M. Contribution of Doppler atrioventricular flow waves to ventricu- lar filling in the human fetus. Pediatr Cardiol 2000;21:422-8.
10. Hong YM. Pulmonary venous flow pattern by Doppler echocardiography before and after closure of ductus arteriosus in newborns. J Korean Pediatr Soc 1994;37:1213-9.
11. Alverson DC, Aldrich M, Angelus P, Backstrom C, Werner S. Lon- gitudinal trends in left ventricular cardiac output in healthy infants in the first year of life. J Ultrasound Med 1987;6:519-24.
12. Naujorks AA, Zielinsky P, Beltrame PA, Castagna RC, Petracco R, Busato A, Nicoloso AL, Piccoli A, Manica JL. Myocardial tissue Dop- pler assessment of diastolic function in the growth-restricted fetus. Ultra- sound Obstet Gynecol 2009;34:68-73.
13. Hatém MA, Zielinsky P, Hatém DM, Nicoloso LH, Manica JL, Piccoli AL, Zanettini J, Oliveira V, Scarpa F, Petracco R. Assessment of diastolic ventricular function in fetuses of diabetic mothers using tissue Doppler. Cardiol Young 2008;18:297-302.
14. Clur SA, Oude Rengerink K, Mol BW, Ottenkamp J, Bilardo CM.
Fetal cardiac function between 11 and 35 weeks’ gestation and nuchal translucency thickness. Ultrasound Obstet Gynecol 2011;37:48-56.
15. Lee W, Allan L, Carvalho JS, Chaoui R, Copel J, Devore G, Hecher K, Munoz H, Nelson T, Paladini D, Yagel S; ISUOG Fetal Echo- cardiography Task Force. ISUOG consensus statement: what constitutes a
fetal echocardiogram? Ultrasound Obstet Gynecol 2008;32:239-42.
16. Pacileo G, Paladini D, Pisacane C, Palmieri S, Russo MG, Calabrò R. Role of changing loading conditions on atrioventricular flow velocity pat- terns in normal human fetuses. Am J Cardiol 1994;73:991-3.
17. Kleinman CS, Donnerstein RL. Ultrasonic assessment of cardiac func- tion in the intact human fetus. J Am Coll Cardiol 1985;5(1 Suppl):84S- 94S.
18. Choi JY, Noh CI, Yun YS. Study on Doppler waveforms from the fetal cardiovascular system. Fetal Diagn Ther 1991;6:74-83.
19. Kleinman CS, Donnerstein RL, Jaffe CC, DeVore GR, Weinstein EM, Lynch DC, Talner NS, Berkowitz RL, Hobbins JC. Fetal echo- cardiography. A tool for evaluation of in utero cardiac arrhythmias and monitoring of in utero therapy: analysis of 71 patients. Am J Cardiol 1983;51:237-43.
20. Ishii A, Tatsunami S, Satoh I, Honma T, Hamada H, Yago N.
Growth dynamics of the heart from perinatal period to childhood. J Perinat Med 1990;18:459-63.
21. Veille JC, Smith N, Zaccaro D. Ventricular filling patterns of the right and left ventricles in normally grown fetuses: a longitudinal follow-up study from early intrauterine life to age 1 year. Am J Obstet Gynecol 1999;180:
849-58.
22. Reed KL, Sahn DJ, Scagnelli S, Anderson CF, Shenker L. Doppler echocardiographic studies of diastolic function in the human fetal heart:
changes during gestation. J Am Coll Cardiol 1986;8:391-5.
23. Reed KL, Meijboom EJ, Sahn DJ, Scagnelli SA, Valdes-Cruz LM, Shenker L. Cardiac Doppler flow velocities in human fetuses. Circulation 1986;73:41-6.
24. De Smedt MC, Visser GH, Meijboom EJ. Fetal cardiac output esti- mated by Doppler echocardiography during mid- and late gestation. Am J Cardiol 1987;60:338-42.
25. Hata T, Aoki S, Hata K, Kitao M. Intracardiac blood flow velocity waveforms in normal fetuses in utero. Am J Cardiol 1987;59:464-8.
26. Kenny JF, Plappert T, Doubilet P, Saltzman DH, Cartier M, Zollars L, Leatherman GF, St John Sutton MG. Changes in intracardiac blood flow velocities and right and left ventricular stroke volumes with gestational age in the normal human fetus: a prospective Doppler echocardiographic study. Circulation 1986;74:1208-16.