Copyrights © 2016 by The Korean Gastric Cancer Association www.jgc-online.org This is an open-access article distributed under the terms of the Creative Commons Attribution Non-Commercial License (http://creativecommons.org/
licenses/by-nc/4.0) which permits unrestricted noncommercial use, distribution, and reproduction in any medium, provided the original work is properly cited.
Introduction
Gastric cancer (GC) is one of the most common malignant cancers, and gastric tumors are biologically and genetically
heterogeneous.1-3 Several biological markers including human epidermal growth factor receptor 2 (HER2), p53, forkhead box O1A, E-cadherin, vascular epidermal growth factor receptor, and mesenchymal epidermal transition (c-MET) receptor, have been introduced.4-9 Various therapies that use these biological markers have been developed, resulting in improved treatment outcomes.9 Among these markers, the reported rates for MET overexpression and MET amplification are 4% to 98% and 1.5%
to 59.0%, respectively.9 These broad ranges could possibly be at- tributed to a variety of reasons. For example, variable antibody clones and evaluation criteria have been used to determine the expression of c-MET by immunohistochemistry (IHC) analysis Correspondence to: Hyunjin Cho
Department of Surgery, Inje University Sanggye Paik Hospital, 1342 Dongil-ro, Nowon-gu, Seoul 01757, Korea
Tel: +82-2-950-1017, Fax: +82-2-951-9389 E-mail: [email protected]
Received April 28, 2016 Revised June 9, 2016 Accepted June 10, 2016
*These authors contributed equally to this study as co-first authors.
Clinicopathological Significance and Diagnostic Accuracy of c-MET Expression by Immunohistochemistry in
Gastric Cancer: A Meta-Analysis
Jung-Soo Pyo*, Guhyun Kang1,*, and Hyunjin Cho2
Department of Pathology, Kangbuk Samsung Hospital, Sungkyunkwan University School of Medicine, Departments of 1Pathology and 2Surgery, Inje University Sanggye Paik Hospital, Seoul, Korea
Purpose: The aim of the present study was to elucidate the clinicopathological significance and diagnostic accuracy of immunohisto- chemistry (IHC) for determining the mesenchymal epidermal transition (c-MET) expression in patients with gastric cancer (GC).
Materials and Methods: The present meta-analysis investigated the correlation between c-MET expression as determined by IHC and the clinicopathological parameters in 8,395 GC patients from 37 studies that satisfied the eligibility criteria. In addition, a concordance analysis was performed between c-MET expression as determined by IHC and c-MET amplification, and the diagnostic test accuracy was reviewed.
Results: The estimated rate of c-MET overexpression was 0.403 (95% confidence interval [CI], 0.327~0.484) and it was significantly correlated with male patients, poor differentiation, lymph node metastasis, higher TNM stage, and human epidermal growth factor re- ceptor 2 (HER2) positivity in IHC analysis. There was a significant correlation between c-MET expression and worse overall survival rate (hazard ratio, 1.588; 95% CI, 1.266~1.992). The concordance rates between c-MET expression and c-MET amplification were 0.967 (95% CI, 0.916~0.987) and 0.270 (95% CI, 0.173~0.395) for cases with non-overexpressed and overexpressed c-MET, respec- tively. In the diagnostic test accuracy review, the pooled sensitivity and specificity were 0.56 (95% CI, 0.50~0.63) and 0.79 (95% CI, 0.77~0.81), respectively.
Conclusions: The c-MET overexpression as determined by IHC was significantly correlated with aggressive tumor behavior and positive IHC status for HER2 in patients with GC. In addition, the c-MET expression status could be useful in the screening of c-MET amplifica- tion in patients with GC.
Key Words: Stomach neoplasms; c-MET; Immunohistochemistry; Meta-analysis; Diagnostic test accuracy review
in different patient populations. In addition, various molecular tests, such as in situ hybridization (ISH), quantitative real-time polymerase chain reaction, and next generation sequencing, have been used to confirm the genetic alterations in c-MET, which are mostly in the form of c-MET gene amplification. The ligand for c-MET, which is a tyrosine kinase receptor, is the hepato- cyte growth factor. Upon binding of its ligand, c-MET activates downstream signaling pathways such as the ras sarcoma/effec- tor of ras/mitogen activated protein kinase and the phospha- tidylinositol 3-kinase/AKT/mechanistic target of rapamycin pathways.10,11 Consequently, the abnormal or aberrant activation of c-MET signaling results in tumor cell growth, survival, mi- gration, invasion, and tumor angiogenesis.10
Accurate evaluation tests and well-defined detailed criteria are required for the appropriate selection of patients that can benefit from targeted molecular therapies. Although molecu- lar tests, including ISH or quantitative real-time polymerase chain reaction, are more accurate and confirmatory methods for detecting gene alterations, they have several disadvantages in- cluding high costs, the requirement for multiple steps, and time consumption compared to IHC. In daily practice, cheap, simple, and popular methods, such as IHC, are ideal for screening tests.
However, unlike HER2, the evaluation criteria for c-MET ex- pression as determined by IHC have not been fully elucidated in patients with GC.12
We performed a systematic review and meta-analysis to elu- cidate the correlation between the overexpression of c-MET as determined by IHC and the clinicopathological parameters. In addition, the diagnostic accuracy of IHC was investigated using concordance analysis and performing a review of the diagnostic test accuracy.
Materials and Methods
1. Published study search and selection criteria Articles relevant to the subject of the analysis were obtained by searching the PubMed and MEDLINE databases through- out January 31, 2016 using the following key words: ‘MET’ or
‘mesenchymal epithelial transition’ and ‘IHC’. The titles and abstracts of all the searched articles were screened for exclusion.
The review articles were also screened to identify additional eligible studies. Subsequently, the search results were reviewed and studies were included in the analyses if (1) the study was performed in human cases of GC and (2) information about the
correlation between c-MET expression as determined by IHC and clinicopathological parameters, and the amplification of the c-MET gene was available. The articles were excluded if (1) they were case reports or non-original articles or (2) they were published in a language other than English.
2. Data extraction
The data from all eligible studies13-49 were extracted by two independent authors and the extracted data were the first au- thor’s name, year of publication, study location, antibody clone and manufacturer, antibody dilution ratio, evaluation criteria, number of patients analyzed, and the data allowing the estima- tion of the impact of c-MET overexpression as determined by IHC on overall survival (OS). For the meta-analysis, we extract- ed all the data associated with the results of the IHC analyses.
3. Statistical analysis
For the meta-analysis, all data were analyzed using the Comprehensive Meta-Analysis software package (Biostat, Englewood, NJ, USA). We investigated the correlation between the overexpression of c-MET as determined by IHC and clini- copathological parameters such as sex, tumor differentiation, HER2 positivity by IHC, primary tumor (T) stage, regional lymph node (N) stage, and distant metastasis (M) stage. The concordance rates were determined according to the agree- ment rates between the expression of c-MET as determined by IHC and the mutation tests. For the quantitative aggregation of survival results, the correlation between the overexpression of c-MET as determined by IHC and OS was analyzed based on the hazard ratios (HRs) that were obtained using one of three available methods. For studies lacking information on the HR or its confidence interval (CI), these variables were calculated from the presented data using the HR point estimate, log-rank statis- tic or its P-value, and the O-E statistic (the difference between the number of observed and expected events) or its variance. If data on the HR values were not available, they were estimated using the total number of events, number of patients at risk in each group, and the log-rank statistic or its P-value. Finally, if useful data were provided only in the form of graphical illustra- tions of survival distributions and survival rates, these data were extracted at specified time points to reconstruct the HR estimate and its variance under the assumption that the patients were censored at a constant rate during the time intervals.50 The pub- lished survival curves were read independently by two authors
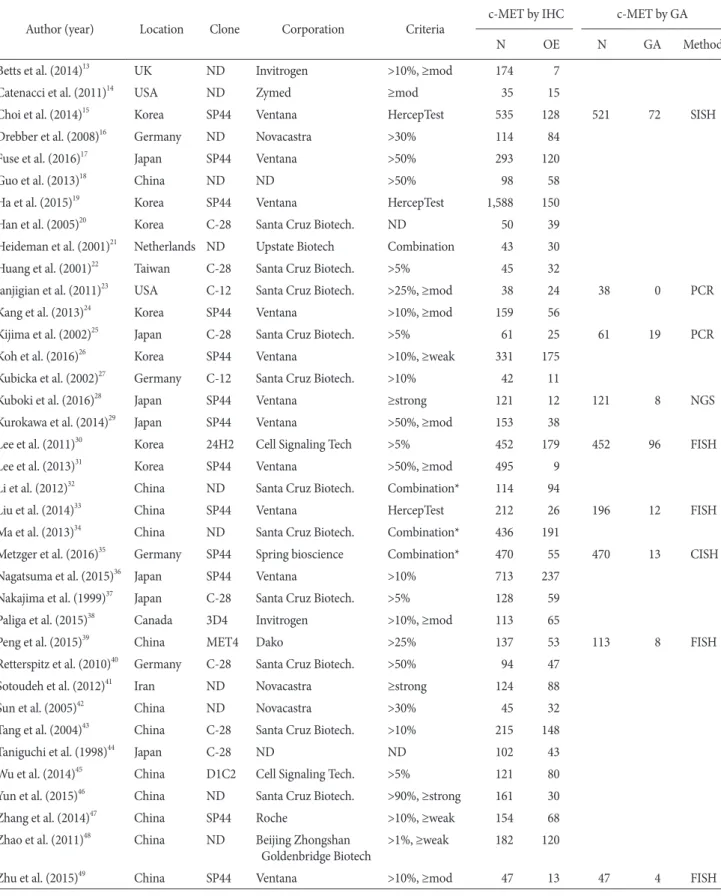
Table 1. Main characteristics of the eligible studies
Author (year) Location Clone Corporation Criteria c-MET by IHC c-MET by GA
N OE N GA Method
Betts et al. (2014)13 UK ND Invitrogen >10%, ≥mod 174 7
Catenacci et al. (2011)14 USA ND Zymed ≥mod 35 15
Choi et al. (2014)15 Korea SP44 Ventana HercepTest 535 128 521 72 SISH
Drebber et al. (2008)16 Germany ND Novacastra >30% 114 84
Fuse et al. (2016)17 Japan SP44 Ventana >50% 293 120
Guo et al. (2013)18 China ND ND >50% 98 58
Ha et al. (2015)19 Korea SP44 Ventana HercepTest 1,588 150
Han et al. (2005)20 Korea C-28 Santa Cruz Biotech. ND 50 39
Heideman et al. (2001)21 Netherlands ND Upstate Biotech Combination 43 30
Huang et al. (2001)22 Taiwan C-28 Santa Cruz Biotech. >5% 45 32
Janjigian et al. (2011)23 USA C-12 Santa Cruz Biotech. >25%, ≥mod 38 24 38 0 PCR
Kang et al. (2013)24 Korea SP44 Ventana >10%, ≥mod 159 56
Kijima et al. (2002)25 Japan C-28 Santa Cruz Biotech. >5% 61 25 61 19 PCR
Koh et al. (2016)26 Korea SP44 Ventana >10%, ≥weak 331 175
Kubicka et al. (2002)27 Germany C-12 Santa Cruz Biotech. >10% 42 11
Kuboki et al. (2016)28 Japan SP44 Ventana ≥strong 121 12 121 8 NGS
Kurokawa et al. (2014)29 Japan SP44 Ventana >50%, ≥mod 153 38
Lee et al. (2011)30 Korea 24H2 Cell Signaling Tech >5% 452 179 452 96 FISH
Lee et al. (2013)31 Korea SP44 Ventana >50%, ≥mod 495 9
Li et al. (2012)32 China ND Santa Cruz Biotech. Combination* 114 94
Liu et al. (2014)33 China SP44 Ventana HercepTest 212 26 196 12 FISH
Ma et al. (2013)34 China ND Santa Cruz Biotech. Combination* 436 191
Metzger et al. (2016)35 Germany SP44 Spring bioscience Combination* 470 55 470 13 CISH
Nagatsuma et al. (2015)36 Japan SP44 Ventana >10% 713 237
Nakajima et al. (1999)37 Japan C-28 Santa Cruz Biotech. >5% 128 59
Paliga et al. (2015)38 Canada 3D4 Invitrogen >10%, ≥mod 113 65
Peng et al. (2015)39 China MET4 Dako >25% 137 53 113 8 FISH
Retterspitz et al. (2010)40 Germany C-28 Santa Cruz Biotech. >50% 94 47
Sotoudeh et al. (2012)41 Iran ND Novacastra ≥strong 124 88
Sun et al. (2005)42 China ND Novacastra >30% 45 32
Tang et al. (2004)43 China C-28 Santa Cruz Biotech. >10% 215 148
Taniguchi et al. (1998)44 Japan C-28 ND ND 102 43
Wu et al. (2014)45 China D1C2 Cell Signaling Tech. >5% 121 80
Yun et al. (2015)46 China ND Santa Cruz Biotech. >90%, ≥strong 161 30
Zhang et al. (2014)47 China SP44 Roche >10%, ≥weak 154 68
Zhao et al. (2011)48 China ND Beijing Zhongshan
Goldenbridge Biotech >1%, ≥weak 182 120
Zhu et al. (2015)49 China SP44 Ventana >10%, ≥mod 47 13 47 4 FISH
IHC = immunohistochemistry; N = number of patients; OE = overexpression; GA = genetic alteration; ND = no description; mod = moderate intensity; SISH = silver in situ hybridization; PCR = polymerase chain reaction; weak = weak intensity; strong = strong intensity; NGS = next- generation sequencing; FISH = fluorescence in situ hybridization; CISH = chromogenic in situ hybridization. *The combination of intensity and fraction scores.
in order to reduce the interpretation bias. Subsequently, the HRs were combined into an overall HR using the Peto method.51 Be- cause eligible studies used various clones of the c-MET antibody and different evaluation criteria for various patient populations, a random-effects model was more suitable than a fixed-effects model. The heterogeneity between the studies was assessed us- ing the Q and I2 statistics, and the results were presented as P- values. Additionally, sensitivity analysis was performed to assess the heterogeneity of eligible studies and the impact of each study on the combined effect. In order to assess the publication bias, a Begg funnel plot and Egger test were used. If a significant publi- cation bias was identified, the fail-safe N and trim-fill tests were performed to confirm the degree of publication bias. P<0.05 were considered to be statistically significant.
The review of diagnostic test accuracy was performed using the Meta-Disc program version 1.4 (Unit of Clinical Biostat- ics; the Ramon y Cajal Hospital, Madrid, Spain).52 In order to calculate the pooled sensitivity and specificity, data were col- lected from each eligible study and forest plots were obtained.
The summary receiver operating characteristic (SROC) curve was initially constructed by plotting ‘sensitivity’ and ‘1-speci- ficity’ of each study, and curve fitting was performed through linear regression using the Littenberg and Moses linear models.53 Because the data were heterogeneous owing to differences in the evaluation criteria, the accuracy data were pooled by fitting
a SROC curve and measuring the value of the area under the curve (AUC).52 An AUC close to 1 would be considered a per- fect fit and an AUC close to 0.5 would be considered a poor fit.
In addition, the diagnostic odds ratio (OR) was calculated using the Meta-Disc program.
Results
1. Study selection and characteristics
In total, 3,010 reports were identified in the database search for this systematic review and meta-analysis. Among them, 77 were excluded owing to insufficiency or lack of information on the correlation between c-MET overexpression as determined by IHC and the clinicopathological parameters, and the ampli- fication of c-MET. In addition, 2,876 reports were excluded be- cause they were concerning other diseases, or they used animals or cell lines, and 20 were excluded because they were articles written in a language other than English or they were non-orig- inal articles. Finally, 37 studies were included in this systematic review and meta-analysis (Table 1, Fig. 1). The total number of patients from the 37 studies was 8,395. Table 1 shows the differ- ent clones of c-MET antibody and the evaluation criteria used in each study. The rate of c-MET overexpression as determined by IHC was 1.8% to 82.5% and the overall c-MET overexpres- sion rate as determined by IHC was 31.5% (2,641 out of 8,395
2,950 Studies excluded
2,834: Studies for other disease 60: No or insufficient information 37: Non-human
13: Articles of non-English 6: Non-original article
23 Studies excluded
17: No or insufficient information 5: Non-human
1: Non-original article 3,010 Studies identified through
database searching
Primary selection through browsing the retrieved titles and abstracts
60 Full-text articles assessed for eligibility
37 Studies included in the meta-
analysis Fig. 1. Flowchart of the study search
process and the selection methods.
patients) in the present study.
2. Clinicopathological significance of c-MET overexpression as determined by
immunohistochemistry
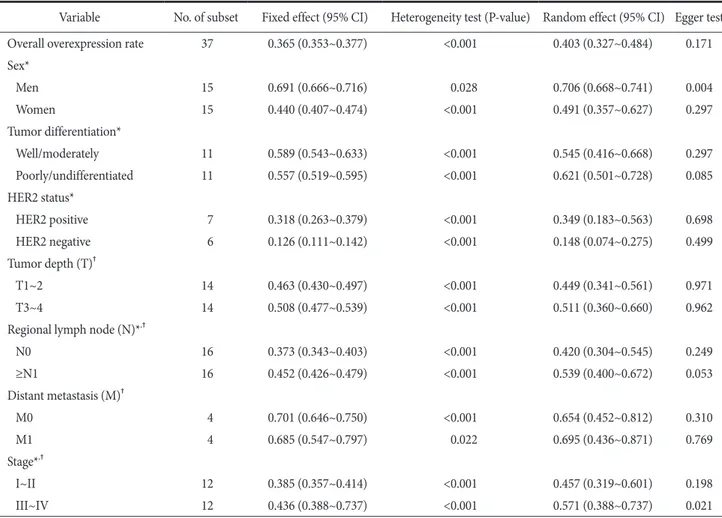
The estimated c-MET overexpression rate as determined by IHC was 0.403 (95% CI, 0.327~0.484) (Table 2). The c-MET overexpression rates in male and female patients were 0.706 (95%
CI, 0.668~0.741) and 0.491 (95% CI, 0.357~0.627), respectively.
A significant correlation was identified between c-MET over- expression as determined by IHC and poor tumor differentia- tion. The c-MET overexpression rate was significantly higher in the HER2 positive GCs than in HER2 negative GCs (0.349;
95% CI, 0.183~0.563 vs. 0.148; 95% CI, 0.074~0.275). There was a significant correlation between c-MET overexpression and N stage and TNM stage; however, the T and M stages showed no correlation. In the assessment of publication bias, the Egger
test and Begg funnel plots showed a significant publication bias for male patients and TNM III~IV stages (P=0.004 and P=0.021, respectively). To confirm the degree of publication bias for male patients and TNM III~IV stages, trim-fill and fail-safe N tests were conducted. In both groups, the publication biases were not large and the remaining groups did not show significant publica- tion biases.
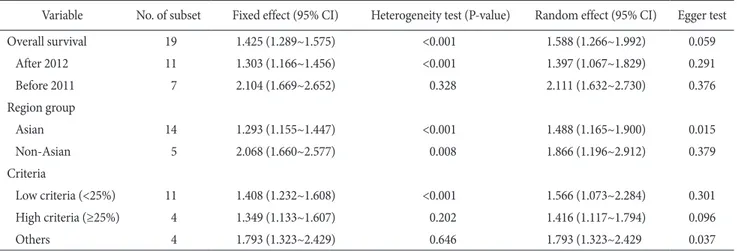
Next, we investigated the correlation between c-MET over- expression as determined by IHC and OS rate. The estimated HR was 1.588 (95% CI, 1.266~1.992) and the c-MET overex- pression was significantly correlated with worse OS rate (Table 3). Because there was a significant heterogeneity (P<0.001), subgroup analysis would be needed to identify the cause of the heterogeneity. First, subgroup analysis was performed based on the year of publication divided by published year after 2012 and before 2011. The HRs calculated for studies after 2012 and before 2011 were 1.397 (95% CI, 1.067~1.829) and 2.111 (95%
Table 2. Meta-analysis of the c-MET overexpression as determined by immunohistochemistry in gastric carcinoma
Variable No. of subset Fixed effect (95% CI) Heterogeneity test (P-value) Random effect (95% CI) Egger test
Overall overexpression rate 37 0.365 (0.353~0.377) <0.001 0.403 (0.327~0.484) 0.171
Sex*
Men 15 0.691 (0.666~0.716) 0.028 0.706 (0.668~0.741) 0.004
Women 15 0.440 (0.407~0.474) <0.001 0.491 (0.357~0.627) 0.297
Tumor differentiation*
Well/moderately 11 0.589 (0.543~0.633) <0.001 0.545 (0.416~0.668) 0.297
Poorly/undifferentiated 11 0.557 (0.519~0.595) <0.001 0.621 (0.501~0.728) 0.085
HER2 status*
HER2 positive 7 0.318 (0.263~0.379) <0.001 0.349 (0.183~0.563) 0.698
HER2 negative 6 0.126 (0.111~0.142) <0.001 0.148 (0.074~0.275) 0.499
Tumor depth (T)†
T1~2 14 0.463 (0.430~0.497) <0.001 0.449 (0.341~0.561) 0.971
T3~4 14 0.508 (0.477~0.539) <0.001 0.511 (0.360~0.660) 0.962
Regional lymph node (N)*,†
N0 16 0.373 (0.343~0.403) <0.001 0.420 (0.304~0.545) 0.249
≥N1 16 0.452 (0.426~0.479) <0.001 0.539 (0.400~0.672) 0.053
Distant metastasis (M)†
M0 4 0.701 (0.646~0.750) <0.001 0.654 (0.452~0.812) 0.310
M1 4 0.685 (0.547~0.797) 0.022 0.695 (0.436~0.871) 0.769
Stage*,†
I~II 12 0.385 (0.357~0.414) <0.001 0.457 (0.319~0.601) 0.198
III~IV 12 0.436 (0.388~0.737) <0.001 0.571 (0.388~0.737) 0.021
CI = confidence interval; HER2 = human epidermal growth factor receptor 2. *There was a significant difference between the two groups (P<0.05).
†TNM stage was based on the American Joint Committee on Cancer staging system.
CI, 1.632~2.730), respectively. In addition, the subgroup analysis performed based on the study location showed that the HRs for the Asian and non-Asian subgroups were 1.488 (95% CI, 1.165~1.900) and 1.866 (95% CI, 1.196~2.912), respectively. The HRs for subgroups formed based on low (<25%) and high (≥
25%) evaluation criteria for c-MET expression as determined by IHC were 1.566 (95% CI, 1.073~2.284) and 1.416 (95% CI, 1.117~1.794), respectively. In addition, there were no significant publication biases in the primary (Begg funnel plot and Egger test) and secondary (fail-safe N and trim-fill) tests.
3. Diagnostic accuracy of c-MET immunohistochemistry In order to evaluate the diagnostic role of the c-MET in predicting c-MET amplification, a concordance analysis was performed. The overall concordance rates between c-MET expression level as determined by IHC and c-MET amplifica- tion was 0.739 (95% CI, 0.531~0.876; Table 4). In addition, the concordance rates of the non-overexpressed and overexpressed c-MET cases were 0.967 (95% CI, 0.916~0.987) and 0.270 (95%
CI, 0.173~0.395), respectively. Subgroup analysis was performed based on the evaluation criteria for c-MET expression. The c- MET evaluation criteria were subdivided into low staining (<25%), Table 3. Meta-analysis of the correlation between c-MET overexpression as determined by immunohistochemistry and the survival rate of patients with gastric cancer
Variable No. of subset Fixed effect (95% CI) Heterogeneity test (P-value) Random effect (95% CI) Egger test
Overall survival 19 1.425 (1.289~1.575) <0.001 1.588 (1.266~1.992) 0.059
After 2012 11 1.303 (1.166~1.456) <0.001 1.397 (1.067~1.829) 0.291
Before 2011 7 2.104 (1.669~2.652) 0.328 2.111 (1.632~2.730) 0.376
Region group
Asian 14 1.293 (1.155~1.447) <0.001 1.488 (1.165~1.900) 0.015
Non-Asian 5 2.068 (1.660~2.577) 0.008 1.866 (1.196~2.912) 0.379
Criteria
Low criteria (<25%) 11 1.408 (1.232~1.608) <0.001 1.566 (1.073~2.284) 0.301
High criteria (≥25%) 4 1.349 (1.133~1.607) 0.202 1.416 (1.117~1.794) 0.096
Others 4 1.793 (1.323~2.429) 0.646 1.793 (1.323~2.429 0.037
CI = confidence interval.
Table 4. Analysis of the concordance between c-MET expression as determined by IHC and the confirmatory methods for c-MET amplification in patients with gastric cancer
Variable No. of subset Fixed effect (95% CI) Heterogeneity test (P-value) Random effect (95% CI) Egger test
Overall 18 0.608 (0.572~0.643) <0.001 0.739 (0.531~0.876) 0.624
Low criteria (<25%) 10 0.636 (0.598~0.673) <0.001 0.761 (0.507~0.908) 0.670
High criteria (≥25%) 4 0.212 (0.121~0.346) <0.001 0.623 (0.042~0.984) 0.380
Others 4 0.572 (0.456~0.680) <0.001 0.816 (0.199~0.988) 0.570
Non-overexpression by IHC 9 0.872 (0.847~0.894) <0.001 0.967 (0.916~0.987) 0.021
Low criteria (<25%) 5 0.858 (0.828~0.882) <0.001 0.949 (0.850~0.984) 0.208
High criteria (≥25%) 2 0.984 (0.892~0.998) 0.480 0.984 (0.892~0.998) -
Others 2 0.959 (0.914~0.981) 0.009 0.990 (0.684~1.000) -
Overexpression by IHC 9 0.266 (0.227~0.309) <0.001 0.270 (0.173~0.395) 0.937
Low criteria (<25%) 5 0.295 (0.248~0.347) <0.001 0.367 (0.212~0.554) 0.362
High criteria (≥25%) 2 0.117 (0.061~0.213) 0.176 0.082 (0.016~0.334) -
Others 2 0.225 (0.141~0.341) 0.602 0.225 (0.141~0.341) -
IHC = immunohistochemistry; CI = confidence interval.
high (≥25%) staining, and other. In cases showing c-MET non- overexpression, there were no significant differences between the subgroups of the evaluation criteria (low evaluation criteria:
0.949; 95% CI, 0.850~0.984 vs. high evaluation criteria: 0.984;
95% CI, 0.892~0.998 vs. other: 0.990, 95% CI, 0.684~1.000).
However, in cases showing c-MET overexpression, the concor- dance rate of the high evaluation criteria subgroup (0.082; 95%
CI, 0.016~0.334) was significantly lower than that of the other subgroups. There was no significant publication bias in the pri- mary and secondary tests.
Next, a diagnostic accuracy test review was performed. In all cases, the pooled sensitivity and specificity were 0.56 (95% CI, 0.50~0.63) and 0.79 (95% CI, 0.77~0.81), respectively (Table 5).
The sensitivity and specificity of the eligible studies were 0.25 to 1.00 and 0.53 to 0.91, respectively. The diagnostic OR and AUC on the SROC curve for all cases were 14.52 (95% CI, 3.43~61.38) and 0.878, respectively. According to the evaluation criteria, the subgroups were subdivided into low and high evaluation crite- ria and the remaining subgroups. In the subgroup showing low evaluation criteria, the pooled sensitivity and specificity were 0.53 (95% CI, 0.46~0.60) and 0.76 (95% CI, 0.73~0.78), respec- tively. The diagnostic OR and AUC on the SROC curve of the low evaluation criteria subgroup were 11.99 (95% CI, 2.04~70.47) and 0.892, respectively. In the others subgroup, all parameters of the diagnostic accuracy test review were higher than those of the low evaluation criteria subgroup. The pooled sensitivity and specificity, the diagnostic OR and AUC on the SROC curve of the other subgroup were 0.79 (95% CI, 0.60~0.92), 0.85 (95% CI, 0.82~0.87), 22.08 (95% CI, 1.40~347.21), and 0.899, respectively.
Discussion
Many preclinical and clinical studies have reported the ef- fectiveness of various c-MET inhibitors in the treatment of GC.
Although the effectiveness of c-MET was shown in preclinical
studies, its effectiveness in clinical trials is controversial. Before the evaluation of the effectiveness of c-MET inhibitors, the confirmation of evaluation criteria for c-MET expression as determined by IHC expression and gene amplification were re- quired. This study is the first meta-analysis to assess the clinico- pathological significance and diagnostic accuracy of c-MET ex- pression in patients with GC. The present study reported 4 major findings. First, the estimated overexpression rate of c-MET was 40.3% in patients with GC. Second, a higher overexpression rate of c-MET was significantly correlated with HER2 positivity, higher TNM stage, and worse OS rate. Third, the expression level of c-MET was in concordance with the c-MET gene am- plification in c-MET non-overexpressed cases, but not in the c-MET overexpressed cases. Fourth, there was no difference between the diagnostic accuracy of IHC and molecular testing.
The assessment of the eligible studies showed that the rate of c-MET overexpression was 1.8% to 82.5%. The overall rate of overexpression for c-MET was 31.5% and the estimated overexpression rate was 40.3%. In the present meta-analysis, c- MET overexpression was significantly correlated with the male sex, poor differentiation, regional lymph node metastasis, and higher TNM stage. Nevertheless, there was a positive correla- tion between the overexpression of c-MET, and tumor depth and distant metastasis without statistical significance. However, previous studies have reported various correlations between the c-MET status and clinicopathological parameters; these studies used various processing protocols, antibody clones, and dif- ferent evaluation criteria for c-MET.13-49 These discrepancies could influence the clinicopathological significance of c-MET expression as determined by IHC. To obtain the confirmatory information for c-MET, systematic review and meta-analysis for pathological validation was required.
In the eligible studies, the rates of c-MET overexpression and c-MET amplification were 31.5% (2,641 out of 8,395 pa- tients) and 11.5% (232 out of 2,019 patients), respectively. There Table 5. The sensitivity, specificity, diagnostic OR, and AUC of the summary receiver operation characteristics curve according to the evaluation criteria used in the assessment of c-MET expression as determined by immunohistochemistry
Variable Sensitivity (95% CI) Specificity (95% CI) Diagnostic OR (95% CI) AUC
Overall 0.56 (0.50~0.63) 0.79 (0.77~0.81) 14.52 (3.43~61.38) 0.878
Low criteria 0.53 (0.46~0.60) 0.76 (0.73~0.78) 11.99 (2.04~70.47) 0.892
High and other criteria 0.79 (0.60~0.92) 0.85 (0.82~0.87) 22.08 (1.40~347.21) 0.899 OR = odds ratio; AUC = area under curve; CI = confidence interval.
was a significant discrepancy between c-MET overexpression and c-MET amplification. There could be a variety of reasons that could explain this discrepancy. As described above, various antibody clones and evaluation criteria were used for the evalu- ation of c-MET expression. Indeed, the included patient popu- lation could have affected this discrepancy. In addition, the false positive c-MET expression could be one of the important causes of discrepancy. Therefore, concordance analysis and the re- view of the diagnostic test accuracy are required to confirm this discrepancy. In the present study, the overall concordance rate between c-MET overexpression and c-MET amplification was 0.739 (95% CI, 0.531~0.876). However, the concordance rate of non-expressed c-MET cases was significantly higher than that of overexpressed cases (0.967; 95% CI, 0.916~0.987), nearing 1.
The discordance of positive rates between c-MET overexpres- sion and c-MET amplification might be caused by false positive cases. According to our results, c-MET could be useful for the screening of c-MET amplification, similar to HER2 for stomach cancer.12 However, further studies should be conducted to deter- mine the accurate evaluation criteria to reduce the false positive rate.
Interestingly, in the non-overexpressed c-MET cases, the concordance rate of eligible studies with low staining was lower than that of eligible studies with high staining. In our unpub- lished data for non-small cell lung cancer, the concordance rate between c-MET expression and c-MET amplification was low- er in the low expression group than in the high criteria group. In the present diagnostic test accuracy review, the estimates of the studies with low criteria for diagnostic accuracy were lower than that of studies with other criteria, as shown Table 5. In addi- tion, in clinical trials with patients classified according to their c- MET expression status, rilotumumab showed a therapeutic effect for GC.54 In that study, c-MET overexpression was evaluated at
>25% of membrane staining and any intensity. Because the dif- ferences of evaluation criteria might have had an impact on the selected patients and the results for therapeutic effect, more de- tailed and accurate criteria for c-MET expression are required.
Previously, two studies reported a correlation between c- MET and survival rate through meta-analysis. However, the HRs between studies differed, 1.66 (95% CI, 1.17~2.36) and 2.42 (95% CI, 1.66~3.54), respectively.55,56 Each meta-analysis included 9 eligible studies. Among eligible studies of two meta- analysis, 8 eligible studies that were identical. However, the estimated HRs of some studies differed between two meta-
analyses and the largest difference reported was 1.55. However, the definitive difference between the extracting methods for survival data could not be found. The present meta-analysis in- cluded eligible studies from two previous meta-analyses. In the present meta-analysis, c-MET overexpression was significantly correlated with a poor OS rate (HR, 1.588; 95% CI, 1.266~1.992).
The eligible studies differed in their follow-up periods. In the present meta-analysis, to avoid bias from the follow-up periods, survival data were extracted after a 60-month follow-up period.
Although the follow-up period did not influence the correlation between c-MET overexpression and survival, the correlation between c-MET and survival differed from those in previous reports. Interestingly, the HRs of eligible studies before 2011 were higher than those of eligible studies after 2012 year. How- ever, the reason for the differences associated with the study year could not be elucidated. Indeed, there were no differences between the c-MET overexpression, study location, and evalua- tion criteria.
The coexpression of HER2 and c-MET was found in 12% of the GCs.27 Previous studies have reported that c-MET activa- tion was associated with the resistance against molecular targeted inhibitory therapy for epidermal growth factor receptor.57-59 Chen et al.60 has reported that GC cells can evade lapatinib- induced growth inhibition through the activation of MET and reactivation of the downstream signaling pathways. However, a synergistic effect by the dual inhibition of HER2 and MET was not found in GC cells.60 They concluded that dual inhibition is not required until the development of resistance.60 In our meta- analysis, the overexpression rate of c-MET in HER2 positive cases was significantly higher than that of the HER2 negative cases (0.349; 95% CI, 0.183~0.563 vs. 0.148; 95% CI, 0.074~0.275, respectively). This result could be useful for elucidating the cor- relation between c-MET and HER2 and for appropriate patient selection for HER2 or MET monoclonal antibody therapy. In addition, further cumulative studies are required to confirm the detailed mechanism.
There were some limitations to the current meta-analysis.
First, as described above, eligible studies used various antibody clones and evaluation criteria for evaluating the expression sta- tus of c-MET. Additional subgroup analysis based on antibody clones could not be performed due to insufficient information.
However, in sensitivity analysis, individual studies had no effects on the pooled estimates. Second, as a confirmatory test for c- MET amplification, various molecular tests, such as fluorescence
ISH, silver ISH, chromogenic ISH, polymerase chain reaction, and next generation sequencing, were used. However, the diag- nostic accuracy of c-MET IHC analysis according to the molec- ular test could not be evaluated due to insufficient information.
Third, as described above, the concordance rate of low criteria group between c-MET expression and c-MET amplification was lower than that of other criteria groups. However, 2 of the eligible studies were using high and other criteria, respectively.
Because the minimum number of included studies was 3 for the diagnostic test accuracy review, a subgroup analysis of the high and other criteria could not be performed. In order to evaluate the diagnostic accuracy of the low criteria for c-MET expres- sion, we subdivided and compared the low and others subgroups.
In conclusion, this study showed that the overexpression of c-MET significantly correlated with HER2 positivity, higher TNM stage, and worse OS rate. The cases having non-overex- pressed c-MET were in accordance with cases having c-MET gene amplification. The IHC analysis of c-MET expression could be useful for predicting prognosis and screening c-MET gene amplification in GCs.
Conflicts of Interest
No potential conflict of interest relevant to this article was reported.
References
1. Bosman FT, Carneiro F, Hruban RH, Theise ND, eds. WHO Classification of Tumours of the Digestive System. 4th ed.
Lyon: International Agency for Research on Cancer, 2010.
2. Kamangar F, Dores GM, Anderson WF. Patterns of cancer incidence, mortality, and prevalence across five continents:
defining priorities to reduce cancer disparities in different geo- graphic regions of the world. J Clin Oncol 2006;24:2137-2150.
3. Lee KH, Lee HE, Cho SJ, Cho YJ, Lee HS, Kim JH, et al. Im- munohistochemical analysis of cell cycle-related molecules in gastric carcinoma: prognostic significance, correlation with clinicopathological parameters, proliferation and apoptosis.
Pathobiology 2008;75:364-372.
4. Gravalos C, Jimeno A. HER2 in gastric cancer: a new prog- nostic factor and a novel therapeutic target. Ann Oncol 2008;19:1523-1529.
5. Ishii HH, Gobe GC, Ebihara Y. p53 is an indicator of tumor
progression in early but not advanced gastric carcinomas.
Hepatogastroenterology 2007;54:2159-2163.
6. Kim JH, Kim MK, Lee HE, Cho SJ, Cho YJ, Lee BL, et al.
Constitutive phosphorylation of the FOXO1A transcription factor as a prognostic variable in gastric cancer. Mod Pathol 2007;20:835-842.
7. Xing X, Tang YB, Yuan G, Wang Y, Wang J, Yang Y, et al. The prognostic value of E-cadherin in gastric cancer: a meta-analy- sis. Int J Cancer 2013;132:2589-2596.
8. Lieto E, Ferraraccio F, Orditura M, Castellano P, Mura AL, Pinto M, et al. Expression of vascular endothelial growth factor (VEGF) and epidermal growth factor receptor (EGFR) is an independent prognostic indicator of worse outcome in gastric cancer patients. Ann Surg Oncol 2008;15:69-79.
9. Inokuchi M, Otsuki S, Fujimori Y, Sato Y, Nakagawa M, Ko- jima K. Clinical significance of MET in gastric cancer. World J Gastrointest Oncol 2015;7:317-327.
10. Liu X, Newton RC, Scherle PA. Developing c-MET pathway inhibitors for cancer therapy: progress and challenges. Trends Mol Med 2010;16:37-45.
11. Gherardi E, Birchmeier W, Birchmeier C, Vande Woude G.
Targeting MET in cancer: rationale and progress. Nat Rev Cancer 2012;12:89-103.
12. Pyo JS, Sohn JH, Kim WH. Concordance rate between HER2 immunohistochemistry and in situ hybridization in gastric carcinoma: systematic review and meta-analysis. Int J Biol Markers 2016;31:e1-e10.
13. Betts G, Valentine H, Pritchard S, Swindell R, Williams V, Morgan S, et al. FGFR2, HER2 and cMet in gastric adenocar- cinoma: detection, prognostic significance and assessment of downstream pathway activation. Virchows Arch 2014;464:145- 156.
14. Catenacci DV, Cervantes G, Yala S, Nelson EA, El-Hashani E, Kanteti R, et al. RON (MST1R) is a novel prognostic marker and therapeutic target for gastroesophageal adenocarcinoma.
Cancer Biol Ther 2011;12:9-46.
15. Choi J, Lee HE, Kim MA, Jang BG, Lee HS, Kim WH. Analysis of MET mRNA expression in gastric cancers using RNA in situ hybridization assay: its clinical implication and comparison with immunohistochemistry and silver in situ hybridization.
PLoS One 2014;9:e111658.
16. Drebber U, Baldus SE, Nolden B, Grass G, Bollschweiler E, Di- enes HP, et al. The overexpression of c-met as a prognostic in- dicator for gastric carcinoma compared to p53 and p21 nuclear
accumulation. Oncol Rep 2008;19:1477-1483.
17. Fuse N, Kuboki Y, Kuwata T, Nishina T, Kadowaki S, Shinozaki E, et al. Prognostic impact of HER2, EGFR, and c-MET status on overall survival of advanced gastric cancer patients. Gastric Cancer 2016;19:183-191.
18. Guo T, Yang J, Yao J, Zhang Y, Da M, Duan Y. Expression of MACC1 and c-Met in human gastric cancer and its clinical significance. Cancer Cell Int 2013;13:121.
19. Ha SY, Lee J, Jang J, Hong JY, Do IG, Park SH, et al. HER2- positive gastric cancer with concomitant MET and/or EGFR overexpression: a distinct subset of patients for dual inhibition therapy. Int J Cancer 2015;136:1629-1635.
20. Han SU, Lee HY, Lee JH, Kim WH, Nam H, Kim H, et al.
Modulation of E-cadherin by hepatocyte growth factor induces aggressiveness of gastric carcinoma. Ann Surg 2005;242:676- 683.
21. Heideman DA, Snijders PJ, Bloemena E, Meijer CJ, Offerhaus GJ, Meuwissen SG, et al. Absence of tpr-met and expression of c-met in human gastric mucosa and carcinoma. J Pathol 2001;194:428-435.
22. Huang TJ, Wang JY, Lin SR, Lian ST, Hsieh JS. Overexpres- sion of the c-met protooncogene in human gastric carcinoma:
correla tion to clinical features. Acta Oncol 2001;40:638-643.
23. Janjigian YY, Tang LH, Coit DG, Kelsen DP, Francone TD, Weiser MR, et al. MET expression and amplification in patients with localized gastric cancer. Cancer Epidemiol Biomarkers Prev 2011;20:1021-1027.
24. Kang BW, Lee D, Chung HY, Han JH, Kim YB. Tetraspanin CD151 expression associated with prognosis for patients with advanced gastric cancer. J Cancer Res Clin Oncol 2013;139:1835-1843.
25. Kijima Y, Hokita S, Yoshinaka H, Itoh T, Koriyama C, Eizuru Y, et al. Amplification and overexpression of c-met gene in Epstein-Barr virus-associated gastric carcinomas. Oncology 2002;62:60-65.
26. Koh YW, Hur H, Lee D. Increased MACC1 expression indi- cates a poor prognosis independent of MET expression in gas- tric adenocarcinoma. Pathol Res Pract 2016;212:93-100.
27. Kubicka S, Claas C, Staab S, Kühnel F, Zender L, Trautwein C, et al. p53 mutation pattern and expression of c-erbB2 and c- met in gastric cancer: relation to histological subtypes, Helico- bacter pylori infection, and prognosis. Dig Dis Sci 2002;47:114- 121.
28. Kuboki Y, Yamashita S, Niwa T, Ushijima T, Nagatsuma A,
Kuwata T, et al. Comprehensive analyses using next-generation sequencing and immunohistochemistry enable precise treat- ment in advanced gastric cancer. Ann Oncol 2016;27:127-133.
29. Kurokawa Y, Matsuura N, Kawabata R, Nishikawa K, Ebisui C, Yokoyama Y, et al. Prognostic impact of major receptor tyrosine kinase expression in gastric cancer. Ann Surg Oncol 2014;21 Suppl 4:S584-S590.
30. Lee J, Seo JW, Jun HJ, Ki CS, Park SH, Park YS, et al. Impact of MET amplification on gastric cancer: possible roles as a novel prognostic marker and a potential therapeutic target. Oncol Rep 2011;25:1517-1524.
31. Lee SJ, Lee J, Sohn I, Mao M, Kai W, Park CK, et al. A survey of c-MET expression and amplification in 287 patients with hepatocellular carcinoma. Anticancer Res 2013;33:5179-5186.
32. Li Y, Chen CQ, He YL, Cai SR, Yang DJ, He WL, et al. Ab- normal expression of E-cadherin in tumor cells is associ- ated with poor prognosis of gastric carcinoma. J Surg Oncol 2012;106:304-310.
33. Liu YJ, Shen D, Yin X, Gavine P, Zhang T, Su X, et al. HER2, MET and FGFR2 oncogenic driver alterations define distinct molecular segments for targeted therapies in gastric carcinoma.
Br J Cancer 2014;110:1169-1178.
34. Ma J, Ma J, Meng Q, Zhao ZS, Xu WJ. Prognostic value and clinical pathology of MACC-1 and c-MET expression in gas- tric carcinoma. Pathol Oncol Res 2013;19:821-832.
35. Metzger ML, Behrens HM, Böger C, Haag J, Krüger S, Röcken C. MET in gastric cancer: discarding a 10% cutoff rule. Histo- pathology 2016;68:241-253.
36. Nagatsuma AK, Aizawa M, Kuwata T, Doi T, Ohtsu A, Fujii H, et al. Expression profiles of HER2, EGFR, MET and FGFR2 in a large cohort of patients with gastric adenocarcinoma. Gastric Cancer 2015;18:227-238.
37. Nakajima M, Sawada H, Yamada Y, Watanabe A, Tatsumi M, Yamashita J, et al. The prognostic significance of amplification and overexpression of c-met and c-erb B-2 in human gastric carcinomas. Cancer 1999;85:1894-1902.
38. Paliga A, Marginean H, Tessier-Cloutier B, Purgina B, Jonker D, Marginean EC. The prognostic significance of c-MET and EGFR overexpression in resected gastric adenocarcinomas.
Am J Clin Oncol 2015. doi: 10.1097/COC.0000000000000202 [In print].
39. Peng Z, Li Z, Gao J, Lu M, Gong J, Tang ET, et al. Tumor MET expression and gene amplification in Chinese patients with lo- cally advanced or metastatic gastric or gastroesophageal junc-
tion cancer. Mol Cancer Ther 2015;14:2634-2641.
40. Retterspitz MF, Mönig SP, Schreckenberg S, Schneider PM, Hölscher AH, Dienes HP, et al. Expression of {beta}-catenin, MUC1 and c-met in diffuse-type gastric carcinomas: correla- tions with tumour progression and prognosis. Anticancer Res 2010;30:4635-4641.
41. Sotoudeh K, Hashemi F, Madjd Z, Sadeghipour A, Molanaei S, Kalantary E. The clinicopathologic association of c-MET over- expression in Iranian gastric carcinomas; an immunohisto- chemical study of tissue microarrays. Diagn Pathol 2012;7:57.
42. Sun Y, Li JY, He JS, Zhou LX, Chen K. Tissue microarray analysis of multiple gene expression in intestinal metaplasia, dysplasia and carcinoma of the stomach. Histopathology 2005;46:505-514.
43. Tang Z, Zhao M, Ji J, Yang G, Hu F, He J, et al. Overexpression of gastrin and c-met protein involved in human gastric carci- nomas and intestinal metaplasia. Oncol Rep 2004;11:333-339.
44. Taniguchi K, Yonemura Y, Nojima N, Hirono Y, Fushida S, Fujimura T, et al. The relation between the growth patterns of gastric carcinoma and the expression of hepatocyte growth factor receptor (c-met), autocrine motility factor receptor, and urokinase-type plasminogen activator receptor. Cancer 1998;82:2112-2122.
45. Wu JG, Yu JW, Wu HB, Zheng LH, Ni XC, Li XQ, et al. Expres- sions and clinical significances of c-MET, p-MET and E2f-1 in human gastric carcinoma. BMC Res Notes 2014;7:6.
46. Yun C, Gang L, Rongmin G, Xu W, Xuezhi M, Huanqiu C.
Essential role of Her3 in two signaling transduction patterns:
Her2/Her3 and MET/Her3 in proliferation of human gastric cancer. Mol Carcinog 2015;54:1700-1709.
47. Zhang Z, Wang J, Ji D, Wang C, Liu R, Wu Z, et al. Functional genetic approach identifies MET, HER3, IGF1R, INSR path- ways as determinants of lapatinib unresponsiveness in HER2- positive gastric cancer. Clin Cancer Res 2014;20:4559-4573.
48. Zhao J, Zhang X, Xin Y. Up-regulated expression of Ezrin and c-Met proteins are related to the metastasis and prognosis of gastric carcinomas. Histol Histopathol 2011;26:1111-1120.
49. Zhu C, Xu J, Li M, Zhao G, Cao H. Heterogeneity of c-Met expression in Chinese gastric cancer patients. Hum Pathol 2015;46:1901-1907.
50. Parmar MK, Torri V, Stewart L. Extracting summary statistics
to perform meta-analyses of the published literature for sur- vival endpoints. Stat Med 1998;17:2815-2834.
51. Yusuf S, Peto R, Lewis J, Collins R, Sleight P. Beta blockade during and after myocardial infarction: an overview of the ran- domized trials. Prog Cardiovasc Dis 1985;27:335-371.
52. Zamora J, Abraira V, Muriel A, Khan K, Coomarasamy A.
Meta-DiSc: a software for meta-analysis of test accuracy data.
BMC Med Res Methodol 2006;6:31.
53. Moses LE, Shapiro D, Littenberg B. Combining independent studies of a diagnostic test into a summary ROC curve: data- analytic approaches and some additional considerations. Stat Med 1993;12:1293-1316.
54. Iveson T, Donehower RC, Davidenko I, Tjulandin S, Deptala A, Harrison M, et al. Rilotumumab in combination with epirubi- cin, cisplatin, and capecitabine as first-line treatment for gastric or oesophagogastric junction adenocarcinoma: an open-label, dose de-escalation phase 1b study and a double-blind, ran- domised phase 2 study. Lancet Oncol 2014;15:1007-1018.
55. Peng Z, Zhu Y, Wang Q, Gao J, Li Y, Li Y, et al. Prognostic significance of MET amplification and expression in gastric cancer: a systematic review with meta-analysis. PLoS One 2014;9:e84502.
56. Yu S, Yu Y, Zhao N, Cui J, Li W, Liu T. C-Met as a prognostic marker in gastric cancer: a systematic review and meta-analy- sis. PLoS One 2013;8:e79137.
57. Agarwal S, Zerillo C, Kolmakova J, Christensen JG, Harris LN, Rimm DL, et al. Association of constitutively activated hepa- tocyte growth factor receptor (Met) with resistance to a dual EGFR/Her2 inhibitor in non-small-cell lung cancer cells. Br J Cancer 2009;100:941-949.
58. Garrett JT, Arteaga CL. Resistance to HER2-directed antibod- ies and tyrosine kinase inhibitors: mechanisms and clinical implications. Cancer Biol Ther 2011;11:793-800.
59. Kneissl J, Keller S, Lorber T, Heindl S, Keller G, Drexler I, et al.
Association of amphiregulin with the cetuximab sensitivity of gastric cancer cell lines. Int J Oncol 2012;41:733-744.
60. Chen CT, Kim H, Liska D, Gao S, Christensen JG, Weiser MR. MET activation mediates resistance to lapatinib inhibi- tion of HER2-amplified gastric cancer cells. Mol Cancer Ther 2012;11:660-669.