Correspondence to: Moon Soo Lee
Department of Surgery, Soonchunhyang University Cheonan Hospital, 31 Suncheonhyang 6-gil, Dongnam-gu, Cheonan 330-903, Korea Tel: +82-41-570-3628, Fax: +82-41-571-0129
E-mail: [email protected] Received January 19, 2015 Revised February 8, 2015 Accepted February 8, 2015
*These authors contributed equally to this work.
Copyrights © 2015 by The Korean Gastric Cancer Association www.jgc-online.org This is an open-access article distributed under the terms of the Creative Commons Attribution Non-Commercial License (http://creativecommons.org/
licenses/by-nc/3.0) which permits unrestricted noncommercial use, distribution, and reproduction in any medium, provided the original work is properly cited.
Introduction
Despite developments in surgical techniques and improvements in the efficacies of anticancer drugs in recent years, gastric can- cer (GC) remains one of the most common malignancies and the second most common cause of cancer-related deaths worldwide.1
Therefore, the identification of new diagnostic or prognostic bio- markers for GC is one of the major goals in this field.
Recent whole-exome sequencing studies have revealed a num- ber of potential cancer-driving genes in GC. Among the frequently mutated cell-adhesion genes, FAT4 was particularly notable, rank- ing fourth in mutational significance after PKHD1, CTNNB1, and CNTN1.2
The family of FAT genes consists of the human homologs of the Drosophila Fat gene, which is involved in tumor suppression,3 control of cell proliferation during Drosophila development, and planar cell polarity.4 In addition, Fat was recently found to be a potential transmembrane receptor in the Hippo signaling pathway in Drosophila, which plays an important role in controlling organ size.5 In Drosophila, Fat inactivation causes hyperplasia of pupal
Loss of FAT Atypical Cadherin 4 Expression Is Associated with High Pathologic T Stage in Radically Resected Gastric Cancer
Hae Yoen Jung*, Hyundeuk Cho1,*, Mee-Hye Oh, Ji-Hye Lee, Hyun Ju Lee, Si-Hyong Jang, and Moon Soo Lee2 Department of Pathology, Soonchunhyang University Cheonan Hospital, 1Department of Pathology, Soonchunhyang University
College of Medicine, 2Department of Surgery, Soonchunhyang University Cheonan Hospital, Cheonan, Korea
Purpose: Recent studies have revealed recurrent alterations in the cell adhesion gene FAT4, a candidate tumor suppressor gene, in cancer. FAT atypical cadherin 4 (FAT4) is a transmembrane receptor involved in the Hippo signaling pathway, which is involved in the control of organ size. Here, we investigated the loss of FAT4 expression and its association with clinicopathological risk factors in gastric cancer.
Materials and Methods: We assessed the expression of FAT4 by using immunohistochemistry on three tissue microarrays containing samples from 136 gastric cancer cases, radically resected in the Soonchunhyang University Cheonan Hospital between July 2006 and June 2008. Cytoplasmic immunoexpression of FAT4 was semi-quantitatively scored using the H-score system. An H-score of ≥10 was considered positive for FAT4 expression.
Results: Variable cytoplasmic expressions of FAT4 were observed in gastric cancers, with 33 cases (24.3%) showing loss of expression (H-score <10). Loss of FAT4 expression was associated with an increased rate of perineural invasion (H-score <10 vs. ≥10, 36.4%
vs. 16.5%, P=0.015), high pathologic T stage (P=0.015), high tumor-node-metastasis stage (P=0.017), and reduced disease-free survival time (H-score <10 vs. ≥10, mean survival 62.7±7.3 months vs. 79.1±3.1 months, P=0.025). However, no association was found between the loss of FAT4 expression and tumor size, gross type, histologic subtype, Lauren classification, lymphovascular invasion, or overall survival.
Conclusions: Loss of FAT4 expression appears to be associated with invasiveness in gastric cancer.
Key Words: FAT4 protein; Stomach neoplasms; Surgery; Disease-free survival
imaginal discs, and loss-of-function mutations give rise to hyper- plastic tumors through increased cell proliferation and decreased cell death.6
There are four members in the FAT atypical cadherin (FAT) family in humans (FAT1, FAT2, FAT3, and FAT4). FAT1 and FAT4 suppress tumor growth via activation of Hippo signaling, while FAT1 can also promote tumor migration via induction of actin polymerization. Thus, FAT1 is both tumor suppressive and oncogenic, while FAT4 acts solely as a tumor suppressor. However, to our knowledge, protein expression levels of FAT4 have not been examined in gastric adenocarcinoma. Here, we aimed to examine immunohistochemical expression of FAT4 and its prognostic sig- nificance in gastric adenocarcinoma.
Materials and Methods
1. Patient and tissue samples
The study was retrospectively performed on a consecutive co- hort of 136 patients with GCs, who had been surgically treated in Soonchunhyang University Cheonan Hospital between July 2006 and June 2008. All tumors were histopathologically re-examined by two independent pathologists (HY Jung and HD Cho) to con- firm the diagnosis, depth of invasion, number of metastatic lymph nodes, resection margin, and lymphovascular/perineural inva- sion. Tumor stage was re-classified according to the standardized tumor-node-metastasis (TNM) 7th classification of the American Joint Committee on Cancer (AJCC).7 Clinical data, information on adjuvant chemotherapy, recurrence, vital status, and cause of death were obtained from medical records.
All the patients underwent subtotal or total gastrectomy for curative resection and 99 patients (72.8%) received adjuvant che- motherapy according to the following criteria: (1) tumors of more advanced stage than stage Ib according to the 7th AJCC cancer staging system,7 (2) patients who do not refuse chemotherapy, and (3) patients who do not respond to contraindication for chemo- therapy.
2. Tissue microarrays
Tissue microarrays (TMAs) were constructed by reviewing he- matoxylin and eosin slides, and selecting one representative forma- lin-fixed paraffin-embedded (FFPE) archival block for each case.
Core tissue biopsies (2 mm in diameter) were taken from individual FFPE blocks (donor blocks) and arranged in recipient paraffin blocks (tissue array blocks) using a trephine. In addition, normal
gastric mucosa was obtained in 16 cases using the same procedure.
Three array blocks containing 136 GC and 16 normal gastric tissue samples were prepared.
3. Immunohistochemistry and staining evaluation The expression of FAT4 in normal gastric mucosa and GCs was evaluated using immunohistochemistry. Tissue sections (4 μm) were cut from the TMAs, deparaffinized in xylene, and hydrated using an ethanol-deionized water series. Endogenous peroxidase activity was blocked using 3% H2O2 in methanol for 15 minutes.
Sections were washed, and stained with a rabbit polyclonal antibody against FAT4 (NBP1-78381; Novus biological, Littleton, CO, USA) diluted 1:50. Primary antibody binding was detected using Bond Polymer Refine Detection Kit (Leica, Wetzlar, Germany). Slides were counterstained with hematoxylin.
The predominant cytoplasmic staining intensities were designat- ed negative (0), weak (1), moderate (2), or strong (3). The fractions of FAT4-positive cells were estimated as percentages of positively staining areas, and FAT4 expression was semi-quantitatively calcu- lated using the H-score system as follows: H-score=3×percentage of strongly staining cells+2×percentage of moderately staining cells+percentage of weakly staining cells. An H-score of ≥10 was considered positive for FAT4 expression.
4. Statistical analysis
To evaluate the relationship between FAT4 expression and clini- copathological parameters, the Pearson chi-square test was used for parametric analysis whereas Fisher exact test, Mann-Whitney test, and Kruskal-Wallis test were applied for nonparametric analysis.
Overall survival (OS) and disease-free survival (DFS) rates ac- cording to FAT4 expression were calculated using Kaplan-Meier analysis. To assess differences between Kaplan-Meier curves, the log-rank test was used. DFS was calculated in all but 5 patients of stage IV according to the 7th AJCC staging system.7
Results
1. Clinicopathological characteristics of the gastric cancer patients
Among a total of 136 GC patients, there were 101 men (74.3%) and 35 women (25.7%), with a mean age of 60.2 years (range, 25 to 81 years); the mean follow-up time was 6.8 years (range, 0.8 to 7.9 years). As mentioned above, all the patients underwent subto- tal or total gastrectomy and 99 patients (72.8%) received adjuvant
chemotherapy. There were 92 advanced gastric cancer (AGC) cases (67.6%), 44 early gastric cancer (EGC) cases (32.4%), and the 5-year survival rate calculated according to the 7th AJCC stage
was 94.4% for stage I, 85.7% for stage II, and 31.7% for stage III/IV cases in this cohort.
In histologic examination, the GC samples were comprised of
A B
C D
E F
Fig. 1. Immunohistochemical staining of FAT4 in normal gastric mucosa and gastric adenocarcinoma (×200). FAT4 expression was well preserved in normal gastric mucosa (A), while tumors showed variable expressions of FAT4. Strong and diffused FAT4 expression was seen in intestinal-type gastric adenocarcinoma (B), while focal FAT4 expression was observed in intestinal- (C) and diffuse-type (D) gastric adenocarcinoma. A total loss of the expression of FAT4 was also observed in intestinal- (E) and diffuse-type (F) gastric adenocarcinoma.
81 tubular adenocarcinomas (59.6%), 47 poorly cohesive carci- nomas including signet ring cell carcinomas (34.6%), 3 mucinous adenocarcinomas (2.2%), 3 papillary adenocarcinomas (2.2%), and 2 undifferentiated carcinomas (1.5%).
2. Loss of FAT4 expression in gastric cancer
The evaluation of FAT4 expression in 16 normal gastric mu- cosa samples and 136 GC samples was shown in Fig. 1. As shown in Fig. 2, FAT4 expression was better preserved in normal gastric mucosae (mean H-score±standard deviation, 148.1±67.4) than in primary GCs, where variable cytoplasmic expression was seen (mean H-score±standard deviation, 60.0±63.1). Loss of FAT4 expression was seen in 33/136 cases of GC (24.3%) (H-score <10), including 4 cases of EGC and 29 cases of AGC. Expression of FAT4 was seen in 103/136 of GC cases (75.7%) (H-score ≥10).
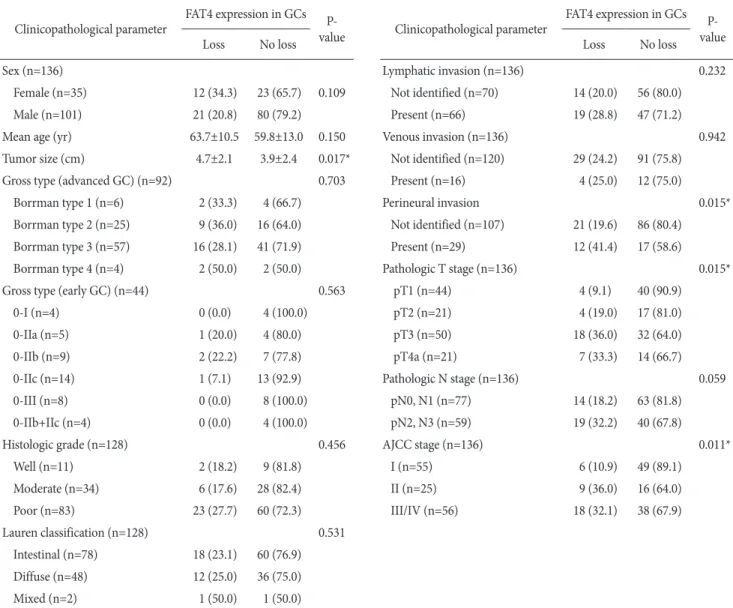
3. Association of loss of FAT4 expression with clinicopathological parameters in gastric cancer Table 1 lists the clinicopathological parameters investigated and the correspondin gostatuses of FAT4 expression. The loss of FAT4 expression in GC was significantly associated with a large tumor size (P=0.017), perineural invasion (P=0.015), more advanced T stages (P=0.015), and more advanced AJCC stages (P=0.011) (Table 1, Fig. 2). The loss of FAT4 was more frequently observed in the group with a more advanced N stage, but statistical significance was borderline (P=0.059). No association was found between FAT4 expression and sex, age, tumor location, gross type, histologic sub- type, Lauren classification, or lymphovascular invasion.
As seen in Fig. 3, the loss of FAT4 expression was significantly associated with poor DFS rates (5-year survival rate; loss vs. no loss, 68.7% vs. 86.9%, P=0.017) according to the Kaplan-Meier analysis. The FAT4-negative group was associated with a poor OS rate, but statistical significance was borderline (5-year survival rate;
loss vs. no loss, 57.6% vs. 70.9%, P=0.083) (Fig. 3). The prognostic value of FAT4 was confirmed by the univariate Cox regression analysis for the DFS rate (hazard ratio=0.415; 95% confidence interval, 0.19 to 0.92; P=0.031), but this association was not signifi- cant in the multivariate analysis (data not shown).
Otherwise, poor DFS and OS rates were significantly associated with male patients, lymphovascular invasion, perineural invasion, and more advanced pathologic T/N stages (all P<0.05). Moreover, OS rates in patients receiving adjuvant chemotherapy tended to improve than patients without adjuvant chemotherapy, especially in stage III or IV of the 7th AJCC stage (n=56); however, the number of patients without adjuvant chemotherapy was too small for the analysis to be considered powerful enough (n=8).
Discussion
During organ development, the number of cells in growing tis- sues is tightly controlled by the regulation of cellular proliferation and apoptosis to maintain a proper organ size and a specific organ shape. This is orchestrated by numerous developmental genes.8,9 The dysregulation of developmental genes is often implicated in human diseases. For example, FAT1, an isoform of the atypical cadherin, has been reported to induce liver fibrosis, which is also
A
*
Tumor Normal
300
200
100
0
T1 T2 T3 T4a
300
200
100
0
I II III/IV
300
200
100
0 44
59 3
*
44
40
44
3340
*
*
B C
H-score
State of gastric mucosa Pathologic T stage AJCC stage
H-score H-score
Fig. 2. Comparison of the H-scores of FAT4 immunohistochemical staining. (A) The H-scores for FAT4 in normal gastric mucosa (mean H-score, 148.1±67.4) and gastric cancer (mean H-score, 60.0±63.1). (B) The H-scores of FAT4 according to the pathologic T stage. (C) The H-scores of FAT4 according to the American Joint Committee on Cancer (AJCC) cancer staging system. *P<0.05.
referred to as cirrhosis, and carcinogenesis. It has recently been found that members of the FAT family code for potential trans- membrane receptors in the Hippo signaling pathway,5 which con- trols organ size during animal development.10 There is also growing evidence of a tumor suppressive role for members of the FAT fam- ily, particularly FAT4, which is believed to act via the activation of the Hippo signaling pathway.11,12
Here, we have examined the expression of FAT4 in normal gastric mucosa and gastric adenocarcinoma, and demonstrated a loss of FAT4 expression in a subset of GCs. The loss of FAT4 ex- pression was significantly associated with poor prognostic factors, and more frequently observed in AGC than in EGC patients. It was also associated with a large tumor size, perineural invasion, more
advanced pathologic T stages, more advanced pathologic N stages, more advanced AJCC stages, and shorter DFS rates. These results are in line with those of previous studies indicating that FAT4 acts as a tumor suppressor in other types of cancer.6,13,14
Of the 44 EGC patients, 4 showed loss of FAT4 expression, and no statistically significant correlations with clinicopathological parameters were found. Interestingly, however, a signet ring cell carcinoma limited to the mucosa (pathologic T [pT] 1a), with me- tastasis to five regional lymph nodes at the time of surgery (patho- logic N [pN] 2), showed a loss of FAT4 expression. The limited number of EGC cases included in this study might not be sufficient to clarify the clinical significance of the loss of FAT4 expression in EGC.
Table 1. Expression of FAT4 in relation to clinicopathological parameters in GCs Clinicopathological parameter FAT4 expression in GCs P-
value Clinicopathological parameter FAT4 expression in GCs P- value
Loss No loss Loss No loss
Sex (n=136) Lymphatic invasion (n=136) 0.232
Female (n=35) 12 (34.3) 23 (65.7) 0.109 Not identified (n=70) 14 (20.0) 56 (80.0)
Male (n=101) 21 (20.8) 80 (79.2) Present (n=66) 19 (28.8) 47 (71.2)
Mean age (yr) 63.7±10.5 59.8±13.0 0.150 Venous invasion (n=136) 0.942
Tumor size (cm) 4.7±2.1 3.9±2.4 0.017* Not identified (n=120) 29 (24.2) 91 (75.8)
Gross type (advanced GC) (n=92) 0.703 Present (n=16) 4 (25.0) 12 (75.0)
Borrman type 1 (n=6) 2 (33.3) 4 (66.7) Perineural invasion 0.015*
Borrman type 2 (n=25) 9 (36.0) 16 (64.0) Not identified (n=107) 21 (19.6) 86 (80.4)
Borrman type 3 (n=57) 16 (28.1) 41 (71.9) Present (n=29) 12 (41.4) 17 (58.6)
Borrman type 4 (n=4) 2 (50.0) 2 (50.0) Pathologic T stage (n=136) 0.015*
Gross type (early GC) (n=44) 0.563 pT1 (n=44) 4 (9.1) 40 (90.9)
0-I (n=4) 0 (0.0) 4 (100.0) pT2 (n=21) 4 (19.0) 17 (81.0)
0-IIa (n=5) 1 (20.0) 4 (80.0) pT3 (n=50) 18 (36.0) 32 (64.0)
0-IIb (n=9) 2 (22.2) 7 (77.8) pT4a (n=21) 7 (33.3) 14 (66.7)
0-IIc (n=14) 1 (7.1) 13 (92.9) Pathologic N stage (n=136) 0.059
0-III (n=8) 0 (0.0) 8 (100.0) pN0, N1 (n=77) 14 (18.2) 63 (81.8)
0-IIb+IIc (n=4) 0 (0.0) 4 (100.0) pN2, N3 (n=59) 19 (32.2) 40 (67.8)
Histologic grade (n=128) 0.456 AJCC stage (n=136) 0.011*
Well (n=11) 2 (18.2) 9 (81.8) I (n=55) 6 (10.9) 49 (89.1)
Moderate (n=34) 6 (17.6) 28 (82.4) II (n=25) 9 (36.0) 16 (64.0)
Poor (n=83) 23 (27.7) 60 (72.3) III/IV (n=56) 18 (32.1) 38 (67.9)
Lauren classification (n=128) 0.531
Intestinal (n=78) 18 (23.1) 60 (76.9)
Diffuse (n=48) 12 (25.0) 36 (75.0)
Mixed (n=2) 1 (50.0) 1 (50.0)
Values are presented as number (%) or mean±standard deviation. GC = gastric cancer; AJCC = American Joint Committee on Cancer. *P<0.05.
In addition, we demonstrated that the loss of FAT4 expression was associated with more advanced pathologic T stages in a step- wise fashion. Four of the 44 cases with pT1 (9.1%), 4/21 with pT2 (19%), 18/50 with pT3 (36%), and 7/21 with pT4 (33.3%) showed a loss of FAT4 expression (P=0.033), suggesting that the loss of FAT4 expression may be associated with invasiveness in GC.
These results are in agreement with those of previous studies implicating FAT4 as a candidate tumor suppressor gene in human carcinomas, including GC. A recent study found that missense mu- tations of FAT4 were detected in peritoneal metastasis in pancreatic cancer.15 Zang et al.2 showed that silencing of wild-type FAT4 resulted in a significant increase in cell proliferation, and enhanced cellular invasion and migration, by reducing fibronectin adhesion in a gastric adenocarcinoma cell line. The authors also observed genomic deletions of FAT4 in 4% of GC cases (3/83 tumors), and mutations in FAT4 in approximately 5% of GC cases (6/110 tu- mors). Half of the FAT4 mutations were predicted to adversely af- fect the protein function of FAT4. This suggests that FAT4 may act as a tumor suppressor gene in GC, and that somatic inactivation of FAT4 may be a key tumorigenic event in a subset of GCs.2
However, our study showed the loss of FAT4 expression in a higher proportion of GCs (24.3%) as compared with the 5% gene mutations and 4% deletions of FAT4 in GCs reported in the previ- ous study.2 These differences might be explained by epigenetic reg- ulation or post-transcriptional modification. The mouse Fat4 gene is inactivated by a loss of heterozygosity and promoter CpG hyper- methylation in subcutaneous tumors induced by random chromo- somal deletion.13 Additionally, human FAT4 mRNA expression has
been found to be repressed in breast cancer, in part by promoter CpG hypermethylation.13 The FAT4 promoter has also been found to be hypermethylated in a subset of stage I lung adenocarcinoma, and FAT4 mRNA is downregulated in stage I/II non-small cell lung cancer.14
In summary, we have demonstrated a loss of FAT4 expression in a subset of gastric adenocarcinomas, and found this loss of ex- pression to be associated with a more advanced T stage and shorter DFS. This suggests FAT4 as an important tumor suppressive gene in GC. Further studies examining the mechanisms leading to the loss of FAT4 expression are warranted to investigate the possible connections of FAT4 with the epithelial-mesenchymal transition in GC.
Acknowledgments
The authors appreciate the careful guidance of Professor My- oung-Won Son from the Department of Surgery, Soonchunhyang University Hospital on the collection of clinical data.
References
1. Brenner H, Rothenbacher D, Arndt V. Epidemiology of stom- ach cancer. Methods Mol Biol 2009;472:467-477.
2. Zang ZJ, Cutcutache I, Poon SL, Zhang SL, McPherson JR, Tao J, et al. Exome sequencing of gastric adenocarcinoma identifies recurrent somatic mutations in cell adhesion and chromatin remodeling genes. Nat Genet 2012;44:570-574.
A
0 20 40 60 80
1.0
0.8
0.6
0.4
0.2
0.0
100 Disease-free survival (month)
No loss of FAT4 group, n=99 (5-year survival rate; 86.9%)
Loss of FAT4 group, n=32 (5-year survival rate; 68.7%)
*P=0.017
0 20 40 60 80
1.0
0.8
0.6
0.4
0.2
0.0
100 Overall survival (month)
No loss of FAT4 group, n=10 (5-year survival rate; 70.9%)
Loss of FAT4 group, n=33 (5-year survival rate; 57.6%)
P=0.083
B
Survivalrate Survivalrate
Fig. 3. Disease-free survival (DFS) and overall survival (OS) in relation to FAT4 expression in gastric cancer. (A) The loss of FAT4 expression was significantly associated with poor DFS (5-year survival rate; loss vs. no loss, 68.7% vs. 86.9%, P=0.017). (B) The FAT4-negative group was associated with poor OS, but statistical significance was borderline (5-year survival rate; loss vs. no loss, 57.6% vs. 70.9%, P=0.083). *P<0.05.
3. Bryant PJ, Huettner B, Held LI Jr, Ryerse J, Szidonya J. Mu- tations at the fat locus interfere with cell proliferation con- trol and epithelial morphogenesis in Drosophila. Dev Biol 1988;129:541-554.
4. Axelrod JD. Progress and challenges in understanding planar cell polarity signaling. Semin Cell Dev Biol 2009;20:964-971.
5. Willecke M, Hamaratoglu F, Kango-Singh M, Udan R, Chen CL, Tao C, et al. The fat cadherin acts through the hippo tumor-suppressor pathway to regulate tissue size. Curr Biol 2006;16:2090-2100.
6. Katoh M. Function and cancer genomics of FAT family genes (review). Int J Oncol 2012;41:1913-1918.
7. Conlon I, Raff M. Size control in animal development. Cell 1999;96:235-244.
8. Johnston LA, Gallant P. Control of growth and organ size in Drosophila. Bioessays 2002;24:54-64.
9. Valletta D, Czech B, Thasler WE, Müller M, Bosserhoff AK,
Hellerbrand C. Expression and function of the atypical cad- herin FAT1 in chronic liver disease. Biochem Biophys Res Commun 2012;426:404-408.
10. Edgar BA. From cell structure to transcription: Hippo forges a new path. Cell 2006;124:267-273.
11. Sadeqzadeh E, de Bock CE, Thorne RF. Sleeping giants: emerg- ing roles for the fat cadherins in health and disease. Med Res Rev 2014;34:190-221.
12. Qi C, Zhu YT, Hu L, Zhu YJ. Identification of Fat4 as a can- didate tumor suppressor gene in breast cancers. Int J Cancer 2009;124:793-798.
13. Rauch TA, Wang Z, Wu X, Kernstine KH, Riggs AD, Pfeifer GP. DNA methylation biomarkers for lung cancer. Tumour Biol 2012;33:287-296.
14. Yachida S, Jones S, Bozic I, Antal T, Leary R, Fu B, et al. Distant metastasis occurs late during the genetic evolution of pancre- atic cancer. Nature 2010;467:1114-1117.