Printed in the Republic of Korea DOI 10.5012/jkcs.2011.55.2.177
이케토 구리(II) 착물의 합성 및 송아지 Thymus DNA(CTDNA)와의 상호작용
Aijaz Ahmad Tak and Farukh Arjmand†
Department of Chemistry, Islamia College of Science and Commerce Hawal Srinagar, India
†A.M.U. Aligarh U.P. India
(접수 2009. 10. 23; 수정 2010. 3. 17; 게재확정 2010. 11. 15)
Synthesis of Diketo Copper(II) Complex and Its Binding toward Calf Thymus DNA (CTDNA)
Aijaz Ahmad Tak and Farukh Arjmand†
Department of Chemistry, Islamia College of Science and Commerce Hawal Srinagar, India.
*E-mail: [email protected]
†A.M.U. Aligarh U.P. India
(Received October 23, 2009; Revised March 17, 2010; Accepted November 15, 2010)
요 약. 이케토형 리간드는 thiophene-2-aldehyde와 acetylacetone의 Knoevenagel 축합반응을 통해 합성하였으며, 이를 이용 하여 Cu(II), Ni(II) 및Co(II) 염화물의 착물을 합성하였다. 모든 착물의 특성은 다양한 물리-화학적 방법으로 규명하였다. 몰 전기전도도 결과로부터 이들 착물이 이온성을 가짐을 알았다. 전자 및 EPR 스펙트럼을 통해 구리(II) 이온이 사각평면 기 하구조를 가짐을 알았다. 구리(II) 착물과 CTDNA(송아지 thymus DNA)의 상호작용을 흡수 스펙트럼과 순환 전압전류법
으로 연구하였다. kobs 대 [DNA]의 도시는 선형을 보였는데, 이는 유사-1차반응을 의미한다. 순환 전압전류 그림으로부터
구리(II) 착물이 각각 -0.240 V와 -0.194 V의 E1/2 값을 갖는 일전자 Cu(II)/Cu(I) 산화-환원 쌍에 대해 준가역적임을 알았다.
CTDNA를 첨가한 경우, E1/2값이 각각168 mV와 18 mV 이동하였고 Ep 값도 감소하였다. CTDNA의 존재 하에 E1/2이 이 처럼 이동하는 것은 구리(II) 착물이 CTDNA에 강하게 결합됨을 의미한다.
주제어: CTDNA, 산화환원 전위, 구리착물(II), 저흡광성, 속도상수
ABSTRACT. A diketo-type ligand was synthesized by the Knoevenagel condensation reaction of thiophene-2-aldehyde with acetylacetone, subsequently its transition metal complexes with Cu(II), Ni(II), and Co(II) chlorides were also prepared. All the complexes were characterized by various physico-chemical methods. The molar conductivity data reveals ionic nature for the complexes. The electronic spectrum and the EPR values suggest square planar geometry for the Cu(II) ion. Interaction of the Cu(II) complex with CTDNA (calf thymus DNA) was studied by absorption spectral method and cyclic voltammetry.
The kobs values versus [DNA] gave a linear plot suggesting psuedo-first order reaction kinetics. The cyclic voltammogram of the Cu(II) complex reveals a quasi-reversible wave attributed to Cu(II)/Cu(I) redox couple for one electron transfer with E1/2 values -0.240 V and -0.194 V. respectively. On addition of CTDNA, there is a shift in the E1/2 values 168 mV and 18 mV respec- tively and decrease in Ep values. The shift in E1/2 values in the presence of CTDNA suggests strong binding of Cu(II) complex to the CTDNA.
Keywords: CTDNA, Redox potential, Copper(II) complex, Hypochromicity, Rate constant
INTRODUCTION
The coordination of metal ions to heterocyclic com- pounds has been the subject matter of intense investigation, as they can be promoted as clinically useful antibacterial and anticancer drugs.1-3 The biological properties of these heterocycles can be further enhanced by condensing with suitable nucleophiles such as diketones etc. The knoev- enagel condensation4-7 is well known process to synthe- size the compounds using the electrophiles viz aldehydes
with diketones as a nucleophile in presence of organic base. The product is dependent on the reaction conditions and normal knoevenagel reaction affords two fold con- densation at the activated methyl and methylene moiety,8 which makes the ligand more versatile for coordination.
The current strategy for the drug design is not only based on structure but also the mode of action of the drug to its specific target. Thus the drug efficiency increases and dosage is also reduced. Metal based drugs form a suitable platform in this context,9-12 as transition metal ions are
able to coordinate to the DNA by expanding their coor- dination number. Many authentic reports are avaliable in the literature which reveal the anticancer activity of the transition metal complexes containing oxygen, nitrogen and sulphur donors.13,14 Using thiophene-2-aldehyde in the presence of sodium ethoxide with acetylacetone as nucleophile yielded the knoevenagel product, subsequently its transition metal complexes [Cu(II), Co(II) and Ni(II) chlorides] were synthesized and characterized by various physico-chemical methods. Earlier reports on transition metal complexes and their interaction with CTDNA have shown that the complexes bind strongly to CTDNA by intercalation.15-18 In this paper, the interaction of the cop- per(II) complex with CTDNA has been studied spectro- photometrically as well as by cyclic voltammetry.
EXPERIMENTAL
All the experiments involving interaction of the cop- per(II) complex with the CTDNA were carried out in aqueous solution with varying concentration of CTDNA (10×10-5, 12×10-5, 14×10-5, 16×10-5, and 18×10-5 mol·dm-3). The CTDNA concentration was determined by absorption spectrophotometry. Doubly distilled water was used through out. The stock solution of CTDNA was prepared by dis- solving it in 10 ml tris HCl buffer at pH 7 and dialyzing against the same buffer for 48 h. The solution gave a ratio of >>1.8 at A260/280, indicating that CTDNA was free from protein.19 The concentration of CTDNA was determined by monitoring the u.v. absorbance at 260 nm using Σ260 = 6600 cm-1. The stock solution was stored at -20oC. NiCl2, CuCl2, (hydrated) (BDH), thiophene-2-aldehyde (Koch- light) and acetylacetone (Sisco) were used as received.
CTDNA was obtained from Sigma. IR spectra (200-4000 cm-1) were recorded on Carl Zeiss Specord M-80 spec- trophotometer in nujol mulls. The electronic spectra were recorded on a Systronic119 spectrophotometer (ESP-300) and NMR spectra on an amx-500 instrument. Cyclic vol- tammetry measurements were recorded on a CH instru- ment electrochemical analyzer. High purity H2O/MeOH (95:5) was employed for the cyclic voltammetric studies
with 0.4 M KNO3 as supporting electrolyte. A three electrode configuration was used, comprised a Pt disc as working electrode, Pt wire as auxillary electrode and Ag/AgCl as reference electrode. Experiments were carried out at room temperature.
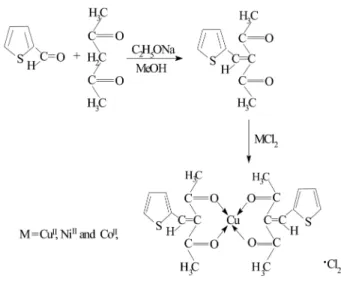
Synthesis of ligand : C10H10O2S
To a solution of thiophene-2-aldehyde (0.460 g, 5 mmol) in dry MeOH was added acetylacetone (0.515 g, 5 mmol) in the same solvent. The mixture was boiled to reflux for ca. 12 h and C2H5ONa was added to catalyze the reaction.
A light yellow precipitate was obtained, filtered, washed with hexane thoroughly and dried in vacuo (yield=75%).
Synthesis of the complex : C20H20O4S2CuCl2 To the solution of C10H10O2S (0.388 g, 2 mmol) in EtOH (50 cm3) was added CuCl2 (0.171 g, 1 mmol) in the same solvent. A green precipitate was obtained, filtered, washed with ether and dried in vacuo (yield=67%).
Similar method was adopted for NiII and CoII complexes.
RESULTS AND DISCUSSION Spectroscopic Characterization of the Complex IR spectra: The most significant frequencies in the spec- Scheme 1.
Table 1. Physical and Analytical Data
Compound Colour M.P. oC Yield % Analytical(Found/Calcd)
C H S
C10H10O2S Light Yellow 110 70 62.02 (61.84) 5.27 (5.19) 16.66 (16.48)
C20H20O4S2CuCl2 Green 180 67 46.08 (45.93) 3.92 (3.86) 12.33 (12.24) C20H20O4S2NiCl2 Brown 240(d) 58 46.48 (46.36) 3.92 (3.89) 12.44 (12.35) C20H20O4S2CoCl2 Dark red 245(d) 60 46.44 (46.33) 3.90 (3.89) 12.45 (12.40) d=decomposes
tra of ligand and the complexes are shown in Table 2. The IR spectrum of the ligand shows bands characteristic of the ν(C=C) and ν(C-H) vibrations at 1630 cm-1 and 2860 cm-1 respectively. The ν(C-S-C) stretching frequency was observed at 705 cm-1. The free ligand showed an intense band at ca. 1594 cm-1, characteristic of ν(C=O).20 This band is shifted to higher wavenumber in the spectra of the complexes, supporting the involvement of C=O in the for- mation of complexes.21 This was further confirmed by the appearance of ν(M-O) band at 334-350 cm-1.22 The ν(C-S-C) absorption band appear at 703-707 cm-1 in all the com- plexes.
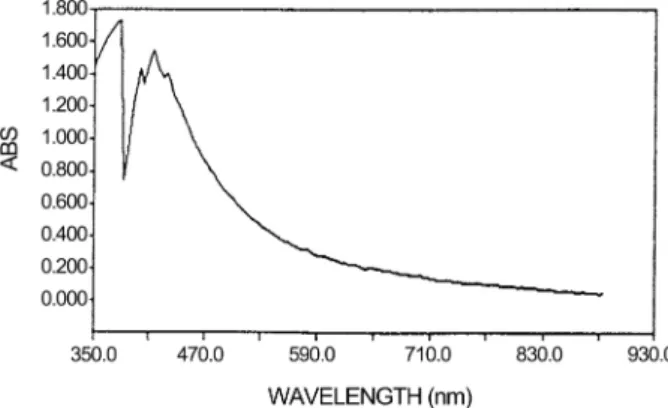
EPR spectra: The EPR spectrum of copper(II) complex shows signal a for gII and g⊥ at 2.24 and 2.09 respectively as anticipated for the square planar copper (II) complex.23 Electronic Spectra: The electronic spectrum of the ligand in EtOH exhibits bands at 241 and 350 nm, which may be assigned to the π-π* and n-π* transitions respec- tively (Fig. 1).
The electronic spectrum of copper(II) complex reveals bands at 281, 373 nm and a broad band at 876 nm. The first two bands are assigned to the MLCT transitions and the third band at 876 nm correspons to the 2E2g←2T2g tran- sition for the square planar geometry.24 The electronic spectrum of nickel(II) complex in DMSO shows no absorp- tion band at the longer wavelength regions suggesting a singlet 1Ag ground state consistent with four coordinate square planar geometry. These bands are at 376 and 443 nm assigned to 1A1g→1A2g, 1A1g→1B1g transitions respec-
tively (Fig. 2).25
NMR spectra: The 1H and 13C NMR spectra for the ligand and the Ni(II) complex were run in DMSO. The results are given in the Tables 3 and 4. The 1H NMR spec- tral data for the ligand and the complex are generally con- sistent with their formulation. The ligand exhibits signal at 6.8-7.7 ppm. attributable to the thiophene protons.26 The signal associated with the methyl protons appear as a mul- tiplet in the region 0.9-3.0 p.p.m. region. The CH proton singlet was observed at 5.82 ppm.27 After complexation no major shift was observed. The thiophene protons appear at 7.0-7.6 ppm. The singlet at 4.8 ppm is assigned to the CH protons. The spectra also exhibit the peaks characteristic of methyl group in the 0.8-2.9 ppm range.
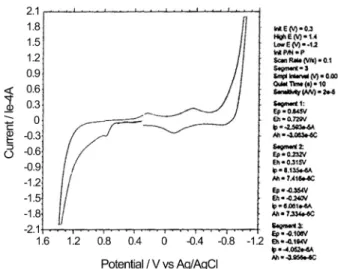
Interaction of the Cu(II) complex with CTDNA Cyclic voltammetry: The cyclic voltammetry studies provide an insight to the CTDNA binding. The cyclic vol- tammogram recorded for the complex C20H20O4S2CuCl2
in H2O/MeOH (95:5) at a scan rate of 0.1 Vs-1 reveals one electron transfer reaction and a quasi-reversible wave with E1/2 values as -0.240 and -0.194 V, respectively (Fig. 3).
The ratio of anodic to cathodic peak currents Ipa/Ipc is ~ 1.
At different scan rates, the voltammogram does not show any major change (Fig. 4). For a reversible wave, Ep is Table 2. IR data (cm-1)
Compound ν(C-S) ν(C=C) ν(C=O) ν(C-H) ν(M-O) C10H10O2S 705 1630 1594 2860 --- C20H20O4S2CuCl2 707 1629 1607 2857 345 C20H20O4S2NiCl2 706 1626 1605 2859 334 C20H20O4S2CoCl2 703 1627 1609 2856 350
Fig. 1. Absorption spectrum of the ligand C10H10O2S.
Fig. 2. Absorption spectrum of monometallic Ni(II) complex C20H20O4S2NiCl2.
Table 3. 1H NMR data (δ, ppm)
Compund thiophene CH CH3
C10H10O2S 6.8-7.7(m) 5.82(m) 0.9-3.0(m) C20H20O4S2NiCl2 7.0-7.6 (m) 4.80(m) 0.96-3.0 (m)
Table 4. 13C NMR data (δ, ppm)
Compound thiophene CH -C=O -C-S-C- CH3 C10H10O2S 130-122 65 160 49-44 27-24 C20H20O4S2NiCl2 127-121 63 165 47-43 26-22
independent of the scan rate and Ip (as well as the current at any point of the wave) is proportional to the ν1/2.28 The
∆Ep value (248 mV) is larger than the Nernstian value observed for one electron transfer couple. Large peak width for one electron couple CuII→CuI in these complexes is not an uncommon observation.29 This is due to the reor- ganization of the coordination sphere during the electron transfer and has been observed in number of copper com- plexes as well.30 On addition of CTDNA, there was pos- itive shift in E1/2 values of 168 mV and 18 mV as well as in Epvalues (103 mV and 13 mV) (Fig. 5). The ratio of Ipa/Ipc
for the bound complex decreases (0.62) suggesting, that CTDNA is bound strongly to the complex. In addition to the changes in the formal potential, the voltammetric peak current decreases upon the addition of CTDNA to the cop- per(II) complex. The decrease in the current is due to the diffusion of the equilibrium mixture to free and DNA
bound metal complex to the electrode surface.31 A square scheme redox cycle showing the binding of CTDNA to the copper(II) complex is depicted as,
Kinetic studies: The absorption spectrum of C20H20
O4S2CuCl2 was recorded spectrophotometrically in MeOH/
H2O (5:95) at λmax of 281 nm at 30oC, which is charac- teristics soret band attributed to the MLCT transition. On addition of CTDNA, the absorption band at 281 nm shifts to 267 nm revealing a shift of 14 nm (Fig. 6) and hypo- chromicity (Fig. 7). Pronounced hypochromicity is observed after regular time intervals as authenticated by large num- ber of reports.10,32 This suggests preferential intercalation in the DNA helix.33 Interaction of copper(II) complex at fixed concentration (1×10⁻⁵ mol·dm3) with varying con- centration of CTDNA (10-18×10-5 mol dm3) were mon- itored spectrophotometrically to study the binding of DNA to the complex. The rate constant kobs values were cal- culated by ploting –log A versus time (Fig. 8). The plot of Fig. 3. Cyclic voltammogram of Cu(II) complex C20H20O4S2CuCl2.
Fig. 4. Cyclic voltammogram of Cu(II) complex C20H20O4S2CuCl2 at different scan rates.
Fig. 5. Cyclic voltammogram of Cu(II) C20H20O4S2CuCl2 after addition of CTDNA.
Fig. 6. Shift in absorption spectrum of Cu(II) complex C20H20O4S2CuCl2 after interaction with CTDNA.
kobs versus [DNA] gave a straight line suggesting a pseudo- first order reaction kinetics (Fig. 9). On the basis of kinetic data, the following mechanism is proposed with calf thy- mus DNA indicating intercalative binding mode.
The rate law derived for the above proposed mecha- nism is
kobs = k1 k2[DNA] / (k1 + k2) (1) Our results are consistent with the derived rate law and support the proposed mechanism of binding to CTDNA.
In conclusion, the heterocyclic surface of the copper(II) complex intercalates into DNA which hinders the MLCT transition resulting in observed hypochromism.
Acknowledgements. We are grateful to CDRI Lucknow for IR, CHN and TIFR Mumbai for NMR facilities. Thanks are also to Dr. Sartaj Tabassum for providing CV facilities.
REFERENCES
1. Raper, E. S.; Coord. Chem. Rev. 1985, 61, 115.
2. Siegel, H.; Siegel, A. Metal Ions in Biological System., Nickel and its role in biology; Marcel Dekker: New York, U.S.A., 1998, p 23.
3. Halcrow, M. A.; Christou, G. Chem. Rev. 1994, 94, 2421.
4. Keijzer, A. E. H.; Koole, L. H.; Buck, H. M. J. Am. Chem.
Soc. 1988, 110, 5995.
5. Melot, J. M.; Texier-Boullet, F.; Foucaud, A. Tetrahedron 1988, 44, 2215.
6. Katritzky, A. R.; Ostercamp, D. L.; Yousaf, T. I. Tetra- hedron 1988, 42, 5729.
7. Yamamori, T.; Hiramatsu, Y. K.; Sakai, K.; Adachu, I.
Heterocycles 1984, 21, 618.
8. Samula K.; Kardasz, K. Pol. J. Chem. 1985, 59, 73.
9. Moghaddas, S.; Hendry, P.; Geue, R. J.; Qin, C.; Bygott, A. M. T.; Sargeson A. M.; Dixon, N. E. J. Am. Chem. Soc., Dalton Trans. 2000, 2085.
10. Mahadevan, S.; Palaniandavar, M. Inorg. Chem. 1998, 37, 693.
11. Barton, S. J.; Barnham, K. J.; Frey, U.; Habetemariam, A.;
Sue, R. E.; Saddler, P. J. Aust. J. Chem. 1999, 52, 173.
12. Stinner, C.; Wightman, M. D.; Kelly, S. O.; Hill M. G.;
Barton. J. K. Inorg. Chem. 2001, 40, 5245.
13. Chinnusamy, V.; Natarajan, K. Synth. React. Inorg. Met.
Org. Chem. 1993, 23, 899.
Fig. 7. Absorption spectrum showing hypochromicity.
Fig. 8. Plot of log A versus time for Cu(II) complex (C20H20O4S2CuCl2) at varying [CTDNA] (10-18×10-5 mol·dm-3).
Fig. 9. Plot of Kobs versus [CTDNA] (10-18×10-5 mol·dm-3) for C20H20O4S2CuCl2. Fixed concentration of complex = 1×10⁻⁵ mol·dm-3.
Scheme 2.
14. Saxena, R. C.; Jain, C. L.; Benjamin R.; Sangal, S. K. J.
Ind. Chem. Soc. 1986, 63, 435.
15. Franklin, S. J.; Barton, J. K. Biochemistry 1998, 37, 16093.
16. Hudson, B. P.; Barton, J. K. J. Am. Chem. Soc. 1993, 115, 2984.
17. Terbueggen, R. H.; Barton, J. K. Biochemistry 1995, 34, 8227.
18. David, S. S.; Barton, J. K. J. Am. Chem. Soc. 1993, 115, 2984.
19. Murmur, J. J. Mol. Biol. 1961, 3, 208.
20. Thangadurai, T. D.; Natrajan, K. Transition Met. Chem.
2001, 26, 500.
21. Uzoukw, B. A.; Adiukwu, P. U. Synth. React. Inorg. Met.
Org. Chem. 1997, 27(4), 509.
22. Garg, B. S.; Singh, P. K.; Sharma, J. L. Synth. React. Inorg.
Met. Org. Chem. 2000, 30, 803.
23. Sakata, K.; Hoshimoto, M.; Kashiwamura T.; Tsuge, T.
Synth. React. Inorg. Met. Org. Chem. 1997, 27, 797.
24. Yazicilar, T. K.; Yilman, V. T.; Olmez, H. Synth. React.
Inorg. Met. Org. Chem. 1997, 27, 825.
25. (a) Hassan, A. M. Synth. React. Inorg. Met. Org. Chem., 1997, 27, 835. (b) Lever, A. B. P. Inorganic Electronic spectroscopy; Elseiver: Amsterdam, 1968, p 343.
26. Singh, B.; Singh, T. B. Ind. J. Chem., 1999, 38(12), 1286.
27. Gupta, A. K.; Poddar, R. K. Ind. J. Chem., 2000, 39A, 457.
28. Bard, A. J.; Faulkner, L. R. Electrochemical Methods, Wiley: New York, 1980, p 219.
29. (a) Palaniandavar, M.; Pandiyan, T.; Laxminarayan M.
Monohar, H. J. Chem. Soc., Dalton Trans. 1995, 455. (b) Rajesh, Mathur. Polyhedron 1996, 17, 2607.
30. Usha, S.; Palaniandavar, M. J. Chem. Soc., Dalton trans.
1994, 2277.
31. Weltch, T. W.; Thorp, H. H. J. Phy. Chem. 1996, 100, 13829.
32. Pasternack, R. F.; Gibbs, E. J.; Vilfranca, J. J. Biochemistry 1983, 22, 2406.
33. Long, E.; Barton, J. K. J. Acc. Chem. Res. 1990, 28, 271.
![Fig. 9. Plot of K obs versus [CTDNA] (10-18×10 -5 mol·dm -3 ) for C 20 H 20 O 4 S 2 CuCl 2](https://thumb-ap.123doks.com/thumbv2/123dokinfo/5299443.154597/5.892.104.413.719.924/fig-plot-k-obs-versus-ctdna-mol-cucl.webp)
