Printed in the Republic of Korea
http://dx.doi.org/10.5012/jkcs.2012.56.2.217
Syntheses, Spectral, Surface Morphological and Gamma Ray Irradiation Studies of Some Oxomolybdenum(V) and Dioxomolybdenum(VI) Complexes of an
Azo Dye Derived from 4-aminoantipyrine
M. L. Harikumaran Nair* and Anju. S. Appukuttan
Department of Chemistry, University College, Thiruvananthapuram-695034, Kerala, India.
*E-mail: [email protected]
(Received January 26, 2012; Accepted February 20, 2012)
ABSTRACT. Syntheses of some novel oxomolybdenum(V) and dioxomolybdenum(VI) complexes with an azo dye meth- oxyphenolazoantipyrine (HL) derived from 4-aminoantipyrine and 2-methoxyphenol are reported. The complexes have been characterized by elemental analyses, molar conductance, magnetic susceptibility data, IR, UV-Vis, 1H NMR, EPR and FAB mass spectral studies. The physicochemical studies and spectral data indicate that HL acts as a bidentate chelating ligand. The complexes have the general formulae [MoO(HL)XCl2] and [MoO2(HL)XCl],where X=Cl, NCS or NO3. All the complexes are found to have distorted octahedral geometry. Structural and morphological characterization of the complexes [MoO(HL)Cl3](1) and [MoO2(HL)Cl2](4) before and after gamma ray irradiation,was performed by X-ray diffraction and scanning electron micros- copy(SEM).The ligand and the complexes were screened for their possible antimicrobial activities.
Key words: Oxomolybdenum(V), Dioxomolybdenum(VI), 4-Aminoantipyrine, Spectral studies, γ-Irradiation
INTRODUCTION
Molybdenum is a biologically important trace element that occurs in the redox active sites of molybdoenzymes involved in nitrogen, sulfur or carbon metabolism.1 Recent years have witnessed a phenomenal growth in the coor- dination chemistry of high valent oxomolybdenum com- plexes owing to their potential applications.2-6 The ‘oxo- type’ molybdoenzymes, which possess a common molyb- denum cofactor and catalyze biological two electron reac- tions that involve a change in the number of oxygen atoms in the substrate.7 Molybdenum is a versatile transition ele- ment because it possesses a large number of stable and accessible oxidation states as well as coordination num- bers. The formal oxidation state of molybdenum fluctuates between +6 and +4 via a +5 intermediate during turnover.8 A variety of chemical reactions are catalyzed by the molyb- denum coordination complexes.9
Herein, we report the synthesis, spectral characteriza- tion, thermal and antibacterial studies of complexes of oxomolybdenum(V) and dioxomolybdenum(VI) species with a potentially bidentate ligand derived from 4-ami- noantipyrine and 2-methoxyphenol. The irradiation may induce changes in textural, structural, electric, thermal and magnetic properties of a large variety of solids.10,11 Literature survey revealed that spectral and X-ray diffrac- tion studies of irradiated salts as well as metal complexes
are limited.12 Knowledge regarding the radiation effect benefit the development of advanced material in various fields. Moreover, since studies concerning the effect of γ-radiation on transition metal complexes are rare, the effect of γ-radiation on X-ray diffraction and surface mor- phology of two of the complexes have also been incor- porated in the present investigation.
EXPERIMENTAL
Materials and Physical Measurements
Molybdenum pentachloride (Alfa Aesar, Lancaster, UK) and molybdenum trioxide (Loba Chemie, Mumbai, India) were used. All other chemicals were of AR grade.
Metal and chloride were estimated by standard meth- ods.13 The elemental analyses (C, H, N and S) were car- ried out at the Sophisticated Test and Instrumentation Center (STIC), Kochi. Room temperature molar conduc- tance of the complexes in methanol was recorded on Elico direct reading conductivity meter at a concentration of
~10-3 M. The magnetic susceptibilities were recorded at room temperature by Gouy method. Diamagnetic correc- tions for various atoms and structural units were com- puted using Pascal’s constants.14 The IR spectra (KBr, cm-1) of ligand and complexes were recorded in the region 4000-400 cm-1 on Perkin-Elmer 397 Spectrophotometer.
Electronic absorption spectral measurements of the com-
plexes in methanol were conducted using Jasco-V-550- UV-Vis spectrophotometer. 1H NMR spectra of the ligand, HL and the complex 4 were recorded on a 300 MHz FT NMR instrument using TMS as reference. The FAB mass spectrum of ligand HL, [MoO(HL)Cl3](1) and [MoO2(HL) Cl2](4) were recorded in a JEOL JMS600H mass spec- trometer at NIIST, Thiruvananthapuram, India. EPR spec- tra of the complex 1 in solid state at LNT was recorded on a Varian E-112 Spectrometer at X-band, using TCNE as marker with 100 kHz modulation frequency and 9.1 GHz microwave frequency at the SAIF, IIT, Mumbai, India.
Thermal studies were carried out by heating in air at a rate of 10oC/min on a Perkin Elmer, Diamond TG/DTA Anal- yser. X-ray powder diffraction patterns of unirradiated and irradiated samples were recorded using Philips X-ray PW1710 diffractometer using nickel filter (Cu-Kα radia- tion λ=1.5406). Surface morphological study of unirra- diated and irradiated samples were recorded using JEOL Model JSM-6390LV. The samples were subjected to gamma irradiation to a dose of 800 kGy using 60Co γ-ray in Gamma chamber 5000cc self shielded at constant intensity under room temperature at a dose rate of 1.85 kGy h-1.
Synthesis of Ligand (HL)
Synthesis of ligand, HL (C18H18N4O3) in Fig. 1 was car- ried out by 4-aminoantipyrine and 2-methoxyphenol by diazotization and coupling as reported earlier.15 Purity of the ligand was tested by TLC. It was characterized by IR, UV and 1H NMR spectroscopy. m.p. 231oC.
Synthesis of Oxomolybdenum(V) Complexes
The chloride complex was prepared by adding a meth- anolic solution of MoCl5 (2 mmol, 20 mL) in small quan- tities with stirring to a hot methanolic solution of the ligand (2 mmol, 20 mL). The solution formed was refluxed for 2-3 h. The precipitated complexes were fil- tered, washed with aqueous methanol and dried over P4O10 in vacuo.
The following general method was adopted for the prep- aration of thiocyanate and nitrate complexes.12 A methanolic solution of MoCl5 (2 mmol, 20 mL) containing 2 mmol of
NH4CNS/2 mmol LiNO3, was added to a hot methanolic solution of the ligand (2 mmol, 20 mL).The thiocyanate complex was precipitated on heating the mixture at 40oC for ~30 min, while the nitrate complex was precipitated on refluxing the solution for 2-3 h. The precipitated com- plexes were suction filtered, washed with aqueous meth- anol (1:1) followed by dry ether and then dried over P4O10 in vacuo.
Synthesis of Dioxomolybdenum (VI) Complexes MoO3 (2 mmol) was dissolved in minimum amount of hot conc. HCl (4 mL). Methanolic solution of this was added dropwise with stirring to a methanolic solution of the ligand (2 mmol, 20 mL). The solution formed was refluxed for 2-3 h. The solid separated was suction fil- tered, washed first with aqueous methanol, then with ether and dried over P4O10 in vacuo. The thiocyanate and nitrate complexes were prepared in the same manner as the oxo- molybdenum(V) complexes.
Antimicrobial Study
Antitubercular activity of HL and complexes against M.
tuberculosis H37Rv and antibacterial activity against Escherichia coli and Lactobacillus leichmannii were done by the Resazurin assay method at the Rajeev Gandhi Cen- tre for Biotechnology (Thiruvananthapuram).
RESULTS AND DISCUSSIONS
Analytical Measurements
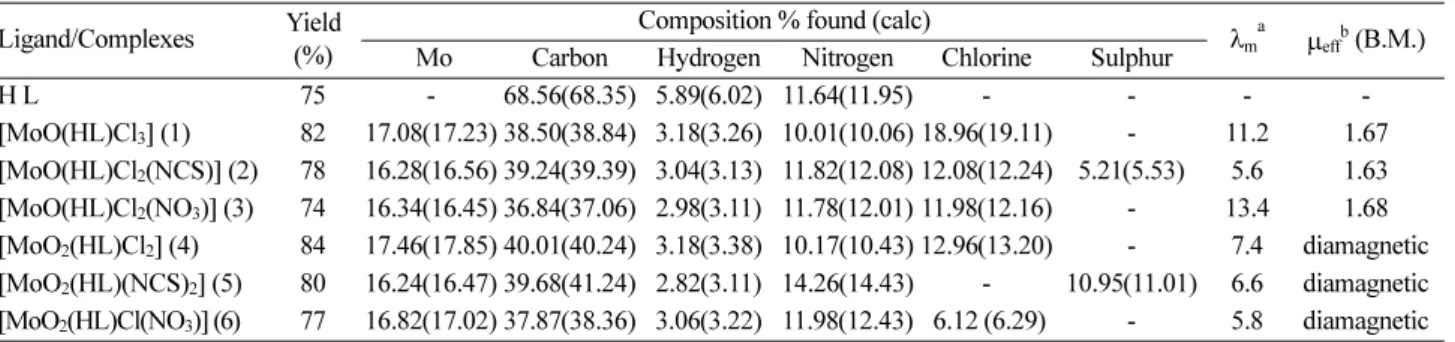
All the complexes are deeply coloured and fairly stable at room temperature. They are non hygroscopic solids and soluble in common organic solvents, like acetone, chlo- roform, methanol, acetonitrile, DMF and DMSO. Formu- lation of these complexes have been done on the basis of their elemental analytical data, molar conductance and magnetic susceptibility measurements. The analytical data show that all the complexes are mononuclear with the general formulae [MoO(HL)Cl2X] and [MoO2(HL)ClX], where X=Cl, NCS, NO3.The molar conductances of the complexes in methanol is in the range of 3.6-14.8 ohm-1cm2, adequately confirming the non electrolytic nature of the complexes.16
Magnetic Susceptibilities
The magnetic susceptibility values of all the oxomo- lybdenum (V) complexes at room temperature are near the spin-only value (1.73 B.M.) as expected of a d1 system. This shows the absence of Mo-Mo interaction in these com- Fig. 1. Tentative structure of Ligand HL.
plexes. The presence of Mo=O bond in oxomolybdenum (V) complexes produce strong tetragonal distortion and this may cause reduction in magnetic moment values. The high spin orbit coupling constant17 of Mo (λ=1000 cm-1) also lowers the µeff value. All the dioxomolybdenum (VI) complexes are found to be diamagnetic as expected for a d0 system. The analytical data are presented in Table 1.
Infraed Spectra
Important infrared spectral bands of the ligand and com- plexes and their tentative assignments are given in Table 2.
In all the complexes ligand coordinates through carbonyl oxygen and one of the nitrogens of the diazo group as evi- denced by the shift of νC=O andνN=N to lowerfrequen- cies.18 The spectrum of the ligand HL exhibits a broad medium band at 2925 cm-1 is assigned to hydrogen bonded OH group. This band disappears in the spectra of all the complexes and a broad medium intensity band observed at ~3450 cm-1, confirming the presence of free OH group and their non participation in coordination with the metal ion.15
Dioxomolybdenum (VI) complexes display two Mo=O stretches at ~936-942 cm-1 and at ~906-910 cm-1 due to symmetric and antisymmetric stretching of cis-MoO22+
core. The MoO22+prefers to form a cis configuration due
to maximum utilization of the dπ groups. A very strong band observed at ~960 cm-1 in the spectra of oxomolyb- denum complexes corresponds to Mo=O stretching fre- quency.3 New weak bands at ~590 cm-1 and at ~440 cm-1 in the metal complexes have been assigned to µMo-O and µMo-N modes respectively.19 The N-coordinated nature of the thiocyanate group is indicated by the bands at ~2060 cm-1 (µC-N), ~840 cm-1 (νC-S) and ~490 cm-1 δ(NCS). The IR spec- tra of the nitrate complexes suggest20 monocoordination of the nitrate group ν4 at ~1490 cm-1, ν1 at ~1380 cm-1 and ν2 at ~1034 cm-1.
Electronic Spectra
The electronic absorption bands of bidentate azo dye ligand (HL) and the oxomolybdenum (V) complexes were recorded in methanol. The electronic spectrum of the ligand shows an intense band at 249 nm and a band of less intensity at 322 nm due to π→π* and n→π* transitions respectively. These bands suffer marginal shifts on com- plexation. The electronic spectra of the complexes showed a red shift to ~256 nm and ~334 nm.21
The electronic spectra of octahedral oxomolybdenum (V) complexes usually exhibit three distinct bands in the region 690-740 nm, 450-520 nm and 380-440 nm, assign- able to 2B2→2E(dxy→dxz, dyz), 2B2→2B1 (dxy→dx2
-y2) Table 1. Analytical data of the ligand and complexes
Ligand/Complexes Yield (%)
Composition % found (calc)
λma
µeffb (B.M.) Mo Carbon Hydrogen Nitrogen Chlorine Sulphur
H L 75 - 68.56(68.35) 5.89(6.02) 11.64(11.95) - - - -
[MoO(HL)Cl3] (1) 82 17.08(17.23) 38.50(38.84) 3.18(3.26) 10.01(10.06) 18.96(19.11) - 11.2 1.67 [MoO(HL)Cl2(NCS)] (2) 78 16.28(16.56) 39.24(39.39) 3.04(3.13) 11.82(12.08) 12.08(12.24) 5.21(5.53) 5.6 1.63 [MoO(HL)Cl2(NO3)] (3) 74 16.34(16.45) 36.84(37.06) 2.98(3.11) 11.78(12.01) 11.98(12.16) - 13.4 1.68 [MoO2(HL)Cl2] (4) 84 17.46(17.85) 40.01(40.24) 3.18(3.38) 10.17(10.43) 12.96(13.20) - 7.4 diamagnetic [MoO2(HL)(NCS)2] (5) 80 16.24(16.47) 39.68(41.24) 2.82(3.11) 14.26(14.43) - 10.95(11.01) 6.6 diamagnetic [MoO2(HL)Cl(NO3)] (6) 77 16.82(17.02) 37.87(38.36) 3.06(3.22) 11.98(12.43) 6.12 (6.29) - 5.8 diamagnetic
aMolar conductivity, 10-3 M Methanol at 298 K.
bMagnetic susceptibility per metal atom.
Table 2. Important IR data of ligand and its metal complexes
Ligand/Complexes IR data (cm-1)
νO-H νC=O νN=N νsMo=O νaMo=O
H L 2925 1634 1465 - -
[MoO(HL)Cl3] (1) 3436 1585 1452 958 -
[MoO(HL)Cl2(NCS)] (2) 3392 1592 1450 960 -
[MoO(HL)Cl2(NO3)] (3) 3462 1587 1454 956 -
[MoO2(HL)Cl2] (4) 3429 1584 1454 942 908
[MoO2(HL)(NCS)2] (5) 3436 1590 1448 936 910
[MoO2(HL)Cl(NO3)] (6) 3444 1582 1450 938 906
and 2B2→2A1 (dxy→dz2) transitions respectively.22 All the complexes show a medium intensity band in the range 480-500 nm and a weak broad band in the range 650-710 nm. However, we could not locate the third band in these complexes, probably due to the mask by high intensity charge transfer transitions. The electronic spectra thus indicate an octahedral environment for all the complexes and are in conformity with Ballhausen-Gray scheme for an octahedral geometry.23 The complexes are best con- sidered as octahedral with strong tetragonal distortion, resulting from MoO bond.24
1H NMR Spectra
The 1H NMR spectra of (HL) (Fig. 2) and the complex 4 were recorded . The 1H NMR spectrum25 of the free ligand HL showed a sharp signal at δ12.505 ppm characteristic
of the phenolic OH proton. The spectrum displays three singlets, which correspond to methyl protons. The >C-CH3 group of pyrazolone ring appears as a sharp singlet in the region δ2.62 ppm while the >N-CH3 signal is observed as another singlet in the region δ3.30 ppm and -OCH3 signal is observed at δ3.82 ppm. The signal due to five aromatic protons of the antipyrine phenyl ring appear as multiplet between δ (7.29-7.44 ppm) and these due to the protons of phenyl rings are observed as multiplet between δ (6.67- 6.78 ppm). On analyzing the spectrum of [MoO2(HL)Cl2], the presence of singlet due to phenolic proton indicates the non participation of the -OH group during coordination, which is further confirmed by the IR spectra.
EPR Spectra
EPR spectra of the complexes provide information about the coordination environment around the metal ion in the complexes. The X-band EPR spectrum of complex 1 recorded in the polycrystalline state at LNT is given in Fig. 3. The ESR spectrum of the complex exhibits an iso- tropic spectrum with giso ~1.93 G.
Seventy-five percent of molybdenum are isotopes
94Mo and 96Mo with the nuclear spin quantum number I=0, and these isotopes give one ESR line. The natural abundance of 95Mo and 97Mo is 15.78% and 9.60%, respectively, both with a nuclear spin I=5/2. Thus, each isotope should give six ESR lines. 95Mo overlaps with the six lines arising from 97Mo, and only six broad lines are observed in addition to the single central line orig- inating from 94Mo and 96Mo. This hyperfine splitting may Fig. 2. 1H NMR spectrum of HL.
Fig. 3. EPR spectrum of complex [MoO(HL)Cl3].
not be seen if there is signal broadening due to spin lat- tice relaxation and spin -spin interaction.14 In the present case the isotropic nature of the spectrum is attributable to enhanced spin lattice relaxation and spin -spin interac- tion, moreover the spectrum is recorded in a magneti- cally concentrated medium. 26 Absence of half field signal in the EPR spectrum rules out any metal-metal interaction in the complex.
In the octahedral complexes of molybdenum (V), the single electron located in dxy orbital. This orbital is related to other four d orbitals by rotations about one or other of the cartesian axes. If the rotation moves the electron into a vacant orbital, then the current resulting from the circulation leads to a magnetic field that opposes the applied field. Consequently the larger lab- oratory field is required to meet the Zeeman conditions and the calculated g value will be smaller than the free electron.27
FAB Mass Spectra
Mass spectroscopy, which is mainly applied in the anal- ysis of biomolecules, has been increasingly used as a pow- erful structural characterization technique in coordination chemistry. The FAB mass spectra of the ligand HL (Fig. 4) and its complexes 1 and 4 were recorded and their sto- ichiometric compositions were compared. The molecular ion peak [M+H]+ for ligand (C18H18N4O3), is at 339.77.
The complexes 1 and 4 show molecular ion peaks at m/z 556.16 and 537.21 respectively, suggesting the complexes to be monomeric.
Thermal Studies
Thermal behavior of the complexes 1 and 5 were stud- ied by TGA and DTG techniques by heating in air at a rate of 10oC per min. TG and DTG curves of complexes 1 and 4 were shown in Figs. 5 and 6, respectively.
The decomposition of the complex 1 takes place in three stages as indicated by the DTG peaks at 204oC, 336oC and 639oC. The stability range was extended from ambi- ent temperature to 170oC. The initial mass loss 1-2% may be due to the desorption of moisture.First decomposition stage starts at 170oC and ended at 230oC. The mass loss of 6.37% (calc.6.43%) is assigned to the loss of one mole of chlorine atom.The second stage decomposition ranged from 270oC to 410oC. The weight loss at this stage was 43.8% and this stage could not be assigned to any specific decomposition. After this stage, weight loss takes place Fig. 4. FAB mass spectrum of HL.
Fig. 5. TG and DTG curves of [MoO(HL)Cl3].
slowly and continuosly.The sample showed another weight loss in the region 590-680oC. The weight loss in this stage was 24.07% (calc. 24.52%) ascribed to the oxidative decomposition of the remaining part of the complex to give MoO3 as the ultimate residue. The weight of the sam- ple at 680oC was consisitent with the formation of MoO3. The sample showed another weight loss in the region 740- 790oC. This may be due to the volatilization of MoO3
above 740oC.28,29
The thermal decomposition of the complex 5 occurred in two stages as denoted by the DTG peaks at 297and 434oC. The complex is stable upto 260oC. The first stage decomposition starts at 260oC and is completed at 330oC.
Fig. 7. (a) X-ray powder diffraction pattern of [MoO(HL)Cl3] before irradiation, (b) X-ray powder diffraction pattern of [MoO(HL)Cl3] after irradiation.
Fig. 6. TG and DTG curves of [MoO2(HL)(NCS)2].
The mass loss of 20.47% (calc.19.95%) corresponded to the loss of anionic part of the complex. The second stage decomposition ranges from 380oC to 490oC. The weight loss at this stage was 54.68% (calc. 55.86%). The weight of the sample at 490oC was consistent with the forma- tion of MoO3 formed by the oxidative decomposition of the complex.
Irradiation Studies
X-ray diffraction and surface morphology of the com- plexes [MoO(HL)Cl3] and [MoO2(HL)Cl2] were studied before and after gamma irradiation.
Colour
No colour change occurred upon irradiation indicating the absence of colour centers in the sample.
X-ray Diffraction Studies
X-ray diffractograms for the unirradiated and irradiated samples of [MoO(HL)Cl3] and [MoO2(HL)Cl2] are given in Figs. 7a, 7b, 8a & 8b, respectively. XRD patterns are indexed using Hesse and Lipson’s procedure.30 Lattice constants and lattice parameters are listed in Table 3 and the X-ray diffraction data are presented in Tables 4 & 5.
Lattice imperfections caused by irradiation influence
Fig. 8. (a) X-ray powder diffraction pattern of [MoO2(HL)Cl2] before irradiation, (b) X-ray powder diffraction pattern of [MoO2
(HL)Cl2] after irradiation.
the X-ray diffraction pattern of a substance. In the present study it is observed that unit cell parameters changed upon irradiation. The intensities of powder lines and the cor-
responding 2θ values are found to be different for the irra- diated sample. The unirradiated [MoO(HL)Cl3] was found to have orthorhombic lattice but the irradiated [MoO(HL)Cl3] recorded only very few reflections and hence could not be indexed. This may be an indication of the amorphous nature of the complex. Both unirradiated and irradiated [MoO2(HL)Cl2] complexes are found to have orthorhom- bic lattice.
High energy of radiation may change the physical prop- erties of materials. The changes are strongly dependent on the internal structure of the absorbed substance, the radi- ation energy and dose.31 The radiation may cause ionization or excitation of the electrons and possibly, displacement of atoms from their sites in the lattice of the solid. The size of the crystal may change due to the stress caused by irra- diation. If the crystals are under uniform stress, a contraction of the unit cell occurs. The stress factor and structure fac- Table 3. Lattice constants and lattice parameters
Complexes Lattice Constants (Å) Lattice parameters (Å) Particle size (nm)
A B C a b c
[MoO(HL)Cl3] Unirradiated 0.009 0.020 0.016 8.12 5.44 6.08 40.33
[MoO2(HL)Cl2] Unirradiated 0.0198 0.0133 0.009 5.47 6.67 8.11 23.9
[MoO2(HL)Cl2] Irradiated to 800 kGy 0.0044 0.00653 0.00715 11.60 9.52 9.10 24.1
Table 4. XRD data of [MoO(HL)Cl3] Unirradiated MoO(HL)Cl3]
Sin2 θ (obs) Sin2 θ(calc) hkl Intensity %
0.0086 0.009 100 68.14
0.0238 0.025 101 33.40
0.0287 0.029 110 46.85
0.0345 0.036 011 100
0.0442 0.045 111 46.74
0.0495 0.052 201 46.06
0.0576 0.056 210 60.10
0.0605 0.064 002 55.03
0.0774 0.073 102 42.95
0.1091 0.105 121 14.12
Table 5. XRD data of [MoO2(HL)Cl2]
Unirradiated MoO2(HL)Cl2] Irradiated MoO2(HL)Cl2]
Sin2 θ (obs) Sin2 θ (calc) hkl Intensity % Sin2 θ (obs) Sin2θ (calc.) hkl Intensity %
0.00845 0.009 001 67.74 0.00419 0.0044 100 18.4
0.01265 0.0133 010 100 0.00630 0.00653 010 33.9
0.01991 0.0198 100 24.7 0.00723 0.00715 001 100
0.03327 0.033 110 20.62 0.01134 0.01155 101 18.4
0.04198 0.042 111 51.78 0.015 0.01368 011 13
0.0397 0.036 002 17.11 0.01619 0.0176 200 24.1
0.0766 0.073 120 13.55 0.01889 0.01808 111 14.8
0.10172 0.1015 211 82.77 0.02921 0.0305 120 13.9
0.18085 0.1782 300 4.08 0.03115 0.03128 211 11.4
0.03618 0.03513 012 10.1
0.03304 0.033 102 12
0.0388 0.03767 122 15.2
0.03920 0.03953 112 16
0.03957 0.0396 300 17.7
0.04517 0.04613 310 14.4
0.05457 0.05328 311 11.5
0.05815 0.05877 030 16.1
0.059183 0.05912 122 15.5
0.06468 0.06435 003 10.7
0.09882 0.09837 330 10.5
0.12419 0.12312 033 10.1
tor are responsible for the overall change in the intensity of diffraction lines, crystallite size and unit cell parame- ters.32
The particle sizes calculated using Scherer equation, d = Bλ/β cosθ, (where d, B, λ, β and θ are the particle diam- eter, in Å, of the crystalline phase, Scherer constant (0.9), wavelength of X-ray beam (1.5439 Å), FWHM (Full Width Half Maximum) of the main diffraction line of XRD and its diffraction angle, respectively).
Surface Morphology
SEM micrographs of the ligand, unirradiated and irra- diated samples of [MoO(HL)Cl3] and [MoO2(HL)Cl2] are given in Fig. 9. Changes in the scanning electron micro- graphs indicate that the applied dose can cause changes in the surface morphology of crystals.
The SEM micrograph of the ligand as shown in Fig.
9(a) reveal an amorphous nature for the ligand. The SEM
images of the unirradiated [MoO(HL)Cl3] and [MoO2
(HL)Cl2] complexes of the ligand given in Figs. 9(b), (c), (e) and (f), respectively exhibit significant change in mor- phology upon complex formation. The SEM image of the unirradiated [MoO(HL)Cl3] (Figs. 9b & 9c) shows the presence of micro rods and micro spheres, the diameter of which is less than 2 µm. The SEM image at lower reso- lutions of the unirradiated [MoO2(HL)Cl2] complex (Fig.
9e) distinctly reveal the formation of micro rods with an average diameter of approximately 2µm. Higher resolu- tions of this complex show the presence of nano spheres on the surface of the microrods.
Figs. 9(d) and (g) depict the SEM images of the [MoO (HL)Cl3] and [MoO2(HL)Cl2] complexes after γ irradia- tion. Irradiation of the complexes with γ rays have brought about noticeable changes in the particle size and mor- phology of the samples. The oxomolybdenum (V) com- plex have crystals with well defined edges and exhibits
Fig. 9. SEM Micrographs of ligand and complexes. 9a Ligand, 9b & c [MoO(HL)Cl3] before irradiation, 9d [MoO(HL)Cl3] after irra- diation, 9e & f [MoO2(HL)Cl2] before irradiation, 9g [MoO2(HL)Cl2] after irradiation.
some degree of aggregation. On the other hand, the nano spheres seen on the surface of the micro rods of dioxo- molybdenum (VI) complex have completely vanished and the complex achieve a rod or stick shape with prismatic geometry. Moreover the length of the rods has been brought down to less than that before irradiation. The diameter or thickness of the rods has been reduced to less than 300 nm after γ irradiations. The results clearly indicate that γ irra- diation has a vital effect in tuning the size and morphol- ogy of the synthesized complexes.
Antimicrobial Study
The ligand and complexes were not active against M.
tuberculosis H37Rv, E. coli and Lactobacillus leichman- nii.
Thus on the basis of the spectral data and physicochem- ical studies, a distorted octahedral geometry (Figs. 10 and 11) has been tentatively proposed for all the complexes.
CONCLUSION
The synthesis and characterization of octahedral oxo- molybdenum (V) and dioxomolybdenum (VI) complexes with bidentate chelating ligand are reported. From the
spectroscopic, analytical and thermal analysis data, it can be concluded that the molybdenum existed in a distorted octahedral environment with the ligand. The FAB mass and EPR spectral data suggest monomeric nature of the complexes. X-ray diffraction study revealed that unit cell parameters have changed upon irradiation. SEM study showed that γ irradiation have impact on the size and mor- phology of the synthesized complexes.
Acknowledgements. The authors are thankful to NIIST, Thiruvananthapuram, STIC, Kochi, and Department of Chemistry, University of Kerala, Thiruvananthapuram, SAIF, I.I.T. Bombay for the facilities provided for the above studies and analysis. We are grateful to the authorities of the Rubber Board, Kottayam, Government of India, for providing facilities for γ-irradiation.
REFERENCES
1. Dhavan, T. K.; Enemark, J. H. Inorg. Chem. 1996, 35, 4873.
2. Jeyakumar, K. D.; Chand, K. J. Chem. Sci. 2009, 121, 111.
3. Harikumaran Nair, M. L.; Thankamani, D. Russ. J. Coord.
Chem. 2010, 36, 259.
4. Da Costa, A. P.; Reis, P. M.; Gamelas, C.; Romão, C. C.;
Royo, B. Inorg. Chim. Acta 2008, 361, 1915.
5. Arnáiz, F. J.; Guado, R. A.; Pedrosa, M. R.; Maestro, M.
A. Polyhedron 2004, 23, 537.
6. Wong, Y.; Cowley, A. R.; Dilworth, J. R. Inorg. Chim.
Acta 2004, 357, 4358.
7. Burgmayer, S. J. N.; Stiefel, E. I. J. Chem. Edu. 1985, 62, 943.
8. Prathapachandra Kurup, M. R.; Seena, E. B. Polyhedron 2007, 26, 3595.
9. Harikumaran Nair, M. L.; Thankamani, D. Indian J. Chem.
2009, 48A, 1212.
10. El-Shobaky, H. G.; El-Mohsen, M. T. J. Radioanal. Nucl.
Chem. 2002, 254, 151.
11. Krishnan, G.; Jayashri, T. A. J. Radioanal. Nucl. Chem.
2008, 277, 693.
12. Zidan, A. S. A.; El-Said A. I.; El-Meligy,M. S.; Aly, A.
A. M.; Mohammed, O. F. J. Therm. Anal. Calorim. 2000, 62, 665.
13. Vogel, A. I. A text book of Quantitative Inorganic Anal- ysis; John Wiley and Sons: New York, 1963.
14. Dutta, R. L.; Syamal, A. Elements of Magneto Chemistry;
East West Press: New Delhi, India, 1992.
15. Harikumaran Nair, M. L.; Sheela, A. Indian J. Chem.
2008, 47(A), 1787.
16. Harikumaran Nair, M. L.; Siji, V. L. J. Indian Chem. Soc.
2009, 86, 441.
17. Figgis, B. N. Introduction to Ligand Fields; Interscience- Fig. 10. Proposed 2D structure of [MoO(HL)XCl2].
Fig. 11. Proposed 2D structure of MoO2(HL)XCl].
John Wiley: New York, 1966.
18. Harikumaran Nair, M. L.; Prabhakaran, C. P. Indian J.
Chem. 1998, 37(A), 452.
19. Gupta, N.; Singh, R. V. Indian J. Chem. 1998, 37(A), 75.
20. Nakamoto, K. Infrared and Raman Spectra of Inorganic and Coordination Compounds; Wiley & Sons: New York, 1978.
21. Prathapachandra Kurup, M. R.; Mangalam, N. A. Spec- trochim. Acta 2009, 71, 2040.
22. Lever, A. B. P. Inorganic Electronic Spectroscopy; Elsevier:
New York, 1984.
23. Ballhausen, C. J.; Gray, H. B. Molecular Orbital Theory;
Benjamin: New York, 1965.
24. Harikumaran Nair, M. L.; Thankamani, D. J. Ind. Chem.
Soc. 2010, 87, 1029.
25. Mandlik, P.; More, M. B.; Aswar, A. S. Indian J. Chem.
2003, 42, 1064.
26. Bindu, P.; Prathapachandra Kurup, M. R.; Satyakeerty, T. R.
Polyhedron 1998, 18, 321.
27. Que Lawrence Physical Methods in Bioinorganic Chem- istry-Spectroscopy and Magnetism; University Science Books-Saulsalifo: California, 2000.
28. Soria, D. B.; Barqui, M.; Gonzalez, M. J.; Garmendia, Estiu, G. J. Coord. Chem. 2008, 61, 3815.
29. Sridevi, N.; Yusuff, K. K. M. Indian J. Chem. 2008, 47(A), 836.
30. Lipson, H.; Steeple, H. Interpretation of X-ray Powder Diffraction Patterns; Macmillan: London, 1979.
31. Lemine, O. M.; Alharbi, A.; Bououdina, M.; Alamry, S.;
Kh. Ziq. Univ. Sharjah J. Pure Appl. Sci. 2008, 5, 26.
32. Krishnan, G.; Jayashri, T. A.; Sudha, P. Radiat. Phys. Chem.
2009, 78, 933.
![Fig. 3. EPR spectrum of complex [MoO(HL)Cl 3 ].](https://thumb-ap.123doks.com/thumbv2/123dokinfo/5299212.154449/4.892.90.426.478.733/fig-epr-spectrum-complex-moo-hl-cl.webp)
![Fig. 5. TG and DTG curves of [MoO(HL)Cl 3 ].](https://thumb-ap.123doks.com/thumbv2/123dokinfo/5299212.154449/5.892.187.700.140.483/fig-tg-and-dtg-curves-moo-hl-cl.webp)
![Fig. 6. TG and DTG curves of [MoO 2 (HL)(NCS) 2 ].](https://thumb-ap.123doks.com/thumbv2/123dokinfo/5299212.154449/6.892.147.750.422.1061/fig-tg-and-dtg-curves-moo-hl-ncs.webp)
![Fig. 8. (a) X-ray powder diffraction pattern of [MoO 2 (HL)Cl 2 ] before irradiation, (b) X-ray powder diffraction pattern of [MoO 2](https://thumb-ap.123doks.com/thumbv2/123dokinfo/5299212.154449/7.892.153.744.410.1058/powder-diffraction-pattern-irradiation-powder-diffraction-pattern-moo.webp)
![Table 5. XRD data of [MoO 2 (HL)Cl 2 ]](https://thumb-ap.123doks.com/thumbv2/123dokinfo/5299212.154449/8.892.85.431.324.550/table-xrd-data-moo-hl-cl.webp)
![Fig. 9. SEM Micrographs of ligand and complexes. 9a Ligand, 9b & c [MoO(HL)Cl 3 ] before irradiation, 9d [MoO(HL)Cl 3 ] after irra- irra-diation, 9e & f [MoO 2 (HL)Cl 2 ] before irradiation, 9g [MoO 2 (HL)Cl 2 ] after irradiation.](https://thumb-ap.123doks.com/thumbv2/123dokinfo/5299212.154449/9.892.111.783.523.1064/micrographs-ligand-complexes-ligand-irradiation-diation-irradiation-irradiation.webp)
![Fig. 11. Proposed 2D structure of MoO 2 (HL)XCl].](https://thumb-ap.123doks.com/thumbv2/123dokinfo/5299212.154449/10.892.102.406.148.333/fig-proposed-d-structure-moo-hl-xcl.webp)
