ABSTRACT
Background: Nonalcoholic fatty liver disease (NAFLD) is associated with a wide spectrum of metabolic abnormalities. This study aimed to evaluate whether NAFLD is associated with benign prostatic hyperplasia (BPH) independent of other risk factors.
Methods: A total of 3,508 subjects who underwent prostate and hepatic ultrasonography were enrolled. NAFLD was diagnosed and graded by ultrasonographic findings. BPH was defined by total prostate volume.
Results: The prevalence of BPH was significantly increased according to NAFLD severity (P < 0.001). The multivariate analysis showed that NAFLD was associated with a 22% increase in the risk of BPH (odds ratio [OR], 1.22; 95% confidence interval [CI], 1.02–1.45). In non- obese subjects, NAFLD was associated with a 41% increase in the risk of BPH (OR, 1.41; 95%
CI, 1.14–1.73), and an incremental increase in the risk of BPH according to NAFLD severity was pronounced (adjusted OR [95% CI], 1.32 [1.05–1.68] for mild NAFLD, 1.55 [1.15–2.10]
for moderate to severe NAFLD vs. no NAFLD, P for trend = 0.004). However, in the obese population, the association of NAFLD in the risk of BPH was insignificant (P = 0.208).
Conclusion: NAFLD is associated with an increased risk of BPH regardless of metabolic syndrome, especially in non-obese subjects. An incrementally increased risk of BPH according to NAFLD severity is prominent in non-obese subjects with NAFLD. Thus, physicians caring for non-obese patients with NAFLD may consider assessing the risk of BPH and associated urologic conditions.
Keywords: Hepatic Steatosis; Non-Obese; Prostate Hyperplasia
INTRODUCTION
Benign prostatic hyperplasia (BPH) is a highly prevalent urologic condition among middle and advanced-age men, with increasing prevalence; 42% of 51- to 60-year-old men and 85%
in men older than 80 years.1 BPH causes lower urinary tract symptoms (LUTS), and severe BPH can lead to deterioration in quality of life and has relevant socio-economic costs.2 BPH is histologically characterized by the nonmalignant enlargement of the periurethral
Original Article
Received: Dec 18, 2019 Accepted: Mar 31, 2020 Address for Correspondence:
Jeong Yoon Yim, MD, PhD
Department of Internal Medicine, Healthcare Research Institute, Seoul National University Hospital, Healthcare System Gangnam Center, 39FL., Gangnam Finance Center, 152 Teheran-ro, Gangnam-gu, Seoul 06236, Korea.
E-mail: [email protected]
© 2020 The Korean Academy of Medical Sciences.
This is an Open Access article distributed under the terms of the Creative Commons Attribution Non-Commercial License (https://
creativecommons.org/licenses/by-nc/4.0/) which permits unrestricted non-commercial use, distribution, and reproduction in any medium, provided the original work is properly cited.
ORCID iDs Goh Eun Chung
https://orcid.org/0000-0001-8344-7737 Jeong Yoon Yim
https://orcid.org/0000-0002-8175-5813 Donghee Kim
https://orcid.org/0000-0003-1919-6800 Min-Sun Kwak
https://orcid.org/0000-0003-0353-6460 Jong In Yang
https://orcid.org/0000-0002-1625-8271 Boram Park
https://orcid.org/0000-0001-6874-2199 Seong Joon An
https://orcid.org/0000-0003-3656-4628
Goh Eun Chung ,1 Jeong Yoon Yim ,1 Donghee Kim ,2 Min-Sun Kwak ,1 Jong In Yang ,1 Boram Park ,3 Seong Joon An ,4 and Joo Sung Kim 1,5
1 Department of Internal Medicine, Healthcare System Gangnam Center, Seoul National University Hospital, Seoul, Korea
2Division of Gastroenterology and Hepatology, Stanford University School of Medicine, Stanford, CA, USA
3Department of Public Health Science, Seoul National University, Seoul, Korea
4Korea University College of Medicine, Seoul, Korea
5 Department of Internal Medicine and Liver Research Institute, Seoul National University College of Medicine, Seoul, Korea
Nonalcoholic Fatty Liver Disease Is Associated with Benign Prostate Hyperplasia
Gastroenterology &
Hepatology
Joo Sung Kim
https://orcid.org/0000-0002-7465-3085 Disclosure
The authors have no potential conflicts of interest to disclose.
Author Contributions
Conceptualization: Chung GE, Yim JY. Data curation: Kwak MS, Yang JI, An SJ, Kim JS.
Methodology: Kwak MS, Yang JI, Park B.
Formal analysis: Park B. Supervision: Yim JY, Kim D. Writing - original draft: Chung EG.
Writing - review & editing: Yim JY, Kim D.
transition zone of the prostate with stromal and epithelial cell hyperplasia.3 Traditionally, the pathogenesis of BPH is closely linked to age and the effects of androgens.4 However, recent studies have suggested that metabolic disease and other factors including family history, ethnicity, and lifestyle are closely associated with BPH.5 Furthermore, several studies have suggested the relevant roles of diabetes, hypertension, insulin and obesity in the pathogenesis of prostatic enlargement.6-8
Nonalcoholic fatty liver disease (NAFLD) is the most common liver disease, with an estimated prevalence of 20%–30%.9 Because the central pathogenesis of NAFLD development is insulin resistance, NAFLD is regarded as a hepatic feature of metabolic syndrome (MS).10 NAFLD has been known to be associated with extrahepatic diseases such as cardiovascular disease, chronic kidney disease and colorectal neoplasm.11 As extrahepatic manifestations of NAFLD, the association between NAFLD and BPH has been suggested.12,13 However, to date, the sample sizes of the studies evaluating the association between NAFLD and BPH were relatively small and the association with respect to NAFLD severity had not been reported.
A recent review article has reported that as consequences as severe as obese NAFLD, non- obese NAFLD in the general population occurs with a high prevalence as 21%–27% in all ethnicities.14 In this study, we aimed to evaluate whether NAFLD and NAFLD severity are associated with BPH independent of conventional risk factors. Furthermore, we performed subgroup analysis according to obesity for identification of the association between NAFLD and BPH in terms of obesity.
METHODS
Study population
In this retrospective study, men who underwent abdominal ultrasonography and transrectal prostate ultrasonography evaluation between January 2015 and December 2016 during health checkups at Seoul National University Gangnam Center were consecutively enrolled for this study. Initially, a total of 4,605 subjects were enrolled. A total of 3,058 subjects remained in the study after consideration of the following exclusion criteria: history of prostatectomy in 10 subjects; prostate-specific antigen (PSA) level > 10 ng/mL in 10 subjects; and potential cause of chronic liver disease including hepatitis B virus positivity in 162 subjects, anti- hepatitis C virus (HCV) antibody positivity in 42 subjects and significant alcohol intake (> 20 g/day) in 1,323 subjects.15 The subjects in the NAFLD group were randomly selected from the database file with propensity score (PS) matching to the control group (1:1 ratio).
Clinical and laboratory parameters
The method used in this study has been described previously in detail.16 Briefly, each individual completed a questionnaire describing current medications and their past medical history and underwent an anthropometric evaluation. All the subjects were assessed for LUTS using the International Prostate Symptom Scores (IPSS). LUTS severities were classified as mild (IPSS ≤ 7), moderate (IPSS of 8–19) and severe (IPSS ≥ 20). We defined current smokers as those who had smoked at least one cigarette per day in the previous year. Using height and body weight measured using a digital scale, body mass index (BMI) was calculated as weight in kilograms divided by height in meters squared (kg/m2). Waist circumference (WC) was measured with a measuring tape midway between the lower rib margin and iliac crest.
Hypertension was defined as having systolic blood pressure ≥ 140 mmHg, having diastolic blood pressure ≥ 90 mmHg or using of anti-hypertensive medication.
Serum aspartate aminotransferase (AST), alanine aminotransferase (ALT), total cholesterol, triglycerides, high-density lipoprotein cholesterol (HDL-C), low-density lipoprotein cholesterol (LDL-C), fasting glucose, hemoglobin A1c, hepatitis B surface antigen and anti-HCV antibody levels were measured. PSA was measured using an immunoassay analyzer (Abbott i2000sr, Abbott Laboratories, Chicago, IL, USA). Fasting glucose levels ≥ 126 mg/dL and/or treatment with an oral hypoglycemic agent or insulin were used to define the presence of diabetes mellitus. MS was diagnosed when three or more of the following five components were present, based on the modified National Cholesterol Education Program Adult Treatment Panel III.17 Diagnosis of NAFLD and BPH
Hepatic ultrasonography (Acuson Sequoia 512; Siemens, Mountain View, CA, USA) was used both for diagnosis and staging of NAFLD. Ultrasonography examination was performed by experienced radiologists who were blinded to the clinical presentation of the subjects. Fatty liver was diagnosed based on known standard citeria.18 Grading of liver steatosis was performed based on ultrasonographic findings; mild fatty liver as a slight diffuse increase in bright homogeneous echoes in the hepatic parenchyma and the normal visualization of the diaphragm and hepatic and portal borders; moderate fatty liver as a diffuse increase in bright echoes in the hepatic parenchyma with slightly impaired appearance of intrahepatic vessels and the diaphragm;
and severe fatty liver as a marked increase in bright echoes with poor or no visualization of intrahepatic vessel borders, the diaphragm and the posterior right lobe of the liver.19 The prostate gland volume and the transition zone volume were determined using transrectal ultrasound by a certified radiologist. BPH was defined by total prostate volume ≥ 30 mL.20
Statistical analysis
Independent samples t-test or one-way analysis of variance was used for the comparison of
continuous variables in case of normal data distribution, whereas the Mann Whitney U test was used if the variables had a non-normal distribution. The Pearson's χ2 test was used for the comparison of categorical variables. A logistic regression analysis was utilized to analyze the association between NAFLD and NAFLD severity and BPH after adjusting for potential confounders, including age, smoking, BMI, diabetes, hypertension, MS, and HDL-C. We also showed PS-adjusted model. PS was generated by logistic regression analysis with covariates including age, smoking, diabetes, hypertension, BMI, WC, AST, ALT, total cholesterol, triglycerides, HDL-C and LDL-C. Patients with NAFLD were matched (1:1) to those without NAFLD on the basis of PS. The balancing in variables between groups was evaluated by both P value and standardized mean difference (SMD).
We analysed the PS-matched cohort using conditional logistic regression. Statistical analyses were conducted using SPSS Statistics version 21 (IBM, Chicago, IL, USA) and Stata 14.2 (StataCorp, College Station, TX, USA). A P value less than 0.05 was considered statistically significant.
Ethics statement
The study protocol followed the Helsinki declaration of 1975, as revised in 1983. This study was approved by the Institutional Review Board of Seoul National University Hospital (H- 1706-011-855). The requirement for informed consent from individual was waived.
RESULTS
Study population
The mean age of the subjects was 56.9 ± 8.6 years. Of the 3,508 subjects, 2,308 (65.8%) subjects had BPH. The demographic characteristics of the subjects with and without BPH
is provided in Table 1. Older age, higher prevalence rates of diabetes mellitus, hypertension and higher blood pressure, larger WC and higher BMI, fasting glucose levels, total prostate volume, transitional zone volume and PSA levels were observed in subjects with BPH than in subjects without BPH. The prevalence of NAFLD was significantly higher in subjects with BPH than in subjects without BPH (P < 0.001). Compared with normal prostate volume, the severity of NAFLD increased in the subjects with BPH (27.7% vs. 29.4% for mild, 20.0% vs.
26.4% for moderate to severe NAFLD).
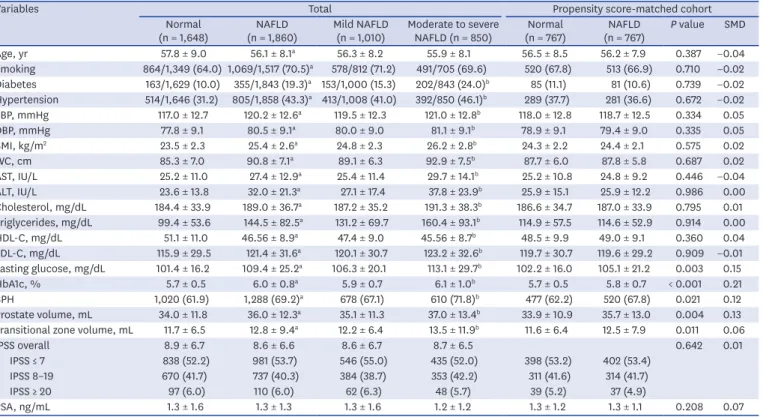
The prevalence of NAFLD was 53.0% in this cohort (mild 1,009 [28.8%] and moderate to severe 850 [24.2%]). Table 2 describes the characteristics of the study cohort according to the presence and severity of NAFLD. Noticeable differences were observed in the demographic and clinical characteristics of subjects with and without NAFLD. Subjects with NAFLD had higher prevalence rates of diabetes mellitus and hypertension, higher blood pressure and BMI, larger WC, higher serum levels of AST, ALT, triglycerides, LDL-cholesterol, and fasting glucose levels, and lower levels of HDL-C, than subjects without NAFLD. Subjects with NAFLD also had a higher prevalence of BPH and, higher prostate volume and transitional zone volume than subjects without NAFLD. In terms of the NAFLD severity, subjects with moderate to severe NAFLD had a higher prevalence of BPH than those with mild NAFLD (P
< 0.05). Furthermore, subjects with moderate to severe NAFLD had higher prostate volume and transitional zone volume than those with mild NAFLD. IPSS was not different between with and without NAFLD. In the PS-matched cohort, most variables were balanced between Table 1. Comparison of baseline characteristics between subjects with and without BPH
Characteristics Normal (n = 1,200) BPH (n = 2,308) P value
Age, yr 54.3 ± 8.3 58.3 ± 8.4 < 0.001
Smoking 664/1,009 (65.8) 1,269/1,857 (68.3) 0.168
Diabetes 153/1,198 (12.9) 365/2,289 (15.9) 0.018
Hypertension 361/1,198 (30.1) 958/2,306 (41.5) < 0.001
Systolic blood pressure, mmHg 117.3 ± 12.7 119.4 ± 12.7 < 0.001
Diastolic blood pressure, mmHg 78.7 ± 9.3 79.5 ± 9.1 0.010
BMI, kg/m2 24.0 ± 2.6 24.8 ± 2.7 < 0.001
WC, cm 86.5 ± 7.7 89.1 ± 7.4 < 0.001
AST, IU/L 26.6 ± 12.5 26.2 ± 11.9 0.458
ALT, IU/L 27.5 ± 17.9 28.3 ± 19.0 0.209
Cholesterol, mg/dL 188.1 ± 33.6 186.2 ± 36.4 0.114
Triglycerides, mg/dL 122.4 ± 76.1 123.8 ± 72.8 0.604
HDL-C, mg/dL 49.1 ± 10.2 48.5 ± 10.2 0.078
LDL-C, mg/dL 119.5 ± 29.7 118.5 ± 31.3 0.358
Fasting glucose, mg/dL 103.9 ± 20.0 106.6 ± 22.7 < 0.001
HbA1C, % 5.8 ± 0.7 5.9 ± 0.7 0.006
Prostate volume, mL 25.0 ± 3.5 40.2 ± 11.7 < 0.001
Transitional zone volume, mL 7.9 ± 2.3 14.5 ± 11.7 < 0.001
IPSS overall 7.7 ± 6.2 9.3 ± 6.7 < 0.001
IPSS ≤ 7 691 (58.6) 1,128 (50.0) < 0.001
IPSS 8–19 442 (37.5) 956 (42.8)
IPSS ≥ 20 46 (3.9) 161 (7.1)
PSA, ng/mL 0.9 ± 0.8 1.5 ± 1.6 < 0.001
Metabolic syndrome 196 (16.3) 547 (23.7) < 0.001
NAFLD 572 (47.7) 1,288 (55.8) < 0.001
Mild 332 (27.7) 678 (29.4) < 0.001
Moderate to severe 240 (20.0) 610 (26.4)
Data are shown as the mean ± standard deviations or number (%).
BPH = benign prostate hyperplasia, BMI = body mass index, WC = waist circumference, AST = aspartate aminotransferase, ALT = alanine aminotransferase, HDL-C = high-density lipoprotein cholesterol, LDL-C = low- density lipoprotein cholesterol, HbA1C = hemoglobin A1C, IPSS = International Prostate Symptom Score, PSA = prostate specific antigen, NAFLD = nonalcoholic fatty liver disease.
NAFLD and non-NAFLD group after PS matching, several variables (fasting glucose, HbA1c, prostate volume, and transitional zone volume) were unbalanced (P < 0.05).
NAFLD and BPH
The prevalence of BPH was significantly higher in subjects with NAFLD, moderate to severe NAFLD, and obesity than in subjects without comorbidities (P < 0.001) (Fig. 1).
We analyzed the independent factors that showed significant association with the risk of Table 2. Comparison of baseline characteristics according to presence and severity of NAFLD
Variables Total Propensity score-matched cohort
Normal
(n = 1,648) NAFLD
(n = 1,860) Mild NAFLD
(n = 1,010) Moderate to severe
NAFLD (n = 850) Normal
(n = 767) NAFLD
(n = 767) P value SMD
Age, yr 57.8 ± 9.0 56.1 ± 8.1a 56.3 ± 8.2 55.9 ± 8.1 56.5 ± 8.5 56.2 ± 7.9 0.387 −0.04
Smoking 864/1,349 (64.0) 1,069/1,517 (70.5)a 578/812 (71.2) 491/705 (69.6) 520 (67.8) 513 (66.9) 0.710 −0.02 Diabetes 163/1,629 (10.0) 355/1,843 (19.3)a 153/1,000 (15.3) 202/843 (24.0)b 85 (11.1) 81 (10.6) 0.739 −0.02 Hypertension 514/1,646 (31.2) 805/1,858 (43.3)a 413/1,008 (41.0) 392/850 (46.1)b 289 (37.7) 281 (36.6) 0.672 −0.02 SBP, mmHg 117.0 ± 12.7 120.2 ± 12.6a 119.5 ± 12.3 121.0 ± 12.8b 118.0 ± 12.8 118.7 ± 12.5 0.334 0.05
DBP, mmHg 77.8 ± 9.1 80.5 ± 9.1a 80.0 ± 9.0 81.1 ± 9.1b 78.9 ± 9.1 79.4 ± 9.0 0.335 0.05
BMI, kg/m2 23.5 ± 2.3 25.4 ± 2.6a 24.8 ± 2.3 26.2 ± 2.8b 24.3 ± 2.2 24.4 ± 2.1 0.575 0.02
WC, cm 85.3 ± 7.0 90.8 ± 7.1a 89.1 ± 6.3 92.9 ± 7.5b 87.7 ± 6.0 87.8 ± 5.8 0.687 0.02
AST, IU/L 25.2 ± 11.0 27.4 ± 12.9a 25.4 ± 11.4 29.7 ± 14.1b 25.2 ± 10.8 24.8 ± 9.2 0.446 −0.04
ALT, IU/L 23.6 ± 13.8 32.0 ± 21.3a 27.1 ± 17.4 37.8 ± 23.9b 25.9 ± 15.1 25.9 ± 12.2 0.986 0.00
Cholesterol, mg/dL 184.4 ± 33.9 189.0 ± 36.7a 187.2 ± 35.2 191.3 ± 38.3b 186.6 ± 34.7 187.0 ± 33.9 0.795 0.01 Triglycerides, mg/dL 99.4 ± 53.6 144.5 ± 82.5a 131.2 ± 69.7 160.4 ± 93.1b 114.9 ± 57.5 114.6 ± 52.9 0.914 0.00
HDL-C, mg/dL 51.1 ± 11.0 46.56 ± 8.9a 47.4 ± 9.0 45.56 ± 8.7b 48.5 ± 9.9 49.0 ± 9.1 0.360 0.04
LDL-C, mg/dL 115.9 ± 29.5 121.4 ± 31.6a 120.1 ± 30.7 123.2 ± 32.6b 119.7 ± 30.7 119.6 ± 29.2 0.909 −0.01 Fasting glucose, mg/dL 101.4 ± 16.2 109.4 ± 25.2a 106.3 ± 20.1 113.1 ± 29.7b 102.2 ± 16.0 105.1 ± 21.2 0.003 0.15
HbA1c, % 5.7 ± 0.5 6.0 ± 0.8a 5.9 ± 0.7 6.1 ± 1.0b 5.7 ± 0.5 5.8 ± 0.7 < 0.001 0.21
BPH 1,020 (61.9) 1,288 (69.2)a 678 (67.1) 610 (71.8)b 477 (62.2) 520 (67.8) 0.021 0.12
Prostate volume, mL 34.0 ± 11.8 36.0 ± 12.3a 35.1 ± 11.3 37.0 ± 13.4b 33.9 ± 10.9 35.7 ± 13.0 0.004 0.13 Transitional zone volume, mL 11.7 ± 6.5 12.8 ± 9.4a 12.2 ± 6.4 13.5 ± 11.9b 11.6 ± 6.4 12.5 ± 7.9 0.011 0.06
IPSS overall 8.9 ± 6.7 8.6 ± 6.6 8.6 ± 6.7 8.7 ± 6.5 0.642 0.01
IPSS ≤ 7 838 (52.2) 981 (53.7) 546 (55.0) 435 (52.0) 398 (53.2) 402 (53.4)
IPSS 8–19 670 (41.7) 737 (40.3) 384 (38.7) 353 (42.2) 311 (41.6) 314 (41.7)
IPSS ≥ 20 97 (6.0) 110 (6.0) 62 (6.3) 48 (5.7) 39 (5.2) 37 (4.9)
PSA, ng/mL 1.3 ± 1.6 1.3 ± 1.3 1.3 ± 1.6 1.2 ± 1.2 1.3 ± 1.2 1.3 ± 1.1 0.208 0.07
Data are shown as the mean ± standard deviation or number (%).
SMD = standardized mean difference, BMI = body mass index, SBP = systolic blood pressure, DBP = diastolic blood pressure, WC = waist circumference, NAFLD = nonalcoholic fatty liver disease, AST = aspartate aminotransferase, ALT = alanine aminotransferase, HDL-C = high-density lipoprotein cholesterol, LDL-C = low- density lipoprotein cholesterol, HbA1c = hemoglobin A1c, PSA = prostate specific antigen.
aP <0.05 no NAFLD vs. NAFLD; bP <0.05 mild vs. moderate to severe NAFLD.
65
55 75
60 70
No NAFLD Moderate to
severe NAFLD Mild NAFLD
P < 0.001
Prevalence of BPH, %
B
65
55 75
60 70
Non-obese Obese P < 0.001
Prevalence of BPH, %
C
60
50 70
55 65
No NAFLD NAFLD P < 0.001
Prevalence of BPH, %
A
Fig. 1. The prevalence of BPH according to various subgroups. (A) Comparison between no NAFLD and NAFLD, (B) Comparison among the three groups: no NAFLD/mild NAFLD/moderate to severe NAFLD and (C) Comparison between non-obese and obese group.
BPH = benign prostate hyperplasia, NAFLD = nonalcoholic fatty liver disease.
BPH using logistic regression analysis. As a result, older age, higher BMI, WC, presence of diabetes, hypertension, metabolic syndrome and NAFLD showed significant association with BPH (P < 0.05) (Table 3). NAFLD was associated with a 38% increase in the risk of BPH (odds ratio [OR], 1.38; 95% confidence interval [CI], 1.20–1.59) in the univariate model.
In the multivariate analysis, older age, higher BMI, presence of hypertension and NAFLD still showed significant associations with BPH, suggesting that NAFLD has independent association with the risk for BPH (OR, 1.22; 95% CI, 1.02–1.45) (Table 3). When we performed subgroup analysis in subjects with moderate to severe LUTS (IPSS > 7), the association between NAFLD and BPH was not significant (data not shown).
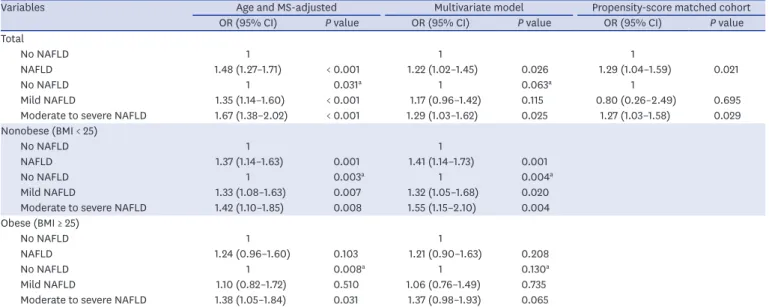
In addition, we analyzed data using logistic regression to evaluate the independent
association between NAFLD severity and BPH. Based on an age-, and MS-adjusted model, the risk of BPH incrementally increased according to the severity of NAFLD (OR [95% CI], 1.35 [1.14–1.60] for mild NAFLD; 1.67 [1.38–2.02] for moderate to severe NAFLD, vs. no NAFLD;
P for trend = 0.031) (Table 4). After adjusting for age, BMI, hypertension, diabetes, smoking status, serum HDL-C levels, and MS, this incremental association according to the NAFLD severity remained but the statistical significance was attenuated (adjusted OR [95% CI], 1.17 [0.96–1.42] for mild NAFLD; 1.29 [1.03–1.62] for moderate to severe NAFLD, vs. no NAFLD;
P for trend = 0.063) (Table 4). When propensity score was adjusted, the association between NAFLD and BPH remained significant (OR, 1.29; 95% CI, 1.04–1.59), and subjects with moderate to severe NAFLD showed increased risk of BPH compared to those without NAFLD (OR, 1.27; 95% CI, 1.03–1.58).
NAFLD in non-obese subjects and BPH
Because the cut-off value for BMI between overweight and obesity was 25 kg/m2 according to the World Health Organization Asian-Pacific criteria,21 we then analyzed the effects of the interactions between obesity and NAFLD on the risk of BPH, stratifying subjects into non- obese (BMI < 25 kg/m2) and obese (BMI ≥ 25 kg/m2) categories according to their BMI. The prevalence rates of BPH were 61.7% in non-obese and 71.9% in obese subjects, respectively.
The prevalence rates of NAFLD were 41.6% in non-obese and 70.8% in obese subjects, respectively. In non-obese subjects, NAFLD was associated with a 41% increase in the risk of BPH (OR, 1.41; 95% CI, 1.14–1.73) when other well-identified metabolic risk factors were Table 3. Parameters associated with benign prostate hyperplasia
Variables Univariate Multivariate
OR 95% CI P value OR 95% CI P value
Age, yr 1.06 1.05–1.07 < 0.001 1.07 1.06–1.08 < 0.001
Smoking 1.12 0.95–1.32 0.168 0.96 0.82–1.14 0.667
Diabetes 1.28 1.04–1.57 0.018 0.90 0.71–1.15 0.417
Hypertension 1.65 1.42–1.91 < 0.001 1.31 1.09–1.58 0.004
BMI, kg/m2 1.13 1.10–1.16 < 0.001 1.14 1.10–1.18 < 0.001
WC, cm 1.05 1.04–1.06 < 0.001
AST, IU/L 1.00 0.99–1.00 0.436
ALT, IU/L 1.00 1.00–1.01 0.221
Cholesterol, mg/dL 1.00 1.00–1.00 0.117
Triglycerides, mg/dL 1.00 1.00–1.00 0.574
HDL-C, mg/dL 0.99 0.99–1.00 0.062 1.00 0.99–1.01 0.994
LDL-C, mg/dL 1.00 0.99–1.00 0.355
MS 1.59 1.33–1.91 < 0.001 1.23 0.96–1.56 0.098
NAFLD 1.38 1.20–1.59 < 0.001 1.22 1.02–1.45 0.026
The multivariate model includes age, BMI, diabetes, hypertension, smoking status, HDL-C, and MS.
OR = odds ratio, CI = confidence interval, BMI = body mass index, WC = waist circumference, AST = aspartate aminotransferase, ALT = alanine aminotransferase, HDL-C = high-density lipoprotein cholesterol, LDL-C = low-density lipoprotein cholesterol, MS = metabolic syndrome, NAFLD = nonalcoholic fatty liver disease.
considered, and the incremental increase in the risk of BPH according to NAFLD severity was pronounced in non-obese subjects with NAFLD (adjusted OR [95% CI], 1.32 (1.05–1.68) for mild NAFLD; 1.55 (1.15–2.10) for moderate to severe NAFLD vs. no NAFLD; P for trend = 0.004) as shown in Table 4. However, in the obese population, the association of NAFLD in the risk of BPH was insignificant (P = 0.208).
DISCUSSION
In this study, we found that NAFLD was associated with an increased risk of BPH,
independent of well-identified metabolic risk factors. Moreover, the severity of NAFLD was associated with an incremental increase in the risk of BPH. However, when we stratified the data according to BMI, the association between NAFLD and BPH was only significant in non- obese subjects. This finding indicates that NAFLD is more important in non-obese subjects for the risk of BPH, and obesity itself may play a major role in the occurrence of BPH in obese subjects as we showed that obesity is a risk factor for BPH.
Consistent with our findings, several studies have suggested the correlation between MS and BPH. A previous study performed in Italy showed that the number of MS components was significantly correlated with prostate volume and anterior-posterior diameter in patients treated with simple prostatectomy, indicating the role of MS as a new risk factor of BPH.22 A systematic review demonstrated that subjects with MS had significantly higher total prostate volume than subjects without MS, suggesting the role of MS in the development of BPH.23 Because insulin resistance is a shared mechanism between NAFLD and MS, NAFLD is considered to be a hepatic manifestation of MS,10 and close associations have been found between NAFLD and MS.10,24 Indeed, previous studies have suggested the association between NAFLD and BPH. However, the sample sizes were relatively small and the severity of NAFLD has not been evaluated.12,13 In this study, we have demonstrated a significant association between NAFLD or NAFLD severity and BPH using a relatively large sample size.
Table 4. Univariate and multivariate binary and ordinal analyses of the risk of BPH in subjects with and without NAFLD
Variables Age and MS-adjusted Multivariate model Propensity-score matched cohort
OR (95% CI) P value OR (95% CI) P value OR (95% CI) P value
Total
No NAFLD 1 1 1
NAFLD 1.48 (1.27–1.71) < 0.001 1.22 (1.02–1.45) 0.026 1.29 (1.04–1.59) 0.021
No NAFLD 1 0.031a 1 0.063a 1
Mild NAFLD 1.35 (1.14–1.60) < 0.001 1.17 (0.96–1.42) 0.115 0.80 (0.26–2.49) 0.695
Moderate to severe NAFLD 1.67 (1.38–2.02) < 0.001 1.29 (1.03–1.62) 0.025 1.27 (1.03–1.58) 0.029 Nonobese (BMI < 25)
No NAFLD 1 1
NAFLD 1.37 (1.14–1.63) 0.001 1.41 (1.14–1.73) 0.001
No NAFLD 1 0.003a 1 0.004a
Mild NAFLD 1.33 (1.08–1.63) 0.007 1.32 (1.05–1.68) 0.020
Moderate to severe NAFLD 1.42 (1.10–1.85) 0.008 1.55 (1.15–2.10) 0.004
Obese (BMI ≥ 25)
No NAFLD 1 1
NAFLD 1.24 (0.96–1.60) 0.103 1.21 (0.90–1.63) 0.208
No NAFLD 1 0.008a 1 0.130a
Mild NAFLD 1.10 (0.82–1.72) 0.510 1.06 (0.76–1.49) 0.735
Moderate to severe NAFLD 1.38 (1.05–1.84) 0.031 1.37 (0.98–1.93) 0.065
The multivariate model was adjusted for age, smoking, body mass index, diabetes, hypertension, MS and high-density lipoprotein cholesterol.
BPH = benign prostatic hyperplasia, NAFLD = nonalcoholic fatty liver disease, MS = metabolic syndrome, OR = odds ratio, CI = confidence interval.
aP value for the test of trend of odds.
Because MS is considered a risk factor for BPH, we performed the logistic regression analysis adjusting for MS, and it showed that the association between NAFLD severity and BPH remained significant. This association implies that NAFLD is an independent risk factor for BPH regardless of MS. Furthermore, as obesity is a risk factor of BPH and due to the effects of the interactions between obesity and NAFLD on the risk of BPH, we stratified subjects into non-obese (BMI < 25 kg/m2) and obese (BMI ≥ 25 kg/m2) categories according to their BMI.
The anaylses showed that the risk of BPH was significant in non-obese subjects with NAFLD but not in obese subjects with NAFLD, indicating that NAFLD may be more important risk factor of BPH in non-obese subjects, and other metabolic derangements of obesity may have more impact on BPH in obese subjects as the association of obesity with BPH is widely accepted.25 In agreement with our results, the independent association of NAFLD with BPH has been reported recently.26,27
Although the mechanism by which NAFLD is associated with BPH is yet to be determined, the possible cause of the close link between NAFLD and BPH with intraprostatic
inflammation could be insulin resistance and chronic inflammation. The pathogenesis may be complex and multidirectional. Insulin resistance is a common feature of NAFLD.
Increased free fatty acid efflux leads to hepatic triglyceride accumulation and contributes to impaired glucose metabolism and insulin sensitivity in the liver and muscles.28 Insulin is a well-known mitogen and growth factor for prostatic epithelial cells. Hyperinsulinemia directly, or indirectly through altered sex hormones, increases sympathetic nerve activity and the insulin-like growth factor axis may lead to increased prostate muscle proliferation.29 Indeed, previous studies have shown that the increased serum insulin level is associated with an increased risk of BPH30, and hyperinsulinemia is causally related to the development of BPH.7 Hepatic steatosis is associated with chronic systemic low-grade inflammation. Many studies have demonstrated significant associations between NAFLD and inflammatory molecules and cytokines.31 Likewise, circulating levels of inflammatory cytokines have been found to be associated with increased risk of BPH,32 and inflammatory cytokines and chemokines represent a direct link between chronic prostate inflammation and stromal cell proliferation.33 Connected by the portal system, the liver is vulnerable to microbiome translocation and microbial products. Alterations in the microbiome may stimulate liver steatosis,34 and microbial products, such as lipopolysaccharides are potentially cytotoxic and induce inflammation. Lipopolysaccharides are recognized by Toll-like receptors which are related to hepatic injury stimulating Toll-like receptors, which activate several signaling cascades to induce the expression of inflammatory cytokines and chemokines.35 Interestingly, stromal prostatic cells are able to secrete interleukin-8 and other inflammatory chemokines, cytokines, and growth factors in response to inflammatory stimuli such as the triggering of Toll-like receptors by lipopolysaccharides.33 This pathway may induce the dedifferentiation of prostate smooth muscle cells and contribute to BPH.36
Another suggested mechanism is hormonal derangements induced by NAFLD. Recently we reported that NAFLD is associated with low serum testosterone.37 Under conditions of NAFLD, inflammatory cytokines released due to chronic hepatic inflammation are thought to directly affect the pituitary gland, reducing luteinizing hormone secretion,38 and may directly suppress the secretion of testosterone from Leydig cells.39 Although there is no clear relationship between the concentration of circulating androgens and BPH, other factors and sex hormones including androgen might be involved in the development and maintenance of BPH. Estrogens and androgens have been implicated as causes of BPH.40-42 Altered relationship of the estradiol/bioavailable testosterone was correlated with BPH.43
Some authors showed that higher testosterone-to-dihydrotestosterone ratio was associated with a 42% decreased risk of BPH.44 The inhibitors of 5α-reductase which converts testosterone to the more potent androgen dihydrotestosterone have proven effective in the management of BPH, suggesting an essential role for androgens in BPH pathophysiology.41 Further functional studies examining free testosterone, bioavailable testosterone,
dihydrotestosterone, estrogen and other related factors should be performed to better understand the link with NAFLD and BPH.
The definition of BPH is variable among studies and involves objective measurements such as prostate tissue volume, decreased urinary flow rate or pressure flow studies with bladder outlet obstruction and subjective measurements including history of noncancer surgery on the prostate, physician-diagnosed BPH or assessment with IPSS. Until now, no one definition has been shown to be more appropriate than the others. Although the correlation between prostate volume and LUTS severity is imperfect, a previous study has shown that low peak urine flow rate and high postvoid residual volume are associated with prostate volumes > 30 mL, which are significantly associated with acute urinary retention requiring catheterization, suggesting prostate volume as a predictor of more serious complications.20
Nevertheless, this study has several limitations. First, the current study was designed as a retrospective observational study, thus, it is difficult to provide a temporal association between NAFLD and BPH. Second, we could not collect data on insulin resistance, various inflammatory parameters or sex hormones. Third, biopsy results, which is the gold standard for the diagnosis of NAFLD, could not be obtained in this study. Because ultrasonographic exam may produce false-negative results when hepatic fatty infiltration falls less than 30%,45 and give rise to inter- and intra-observer diagnostic variability. However, ethical issues limit the application of invasive test to healthy populations; therefore, ultrasonography imaging has been used to diagnose NAFLD according to clinical guidelines.15,46 In terms of BPH, biopsy could not performed and the degrees for the occlusion of the bladder outlet using uroflowmetry were not assessed. The diagnosis of BPH using prostate volume was considered to be limited. Finally, our study included selected population of East Asian ethnicity,
therefore, the conclusions may not be generalizable to the entire population. Further researches are needed to confirm our results.
In conclusion, NAFLD was associated with an increased risk of BPH regardless of MS and an incrementally increased risk for BPH according to NAFLD severity was prominent in non- obese subjects with NAFLD although obesity was a risk factor of BPH. Thus, physicians may consider the risk of BPH in non-obese patients with NAFLD as well as obese ones.
ACKNOWLEDGMENTS
We wish to thank Gu Cheol Jung for his support on this project.
REFERENCES
1. Berry SJ, Coffey DS, Walsh PC, Ewing LL. The development of human benign prostatic hyperplasia with age. J Urol 1984;132(3):474-9.
PUBMED | CROSSREF
2. Holtgrewe HL. Economic issues and the management of benign prostatic hyperplasia. Urology 1995;46(3 Suppl A):23-5.
PUBMED | CROSSREF
3. McNeal JE. Origin and evolution of benign prostatic enlargement. Invest Urol 1978;15(4):340-5.
PUBMED
4. Lee C, Kozlowski JM, Grayhack JT. Etiology of benign prostatic hyperplasia. Urol Clin North Am 1995;22(2):237-46.
PUBMED
5. Vignozzi L, Rastrelli G, Corona G, Gacci M, Forti G, Maggi M. Benign prostatic hyperplasia: a new metabolic disease? J Endocrinol Invest 2014;37(4):313-22.
PUBMED | CROSSREF
6. Bourke JB, Griffin JP. Hypertension, diabetes mellitus, and blood groups in benign prostatic hypertrophy.
Br J Urol 1966;38(1):18-23.
PUBMED | CROSSREF
7. Hammarsten J, Högstedt B. Hyperinsulinaemia as a risk factor for developing benign prostatic hyperplasia. Eur Urol 2001;39(2):151-8.
PUBMED | CROSSREF
8. Muller RL, Gerber L, Moreira DM, Andriole G Jr, Hamilton RJ, Fleshner N, et al. Obesity is associated with increased prostate growth and attenuated prostate volume reduction by dutasteride. Eur Urol 2013;63(6):1115-21.
PUBMED | CROSSREF
9. Browning JD, Szczepaniak LS, Dobbins R, Nuremberg P, Horton JD, Cohen JC, et al. Prevalence of hepatic steatosis in an urban population in the United States: impact of ethnicity. Hepatology 2004;40(6):1387-95.
PUBMED | CROSSREF
10. Marchesini G, Brizi M, Bianchi G, Tomassetti S, Bugianesi E, Lenzi M, et al. Nonalcoholic fatty liver disease: a feature of the metabolic syndrome. Diabetes 2001;50(8):1844-50.
PUBMED | CROSSREF
11. Scorletti E, Byrne CD. Extrahepatic diseases and NAFLD: the triangular relationship between NAFLD, type 2-diabetes and dysbiosis. Dig Dis 2016;34 Suppl 1:11-8.
PUBMED | CROSSREF
12. Russo GI, Cimino S, Castelli T, Favilla V, Gacci M, Carini M, et al. Benign prostatic hyperplasia, metabolic syndrome and non-alcoholic fatty liver disease: is metaflammation the link? Prostate 2016;76(16):1528-35.
PUBMED | CROSSREF
13. Russo GI, Cimino S, Fragalà E, Privitera S, La Vignera S, Condorelli R, et al. Relationship between non- alcoholic fatty liver disease and benign prostatic hyperplasia/lower urinary tract symptoms: new insights from an Italian cross-sectional study. World J Urol 2015;33(5):743-51.
PUBMED | CROSSREF
14. Kim D, Kim WR. Nonobese fatty liver disease. Clin Gastroenterol Hepatol 2017;15(4):474-85.
PUBMED | CROSSREF
15. Chalasani N, Younossi Z, Lavine JE, Diehl AM, Brunt EM, Cusi K, et al. The diagnosis and management of non-alcoholic fatty liver disease: practice guideline by the American Gastroenterological Association, American Association for the Study of Liver Diseases, and American College of Gastroenterology.
Gastroenterology 2012;142(7):1592-609.
PUBMED | CROSSREF
16. Chung GE, Kim D, Kwak MS, Yang JI, Yim JY, Lim SH, et al. The serum vitamin D level is inversely correlated with nonalcoholic fatty liver disease. Clin Mol Hepatol 2016;22(1):146-51.
PUBMED | CROSSREF
17. Expert Panel on Detection, Evaluation, and Treatment of High Blood Cholesterol in Adults. Executive summary of the third report of the National Cholesterol Education Program (NCEP) Expert Panel on Detection, Evaluation, And Treatment of High Blood Cholesterol In Adults (Adult Treatment Panel III).
JAMA 2001;285(19):2486-97.
PUBMED | CROSSREF
18. Angulo P. Nonalcoholic fatty liver disease. N Engl J Med 2002;346(16):1221-31.
PUBMED | CROSSREF
19. Saadeh S, Younossi ZM, Remer EM, Gramlich T, Ong JP, Hurley M, et al. The utility of radiological imaging in nonalcoholic fatty liver disease. Gastroenterology 2002;123(3):745-50.
PUBMED | CROSSREF
20. Kolman C, Girman CJ, Jacobsen SJ, Lieber MM. Distribution of post-void residual urine volume in randomly selected men. J Urol 1999;161(1):122-7.
PUBMED | CROSSREF
21. WHO Expert Consultation. Appropriate body-mass index for Asian populations and its implications for policy and intervention strategies. Lancet 2004;363(9403):157-63.
PUBMED | CROSSREF
22. Gacci M, Vignozzi L, Sebastianelli A, Salvi M, Giannessi C, De Nunzio C, et al. Metabolic syndrome and lower urinary tract symptoms: the role of inflammation. Prostate Cancer Prostatic Dis 2013;16(1):101-6.
PUBMED | CROSSREF
23. Gacci M, Corona G, Vignozzi L, Salvi M, Serni S, De Nunzio C, et al. Metabolic syndrome and benign prostatic enlargement: a systematic review and meta-analysis. BJU Int 2015;115(1):24-31.
PUBMED | CROSSREF
24. Ryoo JH, Choi JM, Moon SY, Suh YJ, Shin JY, Shin HC, et al. The clinical availability of non alcoholic fatty liver disease as an early predictor of the metabolic syndrome in Korean men: 5-year's prospective cohort study. Atherosclerosis 2013;227(2):398-403.
PUBMED | CROSSREF
25. Wang S, Mao Q, Lin Y, Wu J, Wang X, Zheng X, et al. Body mass index and risk of BPH: a meta-analysis.
Prostate Cancer Prostatic Dis 2012;15(3):265-72.
PUBMED | CROSSREF
26. Eren H, Horsanali MO. The independent association of non-alcoholic fatty liver disease with lower urinary tract symptoms/benign prostatic hyperplasia and erectile function scores. BJU Int 2019;124(2):329-35.
PUBMED | CROSSREF
27. Privitera S, Russo GI, La Vignera S, Condorelli RA, Calogero AE, Cantiello F, et al. Benign prostatic hyperplasia and intraprostatic inflammation are associated with liver inflammation: it's time for prevention. Andrology 2018;6(5):737-41.
PUBMED | CROSSREF
28. Bugianesi E, McCullough AJ, Marchesini G. Insulin resistance: a metabolic pathway to chronic liver disease. Hepatology 2005;42(5):987-1000.
PUBMED | CROSSREF
29. Barnard RJ, Aronson WJ, Tymchuk CN, Ngo TH. Prostate cancer: another aspect of the insulin-resistance syndrome? Obes Rev 2002;3(4):303-8.
PUBMED | CROSSREF
30. Dahle SE, Chokkalingam AP, Gao YT, Deng J, Stanczyk FZ, Hsing AW. Body size and serum levels of insulin and leptin in relation to the risk of benign prostatic hyperplasia. J Urol 2002;168(2):599-604.
PUBMED | CROSSREF
31. Stojsavljević S, Gomerčić Palčić M, Virović Jukić L, Smirčić Duvnjak L, Duvnjak M. Adipokines and proinflammatory cytokines, the key mediators in the pathogenesis of nonalcoholic fatty liver disease.
World J Gastroenterol 2014;20(48):18070-91.
PUBMED | CROSSREF
32. Schenk JM, Kristal AR, Neuhouser ML, Tangen CM, White E, Lin DW, et al. Biomarkers of systemic inflammation and risk of incident, symptomatic benign prostatic hyperplasia: results from the prostate cancer prevention trial. Am J Epidemiol 2010;171(5):571-82.
PUBMED | CROSSREF
33. Fibbi B, Penna G, Morelli A, Adorini L, Maggi M. Chronic inflammation in the pathogenesis of benign prostatic hyperplasia. Int J Androl 2010;33(3):475-88.
PUBMED | CROSSREF
34. Volynets V, Küper MA, Strahl S, Maier IB, Spruss A, Wagnerberger S, et al. Nutrition, intestinal permeability, and blood ethanol levels are altered in patients with nonalcoholic fatty liver disease (NAFLD). Dig Dis Sci 2012;57(7):1932-41.
PUBMED | CROSSREF
35. Machado MV, Cortez-Pinto H. Gut microbiota and nonalcoholic fatty liver disease. Ann Hepatol 2012;11(4):440-9.
PUBMED | CROSSREF
36. Leimgruber C, Quintar AA, Sosa LD, García LN, Figueredo M, Maldonado CA. Dedifferentiation of prostate smooth muscle cells in response to bacterial LPS. Prostate 2011;71(10):1097-107.
PUBMED | CROSSREF
37. Yim JY, Kim J, Kim D, Ahmed A. Serum testosterone and non-alcoholic fatty liver disease in men and women in the US. Liver Int 2018;38(11):2051-9.
PUBMED | CROSSREF
38. Herman AP, Krawczyńska A, Bochenek J, Dobek E, Herman A, Tomaszewska-Zaremba D. LPS-induced inflammation potentiates the IL-1β-mediated reduction of LH secretion from the anterior pituitary explants. Clin Dev Immunol 2013;2013:926937.
PUBMED | CROSSREF
39. Bornstein SR, Rutkowski H, Vrezas I. Cytokines and steroidogenesis. Mol Cell Endocrinol 2004;215(1-2):135-41.
PUBMED | CROSSREF
40. Nicholson TM, Ricke WA. Androgens and estrogens in benign prostatic hyperplasia: past, present and future. Differentiation 2011;82(4-5):184-99.
PUBMED | CROSSREF
41. Ho CK, Habib FK. Estrogen and androgen signaling in the pathogenesis of BPH. Nat Rev Urol 2011;8(1):29-41.
PUBMED | CROSSREF
42. La Vignera S, Condorelli RA, Russo GI, Morgia G, Calogero AE. Endocrine control of benign prostatic hyperplasia. Andrology 2016;4(3):404-11.
PUBMED | CROSSREF
43. Roberts RO, Jacobson DJ, Rhodes T, Klee GG, Leiber MM, Jacobsen SJ. Serum sex hormones and measures of benign prostatic hyperplasia. Prostate 2004;61(2):124-31.
PUBMED | CROSSREF
44. Parsons JK, Palazzi-Churas K, Bergstrom J, Barrett-Connor E. Prospective study of serum
dihydrotestosterone and subsequent risk of benign prostatic hyperplasia in community dwelling men: the Rancho Bernardo Study. J Urol 2010;184(3):1040-4.
PUBMED | CROSSREF
45. Hernaez R, Lazo M, Bonekamp S, Kamel I, Brancati FL, Guallar E, et al. Diagnostic accuracy and reliability of ultrasonography for the detection of fatty liver: a meta-analysis. Hepatology 2011;54(3):1082-90.
PUBMED | CROSSREF
46. Korean Association for the Study of the Liver (KASL). KASL clinical practice guidelines: management of nonalcoholic fatty liver disease. Clin Mol Hepatol 2013;19(4):325-48.
PUBMED | CROSSREF