An Ex-post Impact Assessment of the KOR-USA Free Trade Agreement on the Korean Citrus Industry
Bae-Sung Kim1*, Man-Keun Kim2
1Dept. of Applied Economics, SARI at Jeju National University, Research Institute for Subtropical Agriculture and Animal Biotechnology
2Dept. of Applied Economics at Utah State University
한⦁미 FTA 체결 이후 감귤산업 영향 평가
김배성1*, 김만근2
1제주대학교 산업응용경제학과·친환경농업연구소·아열대농업생명과학연구소
2미국 유타주립대학교 응용경제학과
Abstract This study measured the economic impact (from 2012 through the end of 2017) of the KOR-USA FTA (Free Trade Agreement) on the Korean citrus industry according to importing orange from the USA after the implementation of the KOR-USA FTA. Citrus fruits were divided into field citrus grown in open fields, house citrus grown in green houses, and late-maturing citrus (including winter season citrus) based on the cultivation methods and the varieties of citrus. We specified the structural and dynamic recursive demand-supply equilibrium models of three citrus fruits to analyze policy simulations.
The results showed that for field citrus, due to the impact of some amounts of TRQ, the annual average of the real gross revenue dropped by 2.39 billion KRW between 2012 and 2017. As for house citrus, due to the impact of oranges and cherries, the annual average of the real gross revenue declined by 3.01 billion KRW between 2012 and 2017, and for late-maturing citrus (including winter season citrus), the annual average of the real gross revenue fell by 15.11 billion KRW between 2012 and 2017. This paper also suggests several policy implications.
요 약 한미 FTA 체결 이후 미국산 오렌지의 지속적인 수입증가에 따른 국내 감귤산업 파급영향에 대한 관심이 높다.
이 연구는 한미 FTA 발효 이후 2012-2017년 동안의 감귤산업의 변화를 계측하고, 한미 FTA 도입이 감귤산업에 미치 는 사후 영향을 평가하였다. 이 연구는 분석을 위해 감귤류를 노지감귤, 하우스감귤, 만감류 부문으로 구분하고, 각 부문 별 수급균형모형을 구축하여 시뮬레이션 분석에 이용하였다. 각 부문내 주요 방정식들은 응용계량경제학 방법을 이용하 여 추정하고, 각 부문별 수급구조모형은 동태축차적 시뮬레이션모형으로 구축하여 2012-2017년 동안에 대해 연차별로 정책 시뮬레이션이 가능하도록 하였다. 각 모형은 작물연도를 기준으로 구축되었고, 해당 시기에 수입되는 오렌지, 체리 등에 수입산 대체가능 작물에 대한 효과를 고려할 수 있도록 설계되었다. 시뮬레이션 분석에 앞서 각 부문별 모형에 대한 예측력을 RMSPE, MAPE, Theil의 불균등계수 등을 기준으로 검토하였다. MAPE 기준으로 노지감귤, 하우스감귤, 만감류의 재배면적 1-7%, 생산량 5-9%, 소비량 5-10%, 경락가격 5-10% 내외의 오차율을 보여, 각 부문별 모형의 주요 변수에 대한 추정치들의 예측력이 전반적으로 양호한 수준으로 나타났다. 예측력 검토결과를 바탕으로 시뮬레이션 분석 을 실시한 결과, 한미 FTA 발효 이후 2012-2017년 연평균 조수입(실질)이 노지감귤 23.9억 원, 하우스감귤 30.1억 원, 만감류 151.1억 원 감소한 것으로 나타났다. 또한 이 논문은 기존에 2018년 정부부문(KREI)에서 실시한 영향평가 방법 및 결과의 차이점을 비교 검토하고 해석시 유의사항 및 정책적 함의를 제안하고 있다.
Keywords : KOR-USA Free Trade Agreement, Korean Citrus, Economic Impacts, Demand-Supply Model, Partial Equilibrium, Policy Simulation, Ex-Post Assessment.
This work was supported by the research grant of Jeju National University in 2019.
*Corresponding Author : Bae-Sung Kim(Jeju National Univ.) email: [email protected]
Received February 13, 2020 Revised March 5, 2020 Accepted April 3, 2020 Published April 30, 2020
1. Introduction
Citrus fruits are divided into field citrus grown in open fields, house citrus grown in a green house, and late-maturing citrus(including winter season citrus) based on cultivation methods and varieties in Korea. Field citrus is usually produced from October to January of the following year, house citrus from May to September of the same year, and late-maturing citrus (including winter season citrus) from February to April of the same year. The amounts of the fruits, which are imported during the harvest season of citrus fruits, such as U.S.
oranges and cherries, are taken into account based on the stated time periods for the analysis[1,2,3,4].
We developed the demand-supply structural models for the ex-post impact assessment of the Korea-U.S. FTA on the citrus industry. The models was designed as a partial equilibrium model with regard to the cultivation method and the variety (or the variety group) of each type of citrus fruit. Given that citrus fruits grown domestically have a little correlation with other industries within the economy and a low importance in the global market and considering the data accessibility, it makes more sense to use a partial equilibrium model than a general equilibrium model. In addition, the models are established in the form of a dynamic recursive simulation model in order to make it possible to grasp the effects of the variables such as tariffs and policies by year[7]. Considering the cultivation method and the time of production of each type of citrus fruit, the models have been developed based on crop years[4, 5, 6].
The analysis was conducted to find out the ex-post impact assessment of the Korea-U.S. FTA (2012-2017)[4,7,8]. Korean government(Ministry of Trade, Industry and Energy) presented the assessment report of implementation of the Korea-U.S. FTA including citrus fruit in 2018[15],
however, the results might not be correct measurements because citrus was not divided based on cultivation methods and varieties. This study considered characteristics of this kind citrus fruits. This work was carried out to compensate based on the research report[4].
2. Market Structure of Change in Tariffs
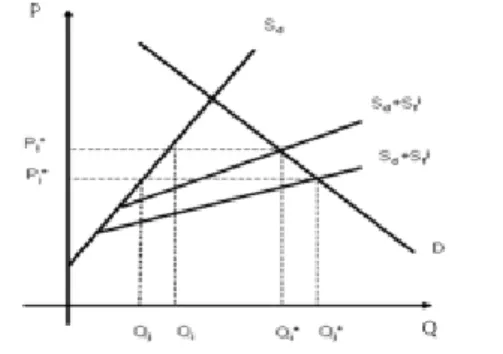
The graph illustrates the change in the supply structure of the domestic market after the FTA.
and , as horizontal sum of supply of both domestic and imported goods, indicate the total supply under the tariff rate and , which is a downward adjustment of the tariff rate. shows the market equilibrium price and trading volume under the tariff rate . Domestic supply at the equilibrium price of equals which corresponds to the domestic supply curve . At this point, the income of producers equals [4,9,10].
Fig. 1. Supply Change after FTA
Import volume becomes , which corresponds to the difference between market demand and domestic supply. When a tariff rate is adjusted downward or eliminated ( ), market equilibrium becomes . At this point, domestic supply equals , which is the point corresponding to that on at the equilibrium price , and producer’s revenue
equals , and the import volume becomes
. When a tariff rate is adjusted downward or eliminated, the equilibrium price and the changes between domestic supply and demand are affected by the change in tariffs and the slopes of the demand curve and the supply curve.
By utilizing the dynamic recursive simulation model, this study measures how the supply and demand situation by year during a specific period of time changes after the opening[3,4,11,12,13,14].
3. Estimation Results of Major Equations
The individual equations within the simultaneous equation models use relevant data and consider various types of functions for estimation. Among them, a final equation is selected after considering the explanation ability of each equation, the significance of each regression coefficient, the prediction accuracy of the results from the ex-post simulation, related policies, and the outlook and opinions of on-site specialists[2,3,4].
The estimation method makes use of the ordinary least squares, which is an estimation technique of an individual equation[3,4].
Final estimations are as follows: what is inside ( ) indicates t-value, D-W indicates the Durbin-Watson statistic, and AR(1) indicates the first autocorrelation coefficient.
<Field Citrus Model>
□ Acreage for Field Citrus (1,000 ha) LOG(FLD_ACR) =
- 0.05251558278 – 0.05081329187*LOG(INPUTP/GDPDEF) (-0.199706) (-0.572085)
+ 0.0136623436*LOG(FLD_NFP(-1)/GDPDEF(-1)) (0.553478)
+ 0.08063993777*LOG(FLD_NFP(-2)/GDPDEF(-2)) (3.715929)
+ 0.01751814089*LOG(FLD_NFP(-3)/GDPDEF(-3)) (0.761719)
+ 0.9343946856*LOG(FLD_ACR(-1)) (10.81029)
R2: 0.932, D-W: 2.290, SAMPLE: 1992-2017
Note, FLD_ACR: Acreage for field citrus, INPUTP: Input price FLD_NFP: Field citrus price received by farmers GDPDEF: GDP deflator
□ Field Citrus Price Flexibility Function (KRW/kg) LOG(FLD_NCP/GDPDEF) =
+ 3.875846514 – 0.8532081062*LOG(FLD_PERD) (3.021307) (-2.853111)
+ 0.2113152897*LOG(FLD_FP_USORG/GDPDEF) (0.782698)
- 0.2589338623*DM_FLD_NCP(‘02, ‘12, ‘15) (-2.063564)
R2: 0.528, D-W: 1.687, SAMPLE: 1997-2016
Note, FLD_NCP: Field citrus auction price at a wholesale market FLD_PERD: Per capita field citrus consumption FLD_FP_USORG: U.S. orange price
GDPDEF: GDP deflator DM_FLD_NCP: Dummy variable
□ Field Citrus Price Received by Farmers (KRW/kg) LOG(FLD_NFP) =
- 1.108104692 + 1.074174229*LOG(FLD_NCP) (-1.279030) (8.806399)
R2: 0.787, D-W: 2.106, SAMPLE: 1995-2017
Note, FLD_NCP: Field citrus auction price at a wholesale market GDPDEF: GDP deflator
□ U.S. Orange Import Volume (1,000 tons, during the field citrus season)
LOG(FLD_IMQ_USORG) =
+ 15.63016835 – 2.69777941*LOG(FLD_FP_USORG/GDPDEF) (8.714479) (-5.333644)
+ 0.8954820297*LOG(FLD_NCP/GDPDEF) (2.155577)
- 0.841821664*DM_FLD_IMQ_USORG(‘08, ‘11, ‘14, ‘17) (-4.885936)
R2: 0.894, D-W: 1.707, SAMPLE: 2006-2017 Note, FLD_IMQ_USORG: U.S. orange import volume FLD_FP_USORG: U.S. orange price
FLD_NCP: Field citrus auction price at a wholesale market DM_FLD_IMQ_USORG: Dummy variable
<House Citrus Model>
□ Acreage for House Citrus (ha) LOG(HUS_ACR) =
+ 1.213724535 – 0.2870672346*LOG(HETP(-1)/GDPDEF(-1)) (2.381335) (-4.977958)
+ 0.09023462402*LOG(HUS_NFP(-1)/GDPDEF(-1)) (0.707403)
+ 0.08856491803*LOG(HUS_NFP(-2)/GDPDEF(-2)) (0.752889)
+ 0.03530105346*LOG(HUS_NFP(-3)/GDPDEF(-3)) (0.332404)
+ 0.6554901044*LOG(HUS_ACR(-1)) (17.28227)
+ 0.3697341453*DM_HUS_ACR(‘99) (5.098449)
R2: 0.976, D-W: 2.676 SAMPLE: 1992-2017 Note, HUS_ACR: Acreage for house citrus HETP: Farm light and heat expenses
HUS_NFP: House citrus price received by farmers GDPDEF: GDP deflator
DM_HUS_ACR: Dummy variable
□ House Citrus Price Flexibility Function (KRW/kg) LOG(HUS_NCP/GDPDEF) =
- 7.555648491 – 0.5235978859*LOG(HUS_PERD) (-0.733861) (-1.932596)
- 0.009465082495*LOG(HUS_PERD_CRY) (-0.181689)
+ 0.2137043681*LOG(HUS_FP_USORG/GDPDEF) (0.855615)
+ 1.144115451*LOG(PNDINC/GDPDEF) (1.472388)
- 0.1278435475*DM_HUS_NCP1(‘06, ‘14-‘16) (-2.865968)
R2: 0.860, D-W: 2.549, SAMPLE: 2006-2016
Note, HUS_NCP: House citrus ex-farm price to Nonghyup stores HUS_PERD: Per capita house citrus consumption HUS_PERD_CRY: Per capita U.S. cherry consumption HUS_FP_USORG: U.S. orange price
PNDINC: Per capita national disposable income GDPDEF: GDP deflator
DM_HUS_NCP1: Dummy variable
□ House Citrus Price Received by Farmers (KRW/kg) LOG(HUS_NFP) =
+ 2.4788918 + 0.666999722*LOG(HUS_NCP) (5.655904) (12.67006)
- 0.1477668144*DM_HUS_NFP(‘12, ‘14, ‘15) (-4.680190)
R2: 0.915, D-W: 1.780, SAMPLE: 2000-2017
Note, HUS_NFP: House citrus price received by farmers HUS_NCP: House citrus ex-farm price to Nonghyup stores DM_HUS_NFP: Dummy variable
□ U.S. Cherry Import Volume (ton) LOG(HUS_IMQ_USCRY) =
+ 14.42169843 – 1.509311809*LOG(HUS_FP_USCRY/GDPDEF) (2.485392) (-2.964901)
+ 0.8729380066*LOG(HUS_NCP/GDPDEF) (0.840545)
+ 0.05253331337*DM_HIMQ_USCRY(‘03, ‘09, ‘15) (0.426553)
+ [AR(1)=0.9042680356]
(17.65874)
R2: 0.972, D-W: 2.030, SAMPLE: 2001-2017 Note, HUS_IMQ_USCRY: U.S. cherry import volume HUS_FP_USCRY: U.S. cherry price
HUS_NCP: House citrus ex-farm price to Nonghyup stores GDPDEF: GDP deflator
DM_HIMQ_USCRY: Dummy variable
□ U.S. Orange Import Volume (ton, during the house season) LOG(HUS_IMQ_USORG) =
+ 5.86696595 – 1.225385326*LOG(HUS_FP_USORG/GDPDEF) (0.758691) (-1.833941)
+ 1.136017784*LOG(HUS_NCP/GDPDEF) (0.733332)
+ 0.5157922438*DM_HUS_IMQ_USORG(‘11, ‘12) (2.880346)
+ [AR(1)=-0.5036124919]
(-2.431529)
R2: 0.840, D-W: 2.335, SAMPLE: 2007-2017 Note, HUS_IMQ_USORG: U.S. orange import volume HUS_FP_USORG: U.S. orange price
HUS_NCP: House citrus ex-farm price to Nonghyup stores GDPDEF: GDP deflator
DM_HUS_IMQ_USORG: Dummy variable
<Late-maturing Citrus(Including Winter Citrus) Model>
□ Acreage for Late-maturing Citrus (ha) LOG(HAN_ACR) =
- 0.2086 + 0.1011*LOG(HAN_NFP(-1)/GDPDEF(-1)) (-1.0657) (4.4011)
+ 0.04174540536*LOG(HAN_NFP(-2)/GDPDEF(-2)) (1.783372)
+ 0.9733241244*LOG(HAN_ACR(-1)) (54.19845)
R2: 0.998, D-W: 1.569, SAMPLE: 2008-2016 Note, HAN_ACR: Acreage for late-maturing citrus HAN_NFP: Hallabong price received by farmers GDPDEF: GDP deflator
□ Late-maturing Citrus Price Flexibility Function (KRW/kg) LOG(HAN_NCP/GDPDEF) =
+ 3.347582197 – 0.2904476036*LOG(HAN_PERD) (9.098538) (-3.098203)
+ 0.2353168019*LOG(HAN_FP_USORG/GDPDEF) (2.006174)
+ 0.2358864356*DM_HAN_NCP(‘11, ‘13, ‘16) (3.151048)
R2: 0.680, D-W: 1.405, SAMPLE: 2005-2016
Note, HAN_NCP: Hallabong auction price at a wholesale market HAN_PERD: Per capita house late-maturing citrus consumption HAN_FP_USORG: U.S. orange price
GDPDEF: GDP deflator DM_HAN_NCP: Dummy variable
□ Late-maturing Citrus Price Received by Farmers (KRW/kg) LOG(HAN_NFP) =
+ 1.336674464 + 0.7643981113*LOG(HAN_NCP) (1.637748) (7.950570)
R2: 0.798, D-W: 1.918, SAMPLE: 1999-2016 Note, HAN_NFP: Hallabong price received by farmers HAN_NCP: Hallabong auction price at a wholesale market
□ U.S. Orange Import Volume
(1,000 tons, during the late-maturing citrus season)
LOG(HAN_IMQ_USORG) =
+ 5.4012 – 0.8487*LOG(HAN_FP_USORG/GDPDEF) (3.9027) (-4.0434)
+ 0.4466596868*LOG(HAN_NCP/GDPDEF) (1.289091)
+ 0.3025937012*DM_HAN_IMQ_USORG(‘08) (2.623182)
+ [AR(1)=0.7116610965]
(2.303032)
R2: 0.787, D-W: 1.573, SAMPLE: 2006-2017 Note, HAN_IMQ_USORG: U.S. orange import volume HAN_FP_USORG: U.S. orange price
HAN_NCP: Hallabong auction price at a wholesale market GDPDEF: GDP deflator
DM_HAN_IMQ_USORG: Dummy variable
4. Accuracy Verification of the Models
To test the prediction accuracy of the medium- to long-term measured values drawn from the models, a comparison between measured values from the model and experimental values during the out-of-sample period(2013-2016) is conducted. As criteria for prediction accuracy, the RMSPE (Root Mean Percent Error), the MAPE (Mean Absolute Percent Error), and Theil’s inequality coefficient are used.
Cropping
Pattern Acreage Output Consumption Auction Price Field
Citrus 4.31 9.00 10.89 10.33
House
Citrus 7.63 6.40 6.41 5.27
Late-maturing
Citrus 1.73 5.49 5.45 10.13
Table 1. Verification of Prediction Accuracy(MAPE) (Verification period: 2013-2016)
As a result of the prediction accuracy of the impact measurement model, based on the MAPE, a satisfactory prediction accuracy is displayed in acreage and quantity per unit area with acreage for field citrus of 4.31%, output of 9%, consumption of 10.89%, and auction price of 10.33%. In addition, a relatively satisfactory prediction accuracy is exhibited in the consumption, and the auction price[3,4].
As for the house citrus model, a very satisfactory prediction accuracy is displayed with acreage of 7.63%, output of 6.40%, consumption of 6.41%, and auction price of 5.27%. This is thought to be the results of the constant pattern of supply and demand quantity and prices as the quality of house citrus does not vary much from year to year. With respect to the late-maturing citrus (including winter season citrus) model, a very satisfactory prediction accuracy is displayed in acreage and quantity per unit area with acreage of 1.73%, output of 5.49%, consumption of 5.45%, and auction price of 10.13%. However, the prices received by farmers appear to be somewhat less predictable[2,3,4].
5. Ex-Post Impact Assessment
As illustrated in the tables from Table 2 to Table 4, the results of the ex-post impact assessment from 2012 to 2017 after the Korea-U.S. “After FTA” is the results after the application of FTA and “Before FTA” is appeared the results by not-application of FTA. Both results are produced by simulation of tariffs using the partial equilibrium model of each citrus.
Category Acreage Output Price received by farmers
(real)
Import volume of U.S.
oranges
Gross Revenue (real) 000ha 000 MT KRW/kg MT Hundred M
KRW
After FTA
2012 17.39 558.97 793.4 12,027.4 4,434.7 2013 17.17 554.17 917.9 7,061.7 5,086.6 2014 16.94 573.41 575.4 4,320.0 3,299.4 2015 16.78 519.4 528.1 6,624.6 2,743.2 2016 16.61 466.82 968.7 9,422.9 4,522.1 2017 15.01 463.06 946.9 1,968.4 4,384.6 Before
FTA
2012 17.39 558.97 796.7 11,313.2 4,453.2(-18.5) 2013 17.17 554.20 922.7 6,542.2 5,113.4(-26.8) 2014 16.95 573.67 580.1 4,113.0 3,328.1(-28.6) 2015 16.80 519.94 531.3 6,182.8 2,762.3(-19.2) 2016 16.64 467.65 972.4 8,872.7 4,547.3(-25.2) 2017 15.04 464.20 950.0 1,790.8 4,409.8(-25.2) Table 2. Results of Ex-post Impact Assessment of
Field Citrus
Note: The numbers in ( ) indicate the gross revenue differences between before and after FTA is applied.
Category
Acreage Output Import volume of
cherries
Import volume of U.S. oranges
Gross Revenue
(real)
ha 000
MT MT MT Hundred M
KRW
After FTA
2012 285.0 20.0 9,325.0 1,228.9 640.6
2013 262.0 19.6 8,935.5 749.3 752.4
2014 255.0 21.6 13,079.9 883.8 583.1
2015 250.0 20.4 12,075.7 635.1 591.1
2016 284.0 21.7 12,387.5 800.1 700.7
2017 301.0 22.6 16,021.9 908.9 810.9
Before FTA
2012 285.0 20.0 8,737.1 1,052.4 653.5
(-13.0)
2013 262.5 19.6 7,220.9 604.3 772.9
(-20.6)
2014 256.4 21.7 10,129.5 750.0 606.1
(-23.0)
2015 252.4 20.6 8,217.9 485.1 620.3
(-29.1)
2016 287.8 22.0 6,038.2 586.4 742.7
(-42.0)
2017 306.6 23.1 7,028.1 639.4 863.6
(-52.7) Table 3. Results of Ex-post Impact Assessment of House
Citrus
FTA came into effect show that field citrus was not affected by seasonal orange tariffs during this season[3, 4], however, due to the impact of some TRQ amounts, the annual average of the real net income dropped by 2.39 billion KRW between 2012 and 2017. As for house citrus, due to the impact of oranges and cherries, the annual average of the real net income declined by 3.01 billion KRW between 2012 and 2017[3,4]. For late-maturing citrus (including winter season citrus), the annual average of the real net income fell by 15.11 billion KRW between 2012 and 2017. The results of the ex-post impact assessment from 2012 to 2017 after the Korea-U.S. FTA took effect show that taking field citrus, house citrus, and late-maturing citrus (including winter season citrus) together, the annual average of the real net income fell by 20.51 billion KRW between 2012 and 2017[3,4].
Category Acreage Output Price received by
farmers (real)
Import volume of U.S.
oranges
Gross Revenue
(real)
ha ton KRW/kg ton Hundred M
KRW
After FTA
2012 2,920.6 89,705.0 3,047.8 150.1 2,734.0 2013 3,150.0 98,705.0 2,909.2 130.8 2,871.5 2014 3,359.0 101,750.0 2,516.8 81.1 2,560.9 2015 3,498.0 95,388.0 2,427.8 95.3 2,315.8 2016 3,597.3 111,165.0 2,848.1 133.8 3,166.1 2017 3,696.7 113,251.6 2,864.3 118.1 3,243.8
Before FTA
2012 2,920.6 89,705.0 3,112.6 141.5 2,792.2 (-58.2) 2013 3,156.7 98,915.7 3,003.1 117.8 2,970.6 (-99.1) 2014 3,379.7 102,377.1 2,612.1 68.6 2,674.2 (-113.3) 2015 3,537.0 96,450.6 2,542.9 80.0 2,452.7 (-136.9) 2016 3,659.2 113,078.9 2,994.2 110.0 3,385.8 (-219.7) 2017 3,786.50 116,005.2 3,037.0 96.5 3,523.1 (-279.3) Table 4. Results of Ex-post Impact Assessment of Late-
maturing Citrus (Including Winter Season Citrus)
6. Conclusion
According to the results of previous and ex-post impact assessments, which were conducted in advance, the Korea Rural Economic Institute (KREI) (2011) determined through analysis that the annual average of the real net income decreased by 46.1 billion KRW between 2012 and 2016 while the same institute (2017) reported that the annual average of the real net income fell by 6.5 billion KRW between 2012 and 2016, displaying a significant difference[3,4,5,7,15].
In particular, there was an argument that the reason why relatively large losses, shown by the previous impact assessment results carried out by the KREI (2011), was because positive macroeconomic conditions (high economic growth and inflation rate and low exchange rate), which were assumed at that time, and the effects of the Korea-Chile, Korea-ASEAN, and Korea-EU FTAs were reflected, but the trade diversion effects and the trade creation effects of the Korea-Turkey (2013), Korea-Australia (2014),
Korea-New Zealand (2015), Korea-China (2016), Korea-Vietnam (2015), and Korea-Colombia (2016) FTAs, which were concluded afterwards, were not reflected (the KREI, 2017)[4,15] .
In the current situation where mandarin based citrus fruits are not imported, such a difference, shown above, in the impact assessment results can vary depending on whether the changes in the economic environment (economic growth, inflation, exchange rate, international oil price, import price, etc) are applied to the analysis, whether the cultivation methods and varieties (field citrus, house citrus, and late-maturing citrus) are classified, whether the recent measurements are reflected, and whether the effects of competing fruits, including not only U.S. oranges but also cherries, are considered.
Especially, given that there is a big difference in the supply and demand volumes and prices depending on the cultivation method and the variety of a citrus fruit, it is believed that the distinction between them may be a major factor that shows the difference in results.
Although the pre- and ex-post impact assessment analyses use the same economic application, results can differ since different assumptions and different coefficients might be employed based on the data available at the time of analysis and the economic environment. It is necessary for readers, including policy-makers, to first understand the differences in the assumptions applied and select more realistic cases, rather than criticizing the differences in these assessment results[3, 4, 5, 15].
References
[1] S. B. Ko, B. S. Kim, “A Study on the Model Specification for Supply-Demand Forecast of Hallabong Tangor in Korea”, Journal of the Korea Academia-Industrial Cooperation Society, Vol. 13 No.
11, pp. 5,163-5,168, 2012.
DOI: https://doi.org/10.5762/KAIS.2012.13.11.5163 [2] S. B. Ko, B. S. Kim, “An Analysis on Impact of Jeju
Field Citrus Industry by FTA between Korea and China”, Journal of the Korea Academia-Technology Society, Vol. 15 No. 2, pp. 838-844, 2014.
DOI: https://doi.org/10.5762/KAIS.2014.15.2.838 [3] S. B. Ko, B. S. Kim, K. S. Kim, D. H. Ahn, T. H. Kim,
M. S. Kim, Medium- to Long-term Supply and Demand Prospects for Tangerines Grown in Open Fields, Jeju Special Self-Governing Province, Jeju National University, 2015.
[4] S. B. Ko, B. S. Kim, T. R. Kim, D. W. Kim, Economic Impact Analysis on Jeju Citrus according to the Tariff Change by Korea-USA FTA, Jeju Special Self-Governing Province, Jeju National University, 2018. 7. Available From:
http://www.prism.go.kr/homepage/theme/retrieveThe meDetail.do;jsessionid=5E67C325F610A994F652438A7 029F862.node02?cond_brm_super_id=NB00012006120 1100016465&leftMenuLevel=110&research_id=650000 0-201800018
[5] S. H. Ko, T. S. Wi, “A Study on the Actual Use and Effective Utilization of Non-destructive Citrus Graders”, Journal of Korean Food Marketing Association, Vol.
30, No. 2, pp. 1-19, 2013. Available From:
http://uci.kci.go.kr/resolution/result.do?res_cd=G704- 001503.2013.30.2.002&res_svc_cd
[6] B. S. Kim, S. B. Ko, T. W. Moon, M. S. Kim, An Analysis of the Current Situation of Citrus Processing, Storage, and Distribution, Korea Rural Economic Institute, 2016.
[7] B. S. Kim, S. B. Ko, T. R. Kim, J. S. Yang, A Study on the Stabilization of Citrus Supply and Demand and the Development Measures, Korea Rural Economic Institute, 2017.
[8] B. S. Kim, “Measurement of Maximum Social Welfare Effects of Fruit Observation”, Journal of the Korea Academia-Industrial Cooperation Society, Vol. 15 No.
11. pp. 6,646-6,651, 2014.
DOI: https://doi.org/10.5762/KAIS.2014.15.11.6646 [9] B. S. Kim, B. H. Ko, “A Study on the Development of
Supply-Demand Outlook Model for Jeju Winter Radish”, Journal of the Korea Academia-Industrial Cooperation Society, Vol. 15 No. 3, pp. 1,471-1,477, 2014.
DOI: https://doi.org/10.5762/KAIS.2014.15.3.1471 [10] B. R. Kim, S. H. Chae, J. W. Kang, Y. D. Kwon, T. M.
Seok, C. W. Jo, M. S. Lee, S. J. Kang, M. Y. Kang, J. M.
Woo, Measures to Enhance the Competitiveness of Agricultural Industry of Each Region in Response to the FTA, Korea Rural Economic Institute, 2013.
[11] National Agricultural Cooperative Federation Jeju Branch, Jeju Citrus Federation, An Analysis of the Actual Conditions of Citrus Distribution Process, Each Year.
[12] Jeju Special Self-Governing Province, Citrus Marketing and Shipping Association, Citrus Distribution Processing Analysis, Each Year.
[13] Jeju Special Self-Governing Province, Current Status
of Agricultural and Livestock Products, Each Year.
[14] Statistics Korea, General Survey of Agriculture, Forestry and Fisheries, Each Year.
[15] Ministry of Trade, Industry and Energy, The Assessment Report of Implementation of the Korea-U.S. FTA, 2018. 4.
Bae-Sung Kim [Life member]
• Jun. 1999 : Korea Univ., Agricultural Economics, PhD
• Jul. 1999 ∼ Mar. 2003 : Korea Research Institute of Bioscience and Biotechnology, Post-Doc. Researcher, Senior Researcher
• Mar. 2003 ∼ Feb. 2012 : Korea Rural Economic Institute, Research Fellow
• Mar. 2012 ∼ Present : Jeju National Univ., Dept. of Applied Economics, Professor
<Research Interests>
Agricultural Economics, Theory of Agricultural Product Price, Regional economics, Production Economics, etc.
Man-Keun Kim [Regular member]
• May 2004 : Texas A&M Univ., Agricultural Economics, PhD
• Jul. 2004 ∼ Jun. 2007 : Joint Global Change Research Institute, Pacific Northwest National Lab, Economist
• Jul. 2007 ∼ Jul. 2010 : Univ. of Nevada, Reno, Dept. of Resource Economics, Research Assistant Professor
• Aug. 2010 ∼ Present : Utah State Univ., Dept. of Applied Economics, Professor
<Research Interests>
Regional Economics, Resource & Environmental economics, Agricultural policy, etc.