Chronic Kidney Disease-Mineral Bone Disorder in Korean
Patients: a Report from the KoreaN Cohort Study for Outcomes in Patients With Chronic Kidney Disease (KNOW-CKD)
This study examined the characteristics of biochemical parameters, bone diseases, and vascular calcification in Korean patients with chronic kidney disease (CKD) not yet on dialysis. Serum levels of fibroblast growth factor 23 (FGF23), intact parathyroid hormone (iPTH), 25-hydroxyvitamin D3 (25D), and 1,25-dihydroxyvitamin D3 (1,25D); lumbar spine, total hip, and femur neck bone mineral densities; and brachial-to-ankle pulse wave velocity (baPWV) representing vascular calcification were measured at baseline for 2,238 CKD patients in the KoreaN Cohort Study for Outcomes in Patients With CKD (KNOW-CKD).
Increases in serum FGF23 and iPTH preceded changes in serum calcium and phosphate, similar to Western populations. However, the 25D and 1,25D levels decreased earlier than serum FGF23 or iPTH increased, with a decreased estimated glomerular filtration rate (eGFR) in Korean CKD patients. Vitamin D deficiency occurred in 76.7% of patients with CKD stage 1. Bone mineral densities were lowest in CKD stage 5 (lumbar spine,
−0.64 ± 1.67; total hip, −0.49 ± 1.21; femur neck, −1.02 ± 1.25). Osteoporosis was more prevalent in patients with higher CKD stages. The mean baPWV, abdominal aortic calcification (AAC), and coronary calcium score also increased, with declined eGFR. In conclusion, a decline in serum vitamin D levels was observed in early CKD stages before significant increases of FGF23 and iPTH in the Korean CKD population compared with that in Western populations. Increased bone disease and vascular calcification occurred in early- stage CKD.
Keywords: Chronic Kidney Disease; Bone Diseases; Vascular Calcification; Korean Chang Seong Kim,1 Eun Hui Bae,1
Seong Kwon Ma,1 Seung Hyeok Han,2 Kyu-Beck Lee,3 Joongyub Lee,4 Kook-Hwan Oh,5 Dong Wan Chae,6 Soo Wan Kim,1 and Representatives of the KNOW-CKD Study Group
1Department of Internal Medicine, Chonnam National University Medical School, Gwangju, Korea; 2Depatment of Internal Medicine, Yonsei University College of Medicine, Seoul, Korea;
3Division of Nephrology, Kangbuk Samsung Hospital, Sungkyunkwan University School of Medicine, Seoul, Korea; 4Medical Research Collaborating Center, Seoul National University Hospital and Seoul National University College of Medicine, Seoul, Korea; 5Department of Internal Medicine, Seoul National University Hospital, Seoul, Korea;
6Department of Internal Medicine, Seoul National University Bundang Hospital, Seoul, Korea Received: 14 September 2016
Accepted: 14 November 2016 Address for Correspondence:
Soo Wan Kim, MD
Department of Internal Medicine, Chonnam National University Medical School, 42 Jebong-ro, Dong-gu, Gwangju 61469, Republic of Korea
E-mail: [email protected]
Funding: This study was supported by the Research Program funded by the Korea Center for Disease Control and Prevention (2011E3300300, 2012E3301100, 2013E3301600,
2013E3301601, 2013E3301602, and 2016E3300200); the National Research Foundation of Korea (NRF), funded by the Ministry of Science, ICT and Future Planning
(2015R1C1A1A01051769); the Basic Science Research Program through the NRF, funded by the Ministry of Science, ICT and Future Planning (2016R1A2B4007870); a grant from the Korea Health Technology R&D Project through the Korea Health Industry Development Institute (KHIDI), funded by the Ministry of Health and Welfare, the Republic of Korea (grant number:
HI14C2084); and by a grant (CRI13033-1) from Chonnam National University Hospital Institute for Biomedical Science.
https://doi.org/10.3346/jkms.2017.32.2.240 • J Korean Med Sci 2017; 32: 240-248
INTRODUCTION
Chronic kidney disease-mineral and bone disorder (CKD-MBD) is defined as a sys- temic disorder of mineral and bone metabolism accompanying the decline of kidney function, and is characterized by biochemical abnormalities in mineral metabolism, abnormalities in skeletal remodeling, and extraskeletal calcification (1). Recent studies have shown that there are associations between CKD-MBD and an increased risk of cardiovascular disease and fractures, and even high mortality rates (2-4). Therefore, the Kidney Disease: Improving Global Outcomes (KDIGO) guidelines recommend monitoring laboratory abnormalities in the serum levels of calcium, phosphorus, para- thyroid hormone (PTH), alkaline phosphatase activity, and 25-hydroxyvitamin D (cal- cidiol), which are the hallmarks of established CKD-MBD, beginning in CKD stage 3 (1,5). Moreover, emerging data indicate that CKD-MBD begins early in the low end of the estimated glomerular filtration rate (eGFR) in CKD stage 2 (6). Increased fibroblast growth factor 23 (FGF23) is a common manifestation of CKD that develops earlier than increased phosphate or PTH (7). Experimental studies showed that klotho decline may precede both hyperphosphatemia and increased FGF23 (8,9).
Several studies have shown ethnic differences in the regulation of mineral and bone metabolism in patients with CKD. Black patients had less hyperphosphatemia, lower levels of serum calcium and FGF23, and higher PTH concentration compared with Nephrology
white patients undergoing hemodialysis (10,11). However, there are limited data regarding the ethnic differences in mineral and bone metabolism and vascular calcification between Asian and non-Asian patients with CKD. In a previous study of 58 Korean predialysis patients who underwent bone biopsies, the distri- bution of types of renal osteodystrophy was different from that of patients from Western countries, suggesting possible ethnic differences between Asian and white people (12).
Therefore, we examined the abnormalities of biochemical parameters in mineral metabolism and bone parameters, and vascular calcification rates in Korean patients with CKD not yet on dialysis, based on a patient-based cohort study that enrolled ethnic Korean adults with any stage of CKD. This study may in- crease our understanding of CKD-MBD in Korean patients with regard to ethnic differences.
MATERIALS AND METHODS Study design and patient population
The KoreaN Cohort Study for Outcomes in Patients With Chron- ic Kidney Disease (KNOW-CKD) was launched in 2011. Details on the design, methods, and exclusion criteria of the KNOW-CKD were published previously (13). KNOW-CKD is supervised by a CKD advisory committee that is comprised of individuals from the Korea Centers for Disease Control and Prevention and the Korean Society of Nephrology (13).
We analyzed baseline data recorded between June 2011 and February 2016 for 2,238 KNOW-CKD participants in order to characterize the biochemical parameters of CKD-MBD, describe the prevalence of osteoporosis, and evaluate vascular calcifica- tion in relation to CKD stages or primary renal disease.
Data collection and definitions
Baseline demographics and laboratory data were retrieved from the electronic data management system of the Seoul National University Medical Research Collaborating Center (PhactaX;
Seoul National University Hospital, Seoul, Korea) with the as- sistance of the Division of Data Management. Anthropometric measurements including height and weight were conducted at the clinic. Serum samples were collected at baseline according to our standardized protocol and sent to a central laboratory (Lab Genomics, Seongnam, Korea) for measurement of creati- nine, intact parathyroid hormone (iPTH), 25-hydroxyvitamin D3 (25D), and 1,25-dihydroxyvitamin D3 (1,25D). Other labo- ratory data were analyzed at the hospital laboratory of each par- ticipating center. Serum creatinine concentration was measured using an assay traceable to the international reference material.
The definition of CKD stages 1–5 was based on the eGFR, which was calculated using the four-variable Modification of Diet in Renal Disease (MDRD) formula (14). We further refined stage 3 as eGFR of 45 to 59 mL/min/1.73 m2 (stage 3a) and eGFR of 30
to 44 mL/min/1.73 m2 (stage 3b), according to the 2012 KDIGO Clinical Practice Guideline for the Evaluation and Management of CKD (15). Serum FGF23 (Immutopics International, San Cle- mente, CA, USA) was measured in the central laboratory (Lab Genomics) with an enzyme-linked immunosorbent assay kit.
Samples were assayed in duplicate, and all results were report- ed as mean values. Detailed protocols for the measurement of other laboratory parameters were previously described (13).
Our study defined serum 25D levels < 20 ng/mL as vitamin D deficient, 20 to 29.9 ng/mL as insufficient, 30 to 100 ng/mL as normal, and > 100 ng/mL as excess (16).
Bone mineral density (BMD) was estimated using a Hologic dual-energy X-ray absorptiometry (DXA) system. BMD was mea- sured for the lumbar spine (L1–L4), total hip, and femoral neck at baseline. Results were expressed as the T-score (standard de- viation [SD] from the average BMD value of young normal sub- jects). Osteoporosis was defined using the World Health Orga- nization’s T-score criteria, which states that for positive diagno- sis, DXA scores must be 2.5 or more SDs below the sex-specific healthy young adult average. Osteopenia was defined as T-scores of −1.0 to −2.4, and T-scores > −1.0 were defined as normal (17).
Measurement of pulse wave velocity
A volume plethysmography apparatus (VP-1000; Collin Co., Ko- maki, Japan) (18) was used to automatically determine brachi- al-to-ankle pulse wave velocity (baPWV), using the oscillomet- ric method. Patients with cuffs around both arms and ankles rested for at least 5 minutes in the supine position before mea- surement. Pulse waves obtained simultaneously from the bra- chial and tibial arteries were recorded. baPWV was calculated as transmission distance (distance from each arm to each ankle according to height) divided by transmission time (interval be- tween initial increases in the brachial and tibial wave forms).
We used baPWV (the mean of the right side and left side values) as a marker of both central and peripheral arterial stiffness.
Statistical analysis
The demographic characteristics and biochemical parameters were evaluated using the one-way analysis of variance or the Kruskal-Wallis test, and the Pearson χ2 test for continuous vari- ables and categorical variables, respectively. Parametric vari- ables were expressed as mean ± SD, and nonparametric vari- ables were expressed as medians with interquartile (25th and 75th percentiles) ranges for continuous variables. Categorical variables are presented as the number and percentage of pa- tients. Pearson’s test was used to evaluate the relationship be- tween biochemical parameters and normally distributed uni- variate variables; Spearman’s test was used if the distribution was not normal. All statistical tests were two-tailed, and P < 0.05 was considered significant.
Ethics statement
The study protocol was approved by the Institutional Review Boards (IRB) of the institutional and national research commit- tee at which the studies were conducted (IRB approval number NCT01630486) and was in accordance with the 1964 Helsinki declaration and its later amendments or comparable ethical standards. All participating patients provided written informed consent.
RESULTS
Mineral metabolism in relation to CKD stages
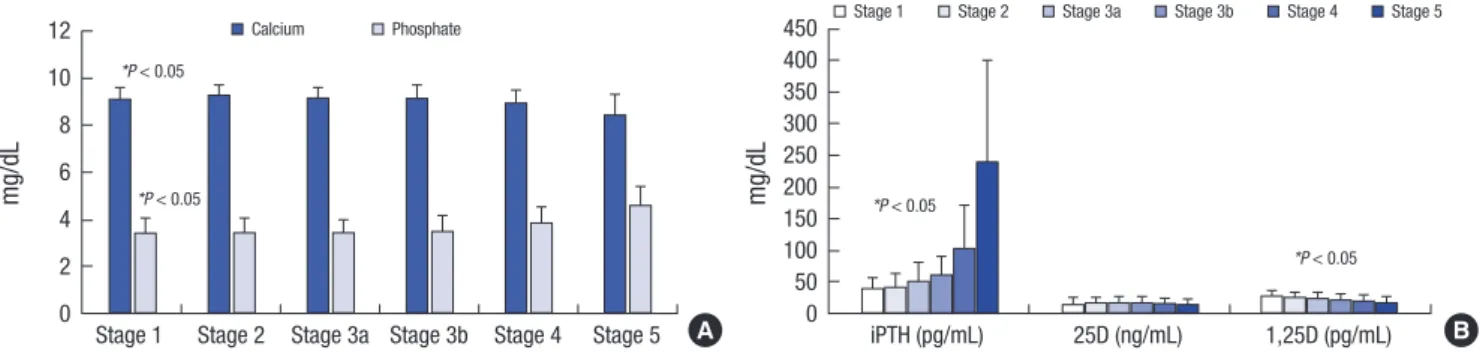
The interrelationships between biochemical parameters of min- eral metabolism and renal function after dividing the cohort according to the CKD stages are shown in Table 1. Serum calci- um and phosphate were relatively stable across the CKD stages, until eGFR levels decreased to 15 mL/min/1.73 m2 (Fig. 1A).
Fig. 1B shows the levels of iPTH, 25D, and 1,25D in each CKD
stage. Increases in iPTH (> 65 pg/dL) began to occur at eGFR levels of 30 mL/min/1.73 m2. Although the 25D level was lower in all CKD stages, we could not find any correlation between 25D level and eGFR. Interestingly, the 1,25D level decreased continuously with decreasing eGFR, especially in CKD stage 1.
Fig. 2 shows the prevalence of biochemical abnormalities of serum FGF23, iPTH, and vitamin D levels in relation to CKD stages. FGF23 excess, which we defined as FGF23 > 100 RU/mL, increased prominently at eGFR levels below 30 mL/min/1.73 m2. The prevalence of secondary hyperparathyroidism (iPTH > 65 pg/mL) was increased with declined eGFR. Secondary hyperpara- thyroidism was present in 8.9% of CKD stage 1 patients, 13% of CKD stage 2, 22.4% of CKD stage 3a, 33.3% of CKD stage 3b, 72.2%
of CKD stage 4, and 87.8% of CKD stage 5. Furthermore, vitamin D deficiency (25D < 20 ng/mL) was shown to be higher, even in the early stages of CKD, rather than FGF23 excess and sec- ondary hyperparathyroidism. Vitamin D deficiency occurred in 76.7% of patients with CKD, with an eGFR > 90 mL/ min/1.73 m2. Table 1. Description of biochemical characteristics of mineral metabolism as CKD stages
CKD stage* Stage 1
(n = 265) Stage 2
(n = 419) Stage 3a
(n = 403) Stage 3b
(n = 484) Stage 4
(n = 522) Stage 5
(n = 145) P value Serum calcium, mg/dL
No. 262 415 396 481 516 143 < 0.001†
Mean ± SD 9.2 ± 0.4 9.3 ± 0.4 9.2 ± 0.4 9.2 ± 0.5 9.0 ± 0.5 8.5 ± 0.8 < 0.001‡
Median (25th, 75th) 9.3 (8.0, 10.3) 9.3 (7.8, 10.8) 9.2 (7.5, 10.6) 9.2 (7.6, 10.7) 9 (6.7, 11.0) 8.7 (5.1, 9.7) - Serum phosphate, mg/dL
No. 259 414 395 480 516 143 < 0.001†
Mean ± SD 3.5 ± 0.5 3.5 ± 0.6 3.5 ± 0.5 3.6 ± 0.6 3.9 ± 0.7 4.7 ± 0.8 < 0.001‡
Median (25th, 75th) 3.5 (1.4, 5.0) 3.4 (2.0, 5.8) 3.5 (2.2, 5.0) 3.6 (2.0, 8.8) 3.9 (2.0, 6.8) 4.6 (3.3, 7.8) - iPTH, pg/dL
No. 123 200 170 201 209 41 < 0.001†
Mean ± SD 40.2 ± 17.4 43.0 ± 21.1 51.9 ± 29.7 61.6 ± 31.2 104.7 ± 70.8 240.8 ± 214.1 < 0.001‡
Median (25th, 75th) 37.3 (9.7, 95.6) 38.4 (7.0, 140.3) 44.6 (8.4, 225.0) 53.5 (14.0, 184.7) 87.8 (14.1, 590.9) 175.1 (37.6, 1,078.0) - iPTH, No. (%)
≤ 65 pg/dL 112 (91.1) 174 (87.0) 132 (77.6) 134 (66.7) 58 (27.8) 5 (12.2) < 0.001§
> 65 pg/dL 11 (8.9) 26 (13.0) 38 (22.4) 67 (33.3) 151 (72.2) 36 (87.8) -
25D, ng/mL
No. 257 399 384 466 499 139 < 0.001†
Mean ± SD 16.3 ± 6.4 18.5 ± 7.4 18.8 ± 8.0 18.0 ± 7.9 17.6 ± 8.6 16.3 ± 8.3 0.066‡
Median (25th, 75th) 15.6 (4.8, 44.3) 17.3 (4.3, 46.6) 17.4 (4.7, 65.5) 16.7 (4.2, 73.7) 15.9 (4.2, 116.4) 14.6 (4.4, 60.5) - 25D, ng/mL
< 20 197 (76.7) 260 (65.2) 253 (65.9) 319 (68.5) 346 (69.3) 108 (77.7) 0.069§
20.0–29.9 51 (19.8) 107 (26.8) 100 (26.0) 120 (25.8) 115 (23.0) 22 (15.8) 0.920‡
30.0–100.0 9 (3.5) 32 (8.0) 31 (8.1) 27 (5.8) 37 (7.4) 9 (6.5) -
> 100.0 0 (0.0) 0 (0.0) 0 (0.0) 0 (0.0) 1 (0.2) 0 (0.0) -
1,25D, ng/mL
No. 123 200 170 201 208 41 < 0.001†
Mean ± SD 29.5 ± 9.0 26.9 ± 7.5 24.9 ± 7.2 23.0 ± 7.4 20.5 ± 6.3 18.4 ± 6.2 < 0.001‡
Median (25th, 75th) 28.6 (11.5, 62.5) 26 (11.4, 55.0) 24.6 (9.3, 54.3) 22.6 (9.5, 81.7) 20.6 (9.3, 43.1) 18.3 (9.3, 37.1) - FGF23, RU/mL
No. 160 262 259 317 345 110 < 0.001†
Median (25th, 75th) 4.2 (0.0, 20.6) 4.1 (0.0, 23.4) 10.6 (0.3, 23.5) 17.9 (1.0, 29.6) 24.5 (3.1, 39.1) 42.6 (23.3, 81.8) < 0.001‡ FGF23, No. (%)
> 100 RU/mL 3 (1.9) 4 (1.5) 3 (1.2) 2 (0.6) 12 (3.5) 15 (13.6) < 0.001
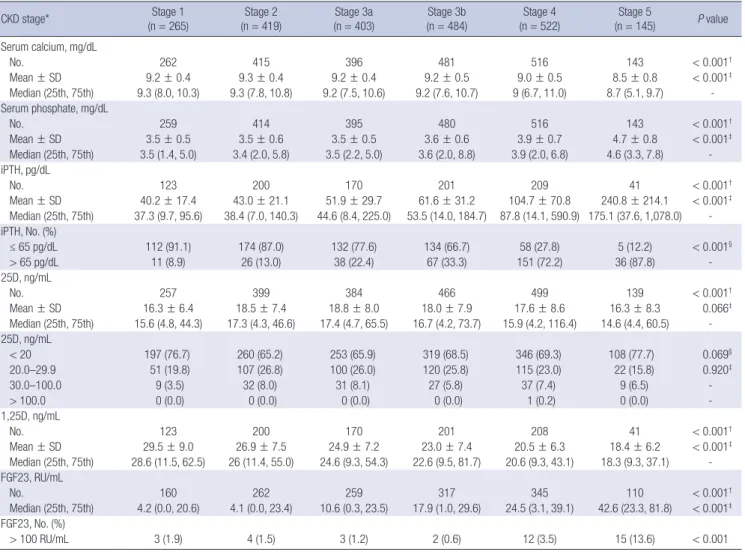
CKD = chronic kidney disease, SD = standard deviation, iPTH = intact parathyroid hormone, 25D = 25-hydroxyvitamin D3, 1,25D = 1,25-dihydroxyvitamin D3, FGF23 = fibroblast growth factor 23, eGFR = estimated glomerular filtration rate, MDRD = Modification of Diet in Renal Disease, KDIGO = Kidney Disease: Improving Global Outcomes.
*eGFR (mL/min/1.73 m2), calculated using the MDRD equation; and eGFR categories defined by the 2012 KDIGO Clinical Practice Guideline for the Evaluation and Management of CKD; †P value by Kruskal-Wallis test; ‡P value for trend (one-way analysis of variance, Jonckheere-Terpstra test, Mantel-Haenszel χ2 test); §P value by χ2 test.
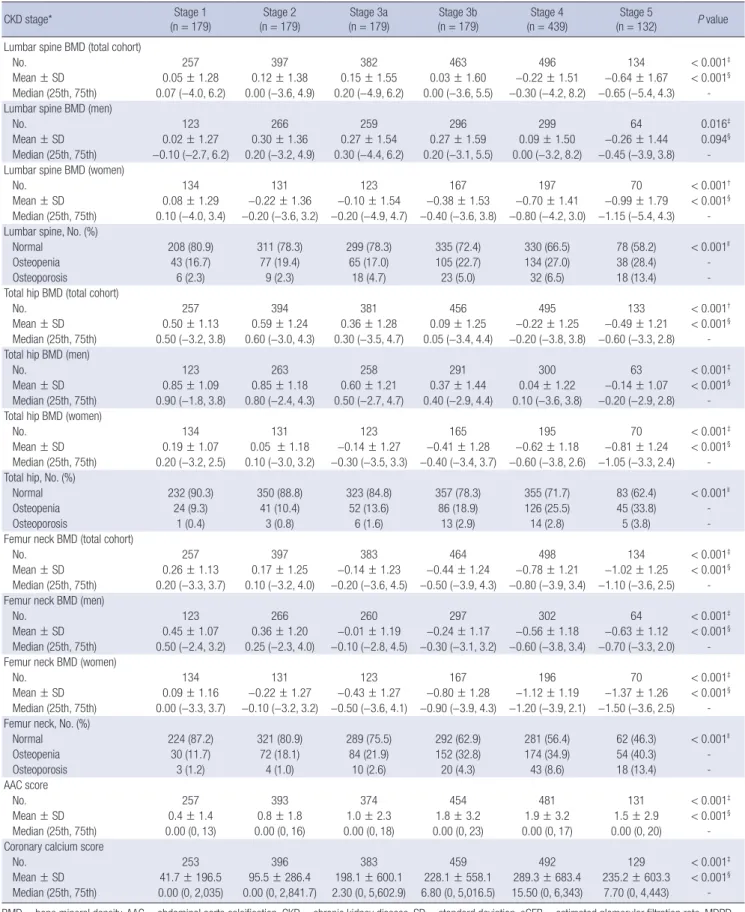
Bone density in relation to CKD stages
We analyzed BMD in the lumbar spine, total hip, and femur neck in each CKD stage (Table 2). Lumbar spine BMD was in- creased until eGFR fell below 45 mL/min/1.73 m2, whereas it was decreased at an eGFR level below 45 mL/min/1.73 m2. To- tal hip BMD was highest in CKD stage 2 (0.59 ± 1.24), and then decreased at an eGFR level below 60 mL/min/1.73 m2. Howev- er, femoral neck BMD was decreased uniformly across declin- ing eGFR levels. All BMDs were lowest in CKD stage 5 (lumbar spine, −0.64 ± 1.67; total hip, −0.49 ± 1.21; and femur neck, −1.02
± 1.25). BMD of the lumbar spine, total hip, and femoral neck in women was significantly lower than that in men across the CKD stages. The prevalence of osteoporosis was higher in pa- tients with a lower eGFR level. Indeed, osteoporosis based on femoral neck BMD in patients with CKD stage 5 was 11.2-fold more prevalent than in those with CKD stage 1 (stage 1, 1.2% vs.
stage 5, 13.4%) (Fig. 3). Similar to osteoporosis, the prevalence of osteopenia was significantly higher in patients with a lower eGFR level.
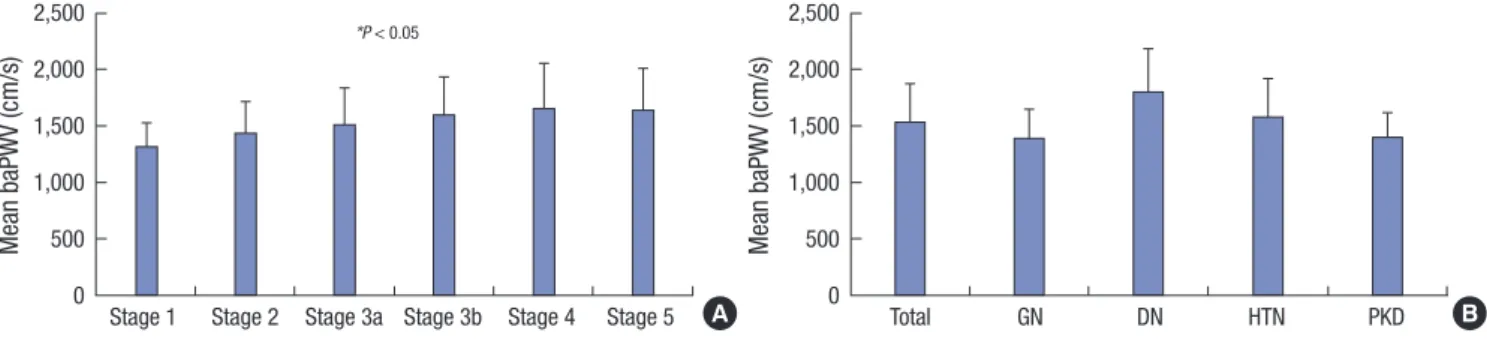
Vascular calcifications in relation to CKD stages
To evaluate the vascular calcification in patients with CKD, we used the mean baPWV within each CKD stage (Fig. 4A). There was an association between vascular calcification and increased arterial stiffness, which was measured with PWV, in patients with CKD (19). The mean baPWV was increased across declining eGFR levels. Patients with diabetic nephropathy had the high- est mean baPWV among other types of primary renal disease (Fig. 4B). The abdominal aortic calcification (AAC) and coronary calcium score were also increased in the early stages of CKD, and showed peaks in CKD stage 4 (1.9 ± 3.2 and 289.3 ± 683.4, respectively) (Table 2).
Serum FGF23 correlated with levels of bone mineral metabolism markers
Finally, we determined the association between clinical variables of the CKD-MBD marker and serum FGF23 concentration in patients with CKD (Table 3). The serum FGF23 concentration was significantly correlated with serum phosphate and iPTH (r = 0.236, P < 0.001; r = 0.249, P < 0.001, respectively), and neg- ative correlated with serum calcium, serum level of 25D and 1,25D, and total hip and femoral neck BMD (r = −0.131, P < 0.001).
Fig. 1. Distributions of biochemical parameters of mineral metabolism in relation to CKD stages. (A) Calcium and phosphate. (B) iPTH, 25D, and 1,25D. Error bars denote stan- dard deviation (SD).
CKD = chronic kidney disease, iPTH = intact parathyroid hormone, 25D = 25-hydroxyvitamin D3, 1,25D = 1,25-dihydroxyvitamin D3.
*P < 0.05 for trend between stages.
Stage 1 Stage 2 Stage 3a Stage 3b Stage 4 Stage 5 12
10 8 6 4 2 0
*P < 0.05
*P < 0.05
mg/dL
Calcium Phosphate
iPTH (pg/mL) 25D (ng/mL) 1,25D (pg/mL) 450
400 350 300 250 200 150 100 50 0
*P < 0.05
*P < 0.05
mg/dL
Stage 1 Stage 2 Stage 3a Stage 3b Stage 4 Stage 5
A B
Fig. 2. The prevalence of serum FGF23 excess (FGF23 > 100 RU/mL), secondary hyperparathyroidism (iPTH > 65 pg/mL) and vitamin D deficiency (25D < 20 ng/mL) in relation to CKD stages.
FGF23 = fibroblast growth factor 23, iPTH = intact parathyroid hormone, 25D = 25- hydroxyvitamin D3, CKD = chronic kidney disease.
*P < 0.05 for trend between stages.
(%)
FGF23 excess Secondary
hyperparathyroidism Vitamin D deficiency 100
90 80 70 60 50 40 30 20 10 0
*P < 0.05
*P < 0.05
Stage 1 Stage 2 Stage 3a Stage 3b Stage 4 Stage 5
Fig. 3. The prevalence of osteoporosis based on femoral neck BMD in relation to CKD stages.
BMD = bone mineral density, CKD = chronic kidney disease.
*P < 0.05 for trend between stages.
Osteoporosis Osteopenia Normal
(%)
Stage 1 Stage 2 Stage 3a Stage 3b Stage 4 Stage 5 100
80 60 40 20 0
*P < 0.05
Table 2. BMD, AAC score, and coronary calcium score according to CKD stages
CKD stage* Stage 1
(n = 179) Stage 2
(n = 179) Stage 3a
(n = 179) Stage 3b
(n = 179) Stage 4
(n = 439) Stage 5
(n = 132) P value Lumbar spine BMD (total cohort)
No. 257 397 382 463 496 134 < 0.001‡
Mean ± SD 0.05 ± 1.28 0.12 ± 1.38 0.15 ± 1.55 0.03 ± 1.60 −0.22 ± 1.51 −0.64 ± 1.67 < 0.001§
Median (25th, 75th) 0.07 (−4.0, 6.2) 0.00 (−3.6, 4.9) 0.20 (−4.9, 6.2) 0.00 (−3.6, 5.5) −0.30 (−4.2, 8.2) −0.65 (−5.4, 4.3) - Lumbar spine BMD (men)
No. 123 266 259 296 299 64 0.016‡
Mean ± SD 0.02 ± 1.27 0.30 ± 1.36 0.27 ± 1.54 0.27 ± 1.59 0.09 ± 1.50 −0.26 ± 1.44 0.094§
Median (25th, 75th) −0.10 (−2.7, 6.2) 0.20 (−3.2, 4.9) 0.30 (−4.4, 6.2) 0.20 (−3.1, 5.5) 0.00 (−3.2, 8.2) −0.45 (−3.9, 3.8) - Lumbar spine BMD (women)
No. 134 131 123 167 197 70 < 0.001†
Mean ± SD 0.08 ± 1.29 −0.22 ± 1.36 −0.10 ± 1.54 −0.38 ± 1.53 −0.70 ± 1.41 −0.99 ± 1.79 < 0.001§ Median (25th, 75th) 0.10 (−4.0, 3.4) −0.20 (−3.6, 3.2) −0.20 (−4.9, 4.7) −0.40 (−3.6, 3.8) −0.80 (−4.2, 3.0) −1.15 (−5.4, 4.3) - Lumbar spine, No. (%)
Normal 208 (80.9) 311 (78.3) 299 (78.3) 335 (72.4) 330 (66.5) 78 (58.2) < 0.001ll
Osteopenia 43 (16.7) 77 (19.4) 65 (17.0) 105 (22.7) 134 (27.0) 38 (28.4) -
Osteoporosis 6 (2.3) 9 (2.3) 18 (4.7) 23 (5.0) 32 (6.5) 18 (13.4) -
Total hip BMD (total cohort)
No. 257 394 381 456 495 133 < 0.001†
Mean ± SD 0.50 ± 1.13 0.59 ± 1.24 0.36 ± 1.28 0.09 ± 1.25 −0.22 ± 1.25 −0.49 ± 1.21 < 0.001§
Median (25th, 75th) 0.50 (−3.2, 3.8) 0.60 (−3.0, 4.3) 0.30 (−3.5, 4.7) 0.05 (−3.4, 4.4) −0.20 (−3.8, 3.8) −0.60 (−3.3, 2.8) - Total hip BMD (men)
No. 123 263 258 291 300 63 < 0.001‡
Mean ± SD 0.85 ± 1.09 0.85 ± 1.18 0.60 ± 1.21 0.37 ± 1.44 0.04 ± 1.22 −0.14 ± 1.07 < 0.001§
Median (25th, 75th) 0.90 (−1.8, 3.8) 0.80 (−2.4, 4.3) 0.50 (−2.7, 4.7) 0.40 (−2.9, 4.4) 0.10 (−3.6, 3.8) −0.20 (−2.9, 2.8) - Total hip BMD (women)
No. 134 131 123 165 195 70 < 0.001‡
Mean ± SD 0.19 ± 1.07 0.05 ± 1.18 −0.14 ± 1.27 −0.41 ± 1.28 −0.62 ± 1.18 −0.81 ± 1.24 < 0.001§ Median (25th, 75th) 0.20 (−3.2, 2.5) 0.10 (−3.0, 3.2) −0.30 (−3.5, 3.3) −0.40 (−3.4, 3.7) −0.60 (−3.8, 2.6) −1.05 (−3.3, 2.4) - Total hip, No. (%)
Normal 232 (90.3) 350 (88.8) 323 (84.8) 357 (78.3) 355 (71.7) 83 (62.4) < 0.001ll
Osteopenia 24 (9.3) 41 (10.4) 52 (13.6) 86 (18.9) 126 (25.5) 45 (33.8) -
Osteoporosis 1 (0.4) 3 (0.8) 6 (1.6) 13 (2.9) 14 (2.8) 5 (3.8) -
Femur neck BMD (total cohort)
No. 257 397 383 464 498 134 < 0.001‡
Mean ± SD 0.26 ± 1.13 0.17 ± 1.25 −0.14 ± 1.23 −0.44 ± 1.24 −0.78 ± 1.21 −1.02 ± 1.25 < 0.001§ Median (25th, 75th) 0.20 (−3.3, 3.7) 0.10 (−3.2, 4.0) −0.20 (−3.6, 4.5) −0.50 (−3.9, 4.3) −0.80 (−3.9, 3.4) −1.10 (−3.6, 2.5) - Femur neck BMD (men)
No. 123 266 260 297 302 64 < 0.001‡
Mean ± SD 0.45 ± 1.07 0.36 ± 1.20 −0.01 ± 1.19 −0.24 ± 1.17 −0.56 ± 1.18 −0.63 ± 1.12 < 0.001§ Median (25th, 75th) 0.50 (−2.4, 3.2) 0.25 (−2.3, 4.0) −0.10 (−2.8, 4.5) −0.30 (−3.1, 3.2) −0.60 (−3.8, 3.4) −0.70 (−3.3, 2.0) - Femur neck BMD (women)
No. 134 131 123 167 196 70 < 0.001‡
Mean ± SD 0.09 ± 1.16 −0.22 ± 1.27 −0.43 ± 1.27 −0.80 ± 1.28 −1.12 ± 1.19 −1.37 ± 1.26 < 0.001§ Median (25th, 75th) 0.00 (−3.3, 3.7) −0.10 (−3.2, 3.2) −0.50 (−3.6, 4.1) −0.90 (−3.9, 4.3) −1.20 (−3.9, 2.1) −1.50 (−3.6, 2.5) - Femur neck, No. (%)
Normal 224 (87.2) 321 (80.9) 289 (75.5) 292 (62.9) 281 (56.4) 62 (46.3) < 0.001ll
Osteopenia 30 (11.7) 72 (18.1) 84 (21.9) 152 (32.8) 174 (34.9) 54 (40.3) -
Osteoporosis 3 (1.2) 4 (1.0) 10 (2.6) 20 (4.3) 43 (8.6) 18 (13.4) -
AAC score
No. 257 393 374 454 481 131 < 0.001‡
Mean ± SD 0.4 ± 1.4 0.8 ± 1.8 1.0 ± 2.3 1.8 ± 3.2 1.9 ± 3.2 1.5 ± 2.9 < 0.001§
Median (25th, 75th) 0.00 (0, 13) 0.00 (0, 16) 0.00 (0, 18) 0.00 (0, 23) 0.00 (0, 17) 0.00 (0, 20) - Coronary calcium score
No. 253 396 383 459 492 129 < 0.001‡
Mean ± SD 41.7 ± 196.5 95.5 ± 286.4 198.1 ± 600.1 228.1 ± 558.1 289.3 ± 683.4 235.2 ± 603.3 < 0.001§ Median (25th, 75th) 0.00 (0, 2,035) 0.00 (0, 2,841.7) 2.30 (0, 5,602.9) 6.80 (0, 5,016.5) 15.50 (0, 6,343) 7.70 (0, 4,443) - BMD = bone mineral density, AAC = abdominal aorta calcification, CKD = chronic kidney disease, SD = standard deviation, eGFR = estimated glomerular filtration rate, MDRD = Modification of Diet in Renal Disease, KDIGO = Kidney Disease: Improving Global Outcomes.
*eGFR (mL/min/1.73 m2), calculated using the MDRD equation; and eGFR categories defined by the 2012 KDIGO Clinical Practice Guideline for the Evaluation and Management of CKD; †P value by one-way analysis of variance; ‡P value by Kruskal-Wallis test; §P value for trend (one-way analysis of variance, Jonckheere-Terpstra test, Mantel-Haenszel χ2 test); llP value by χ2 test.
DISCUSSION
The present study showed that increases in both serum FGF23 and iPTH preceded changes in serum calcium and phosphate.
Interestingly, the 25D and 1,25D levels decreased earlier than the increase of serum FGF23 or iPTH, with a declining eGFR level. Moreover, we showed that BMD was decreased, and there was a high prevalence of osteoporosis in advanced-stage CKD patients. In addition, vascular calcification began to occur in the early stages of CKD. Serum FGF23 was correlated with se- rum calcium and phosphate, iPTH, vitamin D levels, and total hip and femur neck BMD.
CKD affects bone and mineral metabolism, with decreased levels of 1,25D and serum calcium, and increased levels of iPTH, FGF23, and serum phosphate, resulting in CKD-MBD. It is well known that phosphate levels are normal in the majority of pa- tients with early and intermediate stages of CKD. Increases in FGF23 and iPTH act as compensatory responses to maintain phosphate balance (20,21). In a previous study representing the United States population, serum calcium and phosphate levels were normal until the eGFR became lower than 40 mL/min/1.73 m2 (7,22). In addition, in the Chronic Renal Insufficiency Co-
hort (CRIC) study, which included black and Hispanic partici- pants, hyperphosphatemia, which was defined as a serum phos- phate level ≥ 4.6 mg/dL, and hypocalcemia were a late mani- festation in patients with eGFR < 20 mL/min/1.73 m2 (7). Con- sistent with previous studies, our finding showed that hyper- phosphatemia appears in late stages of CKD, with an eGFR be- low < 15 mL/min/1.73 m2, and increased FGF23 and iPTH pre- cedes increased serum phosphate levels in a Korean adult pop- ulation, regardless of ethnic differences.
Serum FGF23 is considered an early biomarker of disordered mineral and bone metabolism in patients with CKD. Our find- ings are consistent with previous results showing that the FGF23 level was high in CKD patients with decreased eGFR, increased iPTH, and decreased 25D and 1,25D levels (23,24). According to the CRIC study, the FGF23 level was elevated early, before PTH and phosphate levels increased, and steadily increased with the progression of kidney disease (7). However, in our study, secondary hyperparathyroidism was more prevalent than FGF23 excess in the early and intermediate stages of CKD, although a median value of iPTH exceeding 65 pg/mL was shown at an eGFR below 30 mL/min/1.73 m2, similar to that of Western popula- tions (22). Moreover, our results showed a very high prevalence of 25D and 1,25D deficiency in a Korean population compared with that in Western populations, even at higher levels of eGFR (21,22,25). In data from the Fourth Korean National Health and Nutritional Examination Survey 2008, the overall prevalence of vitamin D deficiency (25D < 15.0 ng/mL) was as high as 29.9%, and serum 25D levels started to decrease below an eGFR level of approximately 60 mL/min/1.73 m2 (26). A cohort of 113 CKD stage 3 and 4 patients showed that Southeast Asians had a low- er 25D level than Caucasians (10.3 ± 6.4 vs. 20.3 ± 8.7 ng/mL, respectively) (27). Patients of the Asian-origin ethnic group are known to be at risk for hypovitaminosis D due to diet and lack of sunlight exposure (28). Furthermore, 1,25D deficiency pro- motes parathyroid gland hyperplasia and increased PTH syn- thesis through loss of the effect of negative feedback of vitamin D (29). Therefore, a decrease of 1,25D levels seemed to occur earlier in the course of eGFR decline than dose elevations in Fig. 4. Values of baPWV within (A) each CKD stage and (B) according to primary renal disease type.
CKD = chronic kidney disease, baPWV = brachial-to-ankle pulse wave velocity, GN = glomerulonephritis, DN = diabetic nephropathy, HTN = hypertensive nephropathy, PKD = polycystic kidney disease.
*P < 0.05 for trends between stages. Error bars=standard deviation (SD).
Stage 1 Stage 2 Stage 3a Stage 3b Stage 4 Stage 5 2,500
2,000 1,500 1,000 500 0
*P < 0.05
Mean baPWV (cm/s)
Total GN DN HTN PKD
2,500 2,000 1,500 1,000 500 0
Mean baPWV (cm/s)
A B
Table 3. Correlations of CKD-MBD parameters with serum FGF23 concentration
Parameters Serum FGF23
No. r P value
Serum phosphorous 1,445 0.2358 < 0.001
Serum calcium 1,448 −0.1745 < 0.001
iPTH 250 0.2487 < 0.001
25D 1,447 −0.1291 < 0.001
1,25D 250 −0.1706 0.007
1,25D/25D ratio 250 0.0791 0.213
Lumbar spine BMD 1,426 −0.0309 0.243
Total hip BMD 1,409 −0.1115 < 0.001
Femur neck BMD 1,426 −0.1305 < 0.001
r = Spearman correlation coefficient.
CKD-MBD = chronic kidney disease-mineral and bone disorder, FGF23 = fibroblast growth factor 23, iPTH = intact parathyroid hormone, 25D = 25-hydroxyvitamin D3, 1,25D = 1,25-dihydroxyvitamin D3, BMD = bone mineral density.
iPTH levels in our study. Larger representative studies are nec- essary to investigate the prevalence of vitamin D deficiency across different ethnic groups and levels of kidney dysfunction. Fur- thermore, research is also needed to determine whether a de- creased 1,25D level drives the vicious cycle of mineral metabo- lism in Korean patients with CKD (8).
Patients who have impaired renal function tend to have a low- er BMD than the general population (30). In a study from the Third National Health and Nutrition Examination Survey of 13,831 patients over 20 years old in the United States, women and men with osteoporosis were concentrated in the low range of creatinine clearance (CCr); the prevalence of osteoporosis for CCr < 35 mL/min was found to be 24% in women and 11%
in men (31). Comparable with the previous study of Americans, decreased BMD and a high prevalence of osteoporosis were ob- served with declining eGFR. In addition, lower BMD in women was seen across the CKD stages (32). Moreover, femoral neck BMD, which may be less influenced by AAC, was more corre- lated with decreased eGFR than other BMD measurement sites.
Furthermore, a recent prospective study found that femoral neck BMD is useful for identifying nonspine fracture risk in patients with or without CKD (33). A recent meta-analysis showed that BMD can discriminate fracture status in CKD patients (33,34).
In this sense, we found that femoral neck BMD is negatively cor- related with FGF23 level, which has been related to the risk of fracture in elderly CKD patients in several studies (24,35). How- ever, there are still many unresolved issues about the Korean population with CKD-MBD, including the association between lower BMD and fracture risk. Meanwhile, bone loss is mostly from cortical bone in CKD with MBD, because hyperparathy- roidism typically causes catabolic effects on cortical bone and anabolic effects on trabecular bone; whereas in osteoporosis, both cortical and trabecular bone are lost (36,37). Therefore, fur- ther studies using peripheral quantitative computed tomogra- phy to measure cortical and trabecular bone density are required to examine whether CKD-MBD such as hyperparathyroidism and/or adynamic bone disease or osteoporosis is strongly asso- ciated with fractures in patients with CKD (38).
Cardiovascular disease is the leading cause of death in pa- tients with CKD. Although its pathophysiology is multifactorial, vascular calcification is considered to be one of the major con- tributory factors. A recent prospective and observational French study showed that aortic and coronary artery calcification scores could predict all-cause and cardiovascular mortalities in CKD patients (39). In a study of CKD patients with diabetes in the Neth- erlands, the descending thoracic aorta calcium score was inde- pendently associated with arterial stiffness and associated with decreased eGFR, similar to the findings of our study (40).
The present study has several limitations. First, as with any cross-sectional study, we were unable to examine the longitu- dinal changes in laboratory findings and bone and vascular cal-
cification parameters over time. Second, because only baseline data were used in this study, we were unable to determine the causal relationships of CKD-MBD parameters with fracture risk and cardiovascular mortality. Third, we analyzed the descrip- tive data and did not adjust for confounding factors such as age, gender, comorbidities, and medicine. Our results could be af- fected by many confounding factors.
To conclude, in a large population of Korean patients with CKD, we found that serum vitamin D level declined early in CKD before significant elevations in level of FGF23 and iPTH were observed. Moreover, FGF23 elevation observed concurrently with increased iPTH with declining eGFR, dissimilar to Western populations. The prevalence of osteoporosis was higher in CKD patients with decreased eGFR. Also, increased vascular calcifi- cation scores were noted in the early stages of CKD, similar to that of Western populations. Further studies in both epidemiol- ogy and pathophysiology are needed to determine the associa- tion between CKD-MBD and clinical outcomes in the Korean population.
DISCLOSURE
The authors have no potential conflicts of interest to disclose.
AUTHOR CONTRIBUTION
Conceptualization: Kim CS, Oh KH, Kim SW. Data curation: Kim CS, Han SH, Lee KB, Lee J, Oh KH, Chae DW. Investigation: Kim CS, Lee J, Oh KH, Kim SW. Writing - original draft: Kim CS, Kim SW. Writing - review & editing: Kim CS, Bae EH, Ma SK, Han SH.
ORCID
Chang Seong Kim http://orcid.org/0000-0001-8753-7641 Eun Hui Bae http://orcid.org/0000-0003-1727-2822 Seong Kwon Ma http://orcid.org/0000-0002-5758-8189 Seung Hyeok Han http://orcid.org/0000-0001-7923-5635 Kyu-Beck Lee http://orcid.org/0000-0002-3904-5404 Joongyub Lee http://orcid.org/0000-0003-2784-3772 Kook-Hwan Oh http://orcid.org/0000-0001-9525-2179 Dong-Wan Chae http://orcid.org/0000-0001-9401-892X Soo Wan Kim http://orcid.org/0000-0002-3540-9004 REFERENCES
1. Kidney Disease: Improving Global Outcomes (KDIGO) CKD-MBD Work Group. KDIGO clinical practice guideline for the diagnosis, evaluation, prevention, and treatment of chronic kidney disease-mineral and bone disorder (CKD-MBD). Kidney Int Suppl 2009: S1-130.
2. Fried LF, Biggs ML, Shlipak MG, Seliger S, Kestenbaum B, Stehman-Breen C, Sarnak M, Siscovick D, Harris T, Cauley J, et al. Association of kidney
function with incident hip fracture in older adults. J Am Soc Nephrol 2007;
18: 282-6.
3. Kestenbaum B, Sampson JN, Rudser KD, Patterson DJ, Seliger SL, Young B, Sherrard DJ, Andress DL. Serum phosphate levels and mortality risk among people with chronic kidney disease. J Am Soc Nephrol 2005; 16:
520-8.
4. Go AS, Chertow GM, Fan D, McCulloch CE, Hsu CY. Chronic kidney dis- ease and the risks of death, cardiovascular events, and hospitalization. N Engl J Med 2004; 351: 1296-305.
5. Fang Y, Ginsberg C, Sugatani T, Monier-Faugere MC, Malluche H, Hruska KA. Early chronic kidney disease-mineral bone disorder stimulates vas- cular calcification. Kidney Int 2014; 85: 142-50.
6. Moe SM, Radcliffe JS, White KE, Gattone VH 2nd, Seifert MF, Chen X, Al- dridge B, Chen NX. The pathophysiology of early-stage chronic kidney disease-mineral bone disorder (CKD-MBD) and response to phosphate binders in the rat. J Bone Miner Res 2011; 26: 2672-81.
7. Isakova T, Wahl P, Vargas GS, Gutiérrez OM, Scialla J, Xie H, Appleby D, Nessel L, Bellovich K, Chen J, et al. Fibroblast growth factor 23 is elevated before parathyroid hormone and phosphate in chronic kidney disease.
Kidney Int 2011; 79: 1370-8.
8. Kuro-O M. Phosphate and Klotho. Kidney Int 2011; 79121: S20-3.
9. Hu MC, Shi M, Zhang J, Quiñones H, Griffith C, Kuro-o M, Moe OW. Klotho deficiency causes vascular calcification in chronic kidney disease. J Am Soc Nephrol 2011; 22: 124-36.
10. Block GA, Klassen PS, Lazarus JM, Ofsthun N, Lowrie EG, Chertow GM.
Mineral metabolism, mortality, and morbidity in maintenance hemodi- alysis. J Am Soc Nephrol 2004; 15: 2208-18.
11. Gutiérrez OM, Mannstadt M, Isakova T, Rauh-Hain JA, Tamez H, Shah A, Smith K, Lee H, Thadhani R, Jüppner H, et al. Fibroblast growth factor 23 and mortality among patients undergoing hemodialysis. N Engl J Med 2008; 359: 584-92.
12. Shin SK, Kim DH, Kim HS, Shin KT, Ma KA, Kim SJ, Kwak YS, Ha SK, Sher- rard DJ. Renal osteodystrophy in pre-dialysis patients: ethnic difference?
Perit Dial Int 1999; 19 Suppl 2: S402-7.
13. Oh KH, Park SK, Park HC, Chin HJ, Chae DW, Choi KH, Han SH, Yoo TH, Lee K, Kim YS, et al. KNOW-CKD (KoreaN cohort study for outcome in patients with chronic kidney disease): design and methods. BMC Nephrol 2014; 15: 80.
14. Levey AS, Coresh J, Greene T, Stevens LA, Zhang YL, Hendriksen S, Kusek JW, Van Lente F; Chronic Kidney Disease Epidemiology Collaboration.
Using standardized serum creatinine values in the modification of diet in renal disease study equation for estimating glomerular filtration rate. Ann Intern Med 2006; 145: 247-54.
15. Chapter 1: definition and classification of CKD. Kidney Int Suppl (2011) 2013; 3: 19-62.
16. Kim CS, Kim SW. Vitamin D and chronic kidney disease. Korean J Intern Med 2014; 29: 416-27.
17. Edwards MH, Dennison EM, Aihie Sayer A, Fielding R, Cooper C. Osteo- porosis and sarcopenia in older age. Bone 2015; 80: 126-30.
18. Tomiyama H, Yamashina A, Arai T, Hirose K, Koji Y, Chikamori T, Hori S, Yamamoto Y, Doba N, Hinohara S. Influences of age and gender on re- sults of noninvasive brachial-ankle pulse wave velocity measurement--a survey of 12517 subjects. Atherosclerosis 2003; 166: 303-9.
19. Karohl C, D’Marco Gascón L, Raggi P. Noninvasive imaging for assessment of calcification in chronic kidney disease. Nat Rev Nephrol 2011; 7: 567-
77.
20. Evenepoel P, Meijers B, Viaene L, Bammens B, Claes K, Kuypers D, Vander- schueren D, Vanrenterghem Y. Fibroblast growth factor-23 in early chron- ic kidney disease: additional support in favor of a phosphate-centric par- adigm for the pathogenesis of secondary hyperparathyroidism. Clin J Am Soc Nephrol 2010; 5: 1268-76.
21. Gutierrez O, Isakova T, Rhee E, Shah A, Holmes J, Collerone G, Jüppner H, Wolf M. Fibroblast growth factor-23 mitigates hyperphosphatemia but accentuates calcitriol deficiency in chronic kidney disease. J Am Soc Nephrol 2005; 16: 2205-15.
22. Levin A, Bakris GL, Molitch M, Smulders M, Tian J, Williams LA, Andress DL. Prevalence of abnormal serum vitamin D, PTH, calcium, and phos- phorus in patients with chronic kidney disease: results of the study to eval- uate early kidney disease. Kidney Int 2007; 71: 31-8.
23. Gutiérrez OM. Fibroblast growth factor 23 and disordered vitamin D me- tabolism in chronic kidney disease: updating the “trade-off” hypothesis.
Clin J Am Soc Nephrol 2010; 5: 1710-6.
24. Kanda E, Yoshida M, Sasaki S. Applicability of fibroblast growth factor 23 for evaluation of risk of vertebral fracture and chronic kidney disease-min- eral bone disease in elderly chronic kidney disease patients. BMC Nephrol 2012; 13: 122.
25. Jovanovich A, Chonchol M, Cheung AK, Kaufman JS, Greene T, Roberts WL, Smits G, Kendrick J; HOST Investigators. Racial differences in mark- ers of mineral metabolism in advanced chronic kidney disease. Clin J Am Soc Nephrol 2012; 7: 640-7.
26. Oh YJ, Kim M, Lee H, Lee JP, Kim H, Kim S, Oh KH, Joo KW, Lim CS, Kim S, et al. A threshold value of estimated glomerular filtration rate that pre- dicts changes in serum 25-hydroxyvitamin D levels: 4th Korean National Health and Nutritional Examination Survey 2008. Nephrol Dial Trans- plant 2012; 27: 2396-403.
27. Kosmadakis G, Duja S, Basta M, Iqbal J, Warwick G, Medcalf JF. 25(OH) vitamin D deficiency among SE Asians and Caucasians with CKD 3 and 4, and its role in hyperparathyroidism. Kidney Int 2008; 73: 360.
28. Serhan E, Holland MR. Relationship of hypovitaminosis D and second- ary hyperparathyroidism with bone mineral density among UK resident Indo-Asians. Ann Rheum Dis 2002; 61: 456-8.
29. Llach F, Velasquez Forero F. Secondary hyperparathyroidism in chronic renal failure: pathogenic and clinical aspects. Am J Kidney Dis 2001; 38:
S20-33.
30. Fidan N, Inci A, Coban M, Ulman C, Kursat S. Bone mineral density and biochemical markers of bone metabolism in predialysis patients with chro- nic kidney disease. J Investig Med 2016; 64: 861-6.
31. Klawansky S, Komaroff E, Cavanaugh PF Jr, Mitchell DY, Gordon MJ, Con- nelly JE, Ross SD. Relationship between age, renal function and bone min- eral density in the US population. Osteoporos Int 2003; 14: 570-6.
32. Lee KS, Bae SH, Lee SH, Lee J, Lee DR. New reference data on bone min- eral density and the prevalence of osteoporosis in Korean adults aged 50 years or older: the Korea National Health and Nutrition Examination Sur- vey 2008-2010. J Korean Med Sci 2014; 29: 1514-22.
33. Yenchek RH, Ix JH, Shlipak MG, Bauer DC, Rianon NJ, Kritchevsky SB, Harris TB, Newman AB, Cauley JA, Fried LF; Health, Aging, and Body Composition Study. Bone mineral density and fracture risk in older indi- viduals with CKD. Clin J Am Soc Nephrol 2012; 7: 1130-6.
34. Bucur RC, Panjwani DD, Turner L, Rader T, West SL, Jamal SA. Low bone mineral density and fractures in stages 3-5 CKD: an updated systematic
review and meta-analysis. Osteoporos Int 2015; 26: 449-58.
35. Mirza MA, Karlsson MK, Mellström D, Orwoll E, Ohlsson C, Ljunggren O, Larsson TE. Serum fibroblast growth factor-23 (FGF-23) and fracture risk in elderly men. J Bone Miner Res 2011; 26: 857-64.
36. Duan Y, De Luca V, Seeman E. Parathyroid hormone deficiency and ex- cess: similar effects on trabecular bone but differing effects on cortical bone. J Clin Endocrinol Metab 1999; 84: 718-22.
37. Ott SM. Therapy for patients with CKD and low bone mineral density. Nat Rev Nephrol 2013; 9: 681-92.
38. Jamal SA, Gilbert J, Gordon C, Bauer DC. Cortical pQCT measures are asso-
ciated with fractures in dialysis patients. J Bone Miner Res 2006; 21: 543-8.
39. Liabeuf S, Desjardins L, Diouf M, Temmar M, Renard C, Choukroun G, Massy ZA. The addition of vascular calcification scores to traditional risk factors improves cardiovascular risk assessment in patients with chronic kidney disease. PLoS One 2015; 10: e0131707.
40. Roos CJ, Delgado V, de Koning EJ, Rabelink TJ, Jukema JW, Bax JJ, Scholte AJ. Associations of atherosclerosis in the descending thoracic aorta on CTA with arterial stiffness and chronic kidney disease in asymptomatic patients with diabetes mellitus. Int J Cardiovasc Imaging 2014; 30: 1151-9.