Knowledge and Perception about Clinical Research Shapes Behavior: Face to Face Survey in Korean General Public
Considering general public as potential patients, identifying factors that hinder public participation poses great importance, especially in a research environment where demands for clinical trial participants outpace the supply. Hence, the aim of this study was to evaluate knowledge and perception about clinical research in general public. A total of 400 Seoul residents with no previous experience of clinical trial participation were selected, as representative of population in Seoul in terms of age and sex. To minimize selection bias, every fifth passer-by was invited to interview, and if in a cluster, person on the very right side was asked. To ensure the uniform use of survey, written instructions have been added to the questionnaire. Followed by pilot test in 40 subjects, the survey was administered face-to-face in December 2014. To investigate how perception shapes behavior, we compared perception scores in those who expressed willingness to participate and those who did not. Remarkably higher percentage of responders stated that they have heard of clinical research, and knew someone who participated (both, P < 0.001) compared to India. Yet, the percentage of responders expressed willingness to participate was 39.3%, a significantly lower rate than the result of the India (58.9% vs. 39.3%, P < 0.001).
Treatment benefit was the single most influential reason for participation, followed by financial gain. Concern about safety was the main reason for refusal, succeeded by fear and lack of trust. Public awareness and educational programs addressing these negative perceptions and lack of knowledge will be effective in enhancing public engaged in clinical research.
Keywords: Clinical Research Perception; Clinical Trial Participation; Perception of Clinical Trial; Awareness of Clinical Trial; Patient Enrollment
Yun Jung Choi,1* Sung-Ho Beck,1* Woon Yong Kang,1 Soyoung Yoo,2 Seong-Yoon Kim,2,3 Ji Sung Lee,4 Tal Burt,5,6 and Tae Won Kim1,7
1Asan Medical Center, Clinical Trial Center, Seoul, Korea; 2Asan Medical Center, Human Research Protection Center, Seoul, Korea; 3Department of Psychiatry, Asan Medical Center, University of Ulsan College of Medicine, Seoul, Korea; 4Asan Medical Center, Clinical Research Center, Seoul, Korea; 5Duke Global Proof-of-Concept (POC) Research Network, Duke Clinical Research Unit (DCRU) & Duke Clinical Research Institute (DCRI), Duke University, Durham, NC, USA; 6Department of Psychiatry and Behavioral Sciences, Duke University, Durham, NC, USA;
7Department of Oncology, Asan Medical Center, University of Ulsan College of Medicine, Seoul, Korea
* Yun Jung Choi and Sung-Ho Beck contributed equally to this work.
Received: 24 August 2015 Accepted: 17 February 2016 Address for Correspondence:
Tae Won Kim, MD
Department of Oncology, Asan Medical Center, University of Ulsan College of Medicine, 88 Olympic-ro 43-gil, Songpa-gu, Seoul 05505, Korea
E-mail: [email protected]
Funding: This work was supported by a grant of the Korean Health Technology R&D Project, Ministry of Health & Welfare, Republic of Korea (grant number HI14C1731 and HI06C0868).
http://dx.doi.org/10.3346/jkms.2016.31.5.674 • J Korean Med Sci 2016; 31: 674-681
INTRODUCTION
Along with the development of medical science, medical cul- ture has evolved from empirical trial and error to an evidence- based model (1,2). With the aim of building on a secure scien- tific base, the clinical trial has become the gold standard for evaluating new treatment options (1,2), and data from such tri- als are compulsory worldwide for drug market access (3).
Although the United States have always been in the lead in terms of clinical research volume, some advances have been made in emerging countries, owing primarily to the growing interest of the pharmaceutical industry in globalization (4-7).
Estimates vary presumably due to consulting different regis- tries; however, previous research has confirmed a clear migra- tion of clinical trials to Asia, with the greatest absolute increase occurring in the period 2005 to 2012 (8). Approximately thirty
thousand clinical trials conducted in Asian countries are regis- tered in ClinicalTrials.gov, accounting for more than 17% of the total (9). It has been suggested that this shift to Asian countries is aimed at acquiring a larger patient pool to permit rapid en- rollment, thereby saving time and money (6).
Due to concerted efforts by the government, clinical trial vol- ume in Korea has increased over the last decade, with Seoul being cited as one of the most active cities for clinical trials (4).
To stimulate this process, the Korean Ministry of Health and Welfare established KoNECT (Korea National Enterprise for Clinical Trial), and a clinical trial infrastructure for new drug development was built around this national enterprise (4,10).
Public awareness plays an essential role in shaping regula- tions, ethical standards, and the research environment (11,12), making it important to promote awareness not only among pa- tients but also in the public at large. Despite a probable increase Medicine General & Social Medicine
of interest in clinical trials, the catastrophic stem cell scandal in 2005 (13) and the constant reports of fraud committed by phar- maceutical companies (14), may create a false picture of clini- cal trials that creates distrust and promotes an image of investi- gators and sponsors as exploitative, which could encourage op- position to clinical trials.
A few studies have been published addressing the awareness and perception of clinical trials in Korea (15,16) yet none of the studies were conducted in the general population. Public aware- ness and advocacy campaigns have been shown to be effective tools for increasing public awareness and clinical trial partici- pation (17,18). The PARTAKE survey described here is an early- stage approach to assessing public awareness and perception.
The PARTAKE survey was previously administered to 175 in- dividuals in India (12), and our study replicates the survey in the Korean population. Its aim was to assess the level of public awareness and perception of clinical trials among the Korean public at large, using a validated survey tool.
MATERIALS AND METHODS Survey instrument
The validity of the survey instrument was assessed by various methods, including review of the literature and consultation with experts (12). The instrument consists of 40 multiple choice and open-ended questions. It was forward translated into Ko- rean and independently checked for clarity and meaning by two national experts, who are both fluent in English and Kore- an. The translation was subsequently back-translated into Eng- lish and was confirmed to be equivalent to the original version.
Written instructions have been added to the questionnaire to ensure its uniform use. To minimize selection bias, every fifth passer-by was invited to interview, and if in cluster, person on the very right side was asked. It was administered face-to-face in December 2014, and the detailed procedures employed were identical to those of the survey conducted in India (12).
Subject selection
A proportional quota sampling method was used for subject enrollment; this is a standard tool for opinion polls, which al- lows subjects to be selected based on a range of demographic factors, and ensures that the sample interviewed is representa- tive of the population of interest. The quota sampling was done using a predetermined proportion of mutually exclusive sets for age, sex and residence area. The proportion of subset, the quo- ta, was determined by the demographic distribution of Seoul reported in the most recent census data (19).
Sample size calculation
The sample size was calculated from the single proportions sam- ple size formula using PASS 12 (NCSS, Kaysville, UT, USA). As-
suming fifty percent of the subjects understood the concept of clinical research, the sample size needed to achieve 5% preci- sion and 95% confidence limits was computed. To compensate for potential non-responders, we planned to enroll a total of 400 subjects.
Statistical analysis
Socio-demographics are summarized using descriptive statis- tics. The association between socio-demographic characteris- tics and clinical research perceptions were evaluated using the χ2 test, Fisher’s exact test or the independent t-test. The distribu- tion of responses between comparing groups was tested using χ2 goodness of fit. To assess the associations between clinical research perceptions and willingness to participate, perception scores were calculated for selected questions using defined stan- dards, by assigning 1 point for each appropriate response. Dif- ferences in levels of public awareness and perception between India and Korea were compared with the χ2 or independent t- test. There were no missing data. Statistical Software Package for Social Sciences (SPSS version 21.0; Chicago, IL, USA) was used for all statistical analyses, and the analysis was performed by an independent statistician.
Ethics statement
Ethical review and informed consent were exempted by the in- stitutional review board of Asan Medical Centre (IRB approval number: 2014-1061). Data were collected only from individuals who provided verbal informed consent and agreed to proceed.
Written consent was not obtained since the survey was anony- mous in order to provide access to as wide a public as possible.
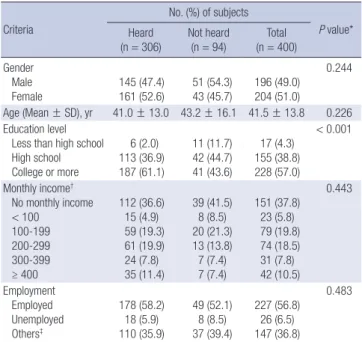
Table 1. General characteristics of the participants
Criteria
No. (%) of subjects
P value*
Heard
(n = 306) Not heard
(n = 94) Total (n = 400) Gender
Male Female
145 (47.4) 161 (52.6)
51 (54.3) 43 (45.7)
196 (49.0) 204 (51.0)
0.244
Age (Mean ± SD), yr 41.0 ± 13.0 43.2 ± 16.1 41.5 ± 13.8 0.226 Education level
Less than high school High school College or more
6 (2.0) 113 (36.9) 187 (61.1)
11 (11.7) 42 (44.7) 41 (43.6)
17 (4.3) 155 (38.8) 228 (57.0)
< 0.001
Monthly income† No monthly income < 100
100-199 200-299 300-399 ≥ 400
112 (36.6) 15 (4.9) 59 (19.3) 61 (19.9) 24 (7.8) 35 (11.4)
39 (41.5) 8 (8.5) 20 (21.3) 13 (13.8) 7 (7.4) 7 (7.4)
151 (37.8) 23 (5.8) 79 (19.8) 74 (18.5) 31 (7.8) 42 (10.5)
0.443
Employment Employed Unemployed Others‡
178 (58.2) 18 (5.9) 110 (35.9)
49 (52.1) 8 (8.5) 37 (39.4)
227 (56.8) 26 (6.5) 147 (36.8)
0.483
*P value by χ2 test or Student’s t-test as appropriate; †Units are 10,000 KRW/month;
‡Others include housewives and students.
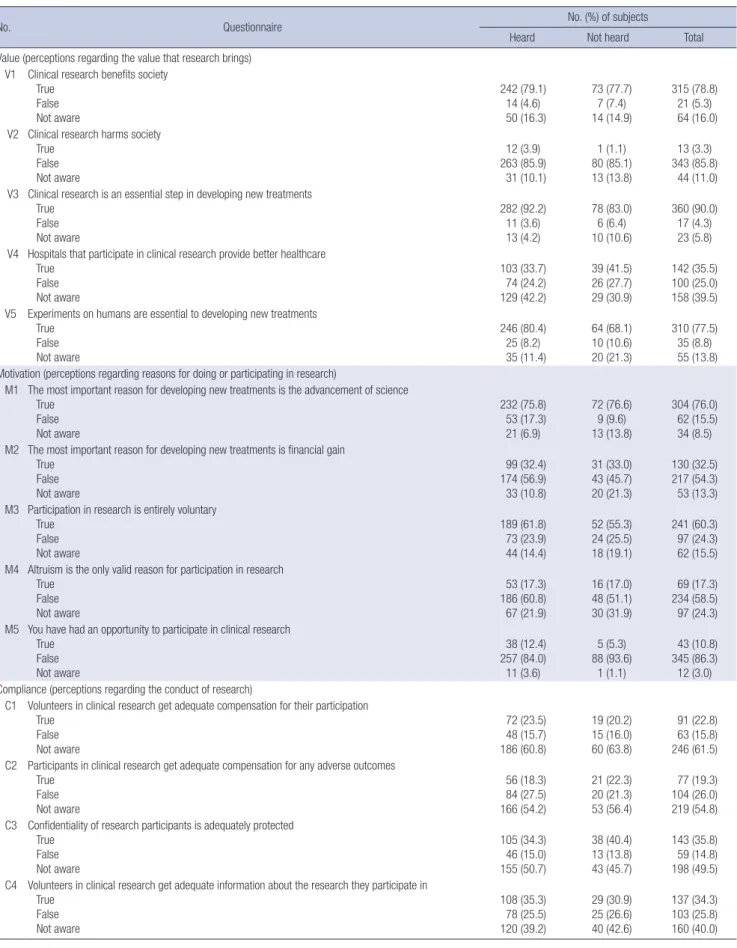
Table 2. Clinical research knowledge and perception in those who have heard and not heard about clinical research
No. Questionnaire No. (%) of subjects
Heard Not heard Total
Value (perceptions regarding the value that research brings) V1 Clinical research benefits society
True False Not aware
242 (79.1) 14 (4.6) 50 (16.3)
73 (77.7) 7 (7.4) 14 (14.9)
315 (78.8) 21 (5.3) 64 (16.0) V2 Clinical research harms society
True False Not aware
12 (3.9) 263 (85.9)
31 (10.1)
1 (1.1) 80 (85.1) 13 (13.8)
13 (3.3) 343 (85.8)
44 (11.0) V3 Clinical research is an essential step in developing new treatments
True False Not aware
282 (92.2) 11 (3.6) 13 (4.2)
78 (83.0) 6 (6.4) 10 (10.6)
360 (90.0) 17 (4.3) 23 (5.8) V4 Hospitals that participate in clinical research provide better healthcare
True False Not aware
103 (33.7) 74 (24.2) 129 (42.2)
39 (41.5) 26 (27.7) 29 (30.9)
142 (35.5) 100 (25.0) 158 (39.5) V5 Experiments on humans are essential to developing new treatments
True False Not aware
246 (80.4) 25 (8.2) 35 (11.4)
64 (68.1) 10 (10.6) 20 (21.3)
310 (77.5) 35 (8.8) 55 (13.8) Motivation (perceptions regarding reasons for doing or participating in research)
M1 The most important reason for developing new treatments is the advancement of science True
False Not aware
232 (75.8) 53 (17.3) 21 (6.9)
72 (76.6) 9 (9.6) 13 (13.8)
304 (76.0) 62 (15.5) 34 (8.5) M2 The most important reason for developing new treatments is financial gain
True False Not aware
99 (32.4) 174 (56.9) 33 (10.8)
31 (33.0) 43 (45.7) 20 (21.3)
130 (32.5) 217 (54.3) 53 (13.3) M3 Participation in research is entirely voluntary
True False Not aware
189 (61.8) 73 (23.9) 44 (14.4)
52 (55.3) 24 (25.5) 18 (19.1)
241 (60.3) 97 (24.3) 62 (15.5) M4 Altruism is the only valid reason for participation in research
True False Not aware
53 (17.3) 186 (60.8) 67 (21.9)
16 (17.0) 48 (51.1) 30 (31.9)
69 (17.3) 234 (58.5) 97 (24.3) M5 You have had an opportunity to participate in clinical research
True False Not aware
38 (12.4) 257 (84.0) 11 (3.6)
5 (5.3) 88 (93.6)
1 (1.1)
43 (10.8) 345 (86.3) 12 (3.0) Compliance (perceptions regarding the conduct of research)
C1 Volunteers in clinical research get adequate compensation for their participation True
False Not aware
72 (23.5) 48 (15.7) 186 (60.8)
19 (20.2) 15 (16.0) 60 (63.8)
91 (22.8) 63 (15.8) 246 (61.5) C2 Participants in clinical research get adequate compensation for any adverse outcomes
True False Not aware
56 (18.3) 84 (27.5) 166 (54.2)
21 (22.3) 20 (21.3) 53 (56.4)
77 (19.3) 104 (26.0) 219 (54.8) C3 Confidentiality of research participants is adequately protected
True False Not aware
105 (34.3) 46 (15.0) 155 (50.7)
38 (40.4) 13 (13.8) 43 (45.7)
143 (35.8) 59 (14.8) 198 (49.5) C4 Volunteers in clinical research get adequate information about the research they participate in
True False Not aware
108 (35.3) 78 (25.5) 120 (39.2)
29 (30.9) 25 (26.6) 40 (42.6)
137 (34.3) 103 (25.8) 160 (40.0) (Continued to the next page)
RESULTS
Subject characteristics
A total of 400 Seoul residents, aged between 20 and 69 years, with no previous experience of clinical trial participation respon- ded to the survey. The validity of the survey was confirmed by the coherent responses to opposing questions. Of the respon- dents, 76.5% reported to have heard of clinical research. No mean-
ingful differences between those who had heard and those who had not heard about clinical research were observed with re- spect to gender, age, monthly income and employment status, but disparities in educational level were apparent (Table 1).
Knowledge and perceptions of clinical research
Perceptions of clinical research were evaluated using 26 ques- tions that were designed to assess perceptions in four different
No. Questionnaire No. (%) of subjects
Heard Not heard Total
C5 Researchers make sure research is safe for participants True
False Not aware
143 (46.7) 49 (16.0) 114 (37.3)
38 (40.4) 13 (13.8) 43 (45.7)
181 (45.3) 62 (15.5) 157 (39.3) C6 Harmful events occurring during a clinical trial must be due to experimental treatment
True False Not aware
138 (45.1) 50 (16.3) 118 (38.6)
36 (38.3) 15 (16.0) 43 (45.7)
174 (43.5) 65 (16.3) 161 (40.3) C7 The public should be involved in clinical research (e.g., design, oversight, funding)
True False Not aware
160 (52.3) 72 (23.5) 74 (24.2)
46 (48.9) 21 (22.3) 27 (28.7)
206 (51.5) 93 (23.3) 101 (25.3) Trust (perceptions regarding trust of research entities)
T1 The government always adequately protects the public against unethical clinical research True
False Not aware
65 (21.2) 103 (33.7) 138 (45.1)
20 (21.3) 28 (29.8) 46 (48.9)
85 (21.3) 131 (32.8) 184 (46.0) T2 Clinical research information provided by pharmaceutical companies can be trusted
True False Not aware
81 (26.5) 102 (33.3) 123 (40.2)
29 (30.9) 29 (30.9) 36 (38.3)
110 (27.5) 131 (32.8) 159 (39.8) T3 Clinical research information provided by academic institutions can be trusted
True False Not aware
157 (51.3) 52 (17.0) 97 (31.7)
41 (43.6) 17 (18.1) 36 (38.3)
198 (49.5) 69 (17.3) 133 (33.3) T4 If you decide not to participate in research your doctor will not give you good care
True False Not aware
29 (9.5) 223 (72.9)
54 (17.6)
13 (13.8) 59 (62.8) 22 (23.4)
42 (10.5) 282 (70.5) 76 (19.0) T5 Doctors force their patients to participate in research
True False Not aware
31 (10.1) 185 (60.5) 90 (29.4)
7 (7.4) 62 (66.0) 25 (26.6)
38 (9.5) 247 (61.8) 115 (28.8) T6 Human participants in clinical research are treated like experimental animals (‘human Guinea Pigs’)
True False Not aware
44 (14.4) 150 (49.0) 112 (36.6)
13 (13.8) 47 (50.0) 34 (36.2)
57 (14.3) 197 (49.3) 146 (36.5) T7 Confidentiality is a matter of importance to research participants
True False Not aware
271 (88.6) 26 (8.5)
9 (2.9)
74 (78.7) 10 (10.6) 10 (10.6)
345 (86.3) 36 (9.0) 19 (4.8) T8 All the results of clinical research are made available to the public
True False Not aware
37 (12.1) 162 (52.9) 107 (35.0)
17 (18.1) 47 (50.0) 30 (31.9)
54 (13.5) 209 (52.3) 137 (34.3) T9 The media accurately describes clinical research
True False Not aware
52 (17.0) 132 (43.1) 122 (39.9)
25 (26.6) 35 (37.2) 34 (36.2)
77 (19.3) 167 (41.8) 156 (39.0) Table 2. Continued
Table 3. Difference between those who have heard and not heard about clinical research
Attitude parameters Heard Not heard Total P value*
Expressed willingness to participate, No. (%) 136 (44.4) 21 (22.3) 157 (39.3) 0.001
Trust perception score (mean ± SD) 2.36 ± 1.48 2.26 ± 1.61 2.33 ± 1.51 0.571
Ethics perception score (mean ± SD) 3.42 ± 1.42 3.39 ± 1.53 3.41 ± 1.44 0.900
*P value by χ2 test or Student’s t-test as appropriate.
Table 4. Difference in trust and ethic perception scores between those who ex- pressed willingness to participate and those who have not
Category Knowledge score (mean ± SD)
Expressed willingness to participate
Yes No Total P value*
Total Trust
Ethics
2.76 ± 1.63 3.71 ± 1.37
2.05 ± 1.35 3.21 ± 1.46
2.33 ± 1.51 3.41 ± 1.44
< 0.001
< 0.001
Heard Trust
Ethics 2.76 ± 1.58
3.73 ± 1.38 2.04 ± 1.31
3.16 ± 1.40 2.36 ± 1.48 3.42 ± 1.42 < 0.001
< 0.001 Not heard Trust
Ethics 2.81 ± 1.97
3.62 ± 1.28 2.10 ± 1.46
3.33 ± 1.59 2.26 ± 1.61 3.39 ± 1.53 0.073
0.445
*P value by Student’s t-test.
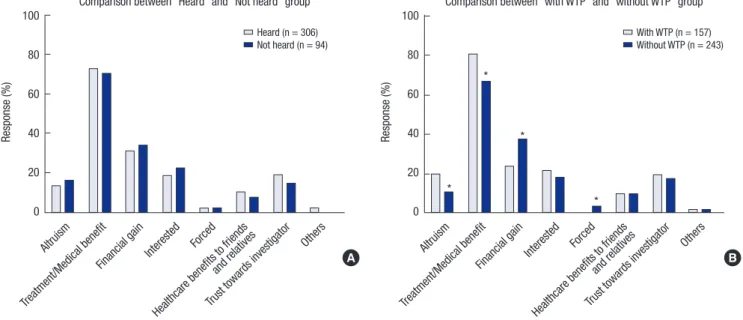
Fig. 1. Reason for participation (multiple responses). P value by χ2 test or Fisher’s exact test as appropriate. *P < 0.05. WTP, willingness to participate.
Response (%)
Altruism
Treatment/Medical benefit
Financial gainInterested Forced
Healthcare benefits to friends and rela
tives
Trust to wards investiga
tor Others 100
80
60
40
20
0
Comparison between “Heard” and “Not heard” group
Heard (n = 306) Not heard (n = 94)
Response (%)
Altruism
Treatment/Medical benefit
Financial gain Interested Forced
Healthcare benefits to friends and rela
tives
Trust to wards investiga
tor Others 100
80
60
40
20
0
Comparison between “with WTP” and “without WTP” group
*
*
*
*
With WTP (n = 157) Without WTP (n = 243)
A B
categories. Each of the category is to see the perceptions of trust of the research entities, conduct of research, reasons for doing or participating in research and the value that research brings (Table 2). In the questions evaluating perceptions of the value of research, the distributions of responses to two of the five ques- tions, V3 and V5, differed between the “heard” and the “not heard” group. The distributions of the responses to M1 and M2 were also discordant, whereas perceptions regarding the con- duct of research were similar in the two groups. The distribu- tion of response to all but one of the question appraising per- ceptions of trust in research entities also did not differ. The one exception was a question about confidentiality (T7).
Trust perception scores were calculated based on the respons- es to T1, T2, T3, T4, T9, and C5, as these questions were consid- ered to be directly related to trust in research entities such as the government, pharmaceutical companies, academic institu- tions and investigators, and their advocacy groups. The ethics perception score was based on responses to M3, C3, C4, T5, T6, T7, T8, and T9, since these related to the ethical standards that research entities should maintain. No remarkable differences in trust and ethics perception scores were found between the
“heard” and “not heard” groups (Table 3).
Further analysis of willingness to participate revealed a posi- tive association with both perception scores in the “heard” group
but not in the “not heard” group (Table 4).
Reasons for participation or refusal
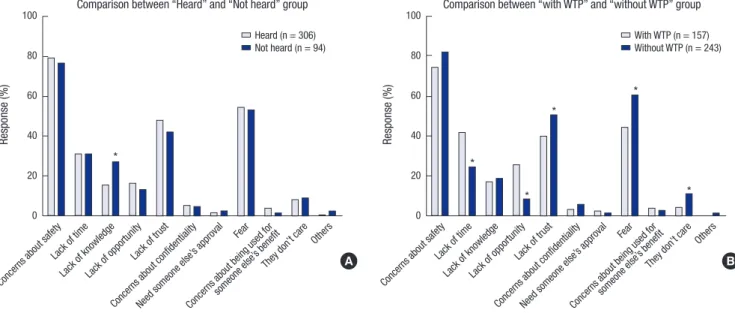
No notable differences in the reasons given for clinical research participation were seen between the two groups (Fig. 1). The proportion of subjects who gave altruism, or treatment/medi- cal benefits, as the reason for participation in clinical research was lower in the subjects not willing to participate than in those willing to participate, and financial gain, and being obliged to do so was higher among those not willing to participate. Treat- ment benefit was the single most influential reason for partici- pation, followed by financial gain. The reasons for refusal were similar in the “heard” and “not heard” group, except for lack of
knowledge (Fig. 2). The proportion of subjects who gave lack of time or lack of opportunity as the reason for refusal was lower among the “not willing” subjects while lack of trust, fear, and not caring were higher among these subjects. Thus, concerns about safety was the main reason for refusal, followed by fear and lack of trust.
Sources of clinical research information
The most trusted source of clinical research information was analysed. Academia was shown to be the single most trusted source, followed by medical doctors (Fig. 3).
Differences between India and Korea
Compared to the Indian experience, a much higher percentage of the respondents stated that they had heard of clinical research or knew someone who had participated. Nevertheless the per- centage of responders expressing willingness to participate was only 39.3%, significantly lower than in India (Table 5).
DISCUSSION
The purpose of this survey was to evaluate levels of public aware- ness and perception of clinical research in the Korean public at large, focusing on non-participants in clinical trials. This is the first study to evaluate knowledge and perception about clinical research among Korean individuals without previous experi- ence of clinical research participation, using a validated survey tool.
In general the survey participants had a positive view of clini- cal research (78.8%). The overwhelming majority of participants, greater than 76%, indicated that they had heard about clinical research. This figure agrees with an unpublished national re- port issued by the Korea Centers for Disease Control and Pre- vention (KCDC) in 2009, in which approximately 70% of the general public said that they had heard of clinical research (20).
This speaks for the growing interest of the public in clinical re- search, as well as for the unique distribution of clinical research infrastructure in Korea, where most clinical research takes place in Seoul (21).
The proportion of subject expressed willingness to partici- pate in clinical research was 39.3%, which is far below the rate in India (12). Although a number of explanations are possible, given that a large proportion of the subjects not willing to par- Fig. 2. Reason for refusal (multiple responses). P value by χ2 test or Fisher’s exact test as appropriate. *P < 0.05. WTP, willingness to participate.
A
Response (%)
Concerns about safety Lack of time
Lack of kno wledge Lack of opportunity
Lack of trust
Concerns about confidentialityNeed someone else’
s approval Fear
Concerns about being used for someone else’
s benefit They don’t care
Others 100
80 60 40 20 0
Comparison between “Heard” and “Not heard” group
Heard (n = 306) Not heard (n = 94)
*
Comparison between “with WTP” and “without WTP” group
With WTP (n = 157) Without WTP (n = 243)
B
Response (%)
Concerns about safety Lack of time
Lack of kno wledge Lack of opportunity
Lack of trust
Concerns about confidentialityNeed someone else’
s approval Fear
Concerns about being used for someone else’
s benefit They don’t care
Others 100
80 60 40 20 0
*
*
*
*
*
Fig. 3. Most trusted source of clinical research information.
Source of clinical trial information
Reponse (%)
0 20 40 60 Others
Nurse Public leader Pharmacist Media Pharmaceutical company Medical doctor Government Academia
Table 5. Comparison between India and Korea on exposure to clinical trial and will- ingness to participate
Participation attitude India Korea P value*
Had heard of clinical research 26.3% 76.5% < 0.001 Knew someone who participated 8.6% 17.0% < 0.001 Expressed willingness to participate 58.9% 39.3% < 0.001
*P value by χ2 goodness of fit tests.
ticipate gave a lack of trust, and fear, as reasons for refusal, a lack of belief in clinical research entities may have been primar- ily responsible for this result. According to a survey of the gen- eral public and patients, endorsed by CISCRP (The Center for Information & Study on Clinical Research Participation), the top two ranked sources of clinical research information are the internet and media (22). It is well known that the media are a primary source of information about what happens in the world, especially in those areas where direct access to information is not feasible (23). Since Korea is a country with one of the high- est internet and smart phone penetrations (24), the relatively low proportion of responders expressing willingness to partici- pate may be partly attributed to how the internet and media shape public perceptions and attitudes.
Although head-to-head comparisons may not be appropri- ate due to the different measurements used, there seems to be some relation between clinical trial awareness and willingness to participate, since two similarly designed studies among Ko- rean cancer patients led to the same conclusions as our study (15,16). The study by Lee et al. (16) demonstrated that patients with previous experience of clinical trials expressed greater will- ingness to participate in future. Moreover the greater willing- ness to participate among patients who were aware of clinical trials in the study by Kim et al. (15) adds weight to the positive association between clinical trial awareness and willingness to participate. In line with this conclusion, we found that a higher percentage of the subjects in the “heard” group expressed a will- ingness to participate than in the “not heard” group.
To investigate how perception shapes behavior, we compared perception scores in those who expressed willingness to partic- ipate and those who did not. Both trust perception scores and ethics perception scores were shown to be related to willing- ness to participate. Surprisingly, these associations only existed in the “heard” group, and no notable correlation was observed in the “not heard” group. This raises the possibility that infor- mation about clinical research may not be regarded as mean- ingful unless the individual involved has already heard about clinical research.
Unlike India where altruism was the single most influential reason given for participation (12), treatment/medical benefit was the main reason for participation in clinical research in our study, and this is in agreement with studies performed in the patient population (15,16). Concern over safety was the main reason for refusal, and in line with this, subjects who answered yes to “Researchers make sure research is safe for participants”
tended to express willingness to participate in clinical research.
A similar conclusion was suggested in a previous study by the KCDC (20), where a lack of trust in government, the pharma- ceutical industry, and researchers were noted. These findings imply a need for public awareness and educational programs to reverse negative perceptions of clinical research.
This study has several limitations. The respondents were all Seoul residents, and may not be representative of the awareness and perception of the Korean public in general. The results might have been more reliable if we had assessed in-depth knowledge about clinical research. Also, the comparison with India should be treated with caution, due to differences in demographic char- acteristics.
The majority of participant had a positive view of clinical re- search, and a substantial proportion of the respondents indi- cated that they had heard of clinical research. The results sug- gest that the main features of clinical research are well under- stood among the Korean public in terms of the research pur- pose, value, and the voluntary nature of participation. However, there was substantial distrust of clinical research. Public aware- ness and educational programs addressing these negative per- ceptions and lack of knowledge could be an effective tool in en- hancing public engaged in clinical research.
DISCLOSURE
No financial relationships with any organizations that might have an interest in the submitted work; no other relationships or activities that could appear to have influenced the submitted work.
AUTHOR CONTRIBUTION
Study design: all authors. Acquisition of data: all authors. Statis- tical analysis and interpretation of data: Lee JS. Writing the draft:
Choi YJ. Revision of manuscript: Kim TW, Beck SH, Kang WY, Yoo S, Kim SY, Burt T. Approval of the final version: all authors.
ORCID
Yun Jung Choi http://orcid.org/0000-0002-1648-9264 Sung-Ho Beck http://orcid.org/0000-0003-4540-3041 Woon Yong Kang http://orcid.org/0000-0002-4839-5342 Soyoung Yoo http://orcid.org/0000-0002-2953-508X Seong-Yoon Kim http://orcid.org/0000-0002-1077-6289 Ji Sung Lee http://orcid.org/0000-0001-8194-3462 Tal Burt http://orcid.org/0000-0002-5853-6110 Tae Won Kim http://orcid.org/0000-0001-9522-1997
REFERENCES
1. Hussain-Gambles M, Atkin K, Leese B. South Asian participation in clini- cal trials: the views of lay people and health professionals. Health Policy 2006; 77: 149-65.
2. Rogers WA. Evidence based medicine and justice: a framework for look- ing at the impact of EBM upon vulnerable or disadvantaged groups. J Med Ethics 2004; 30: 141-5.
3. Lang T, Siribaddana S. Clinical trials have gone global: is this a good thing?
PLoS Med 2012; 9: e1001228.
4. George M, Selvarajan S, S SK, Dkhar SA, Chandrasekaran A. Globaliza- tion of clinical trials - where are we heading? Curr Clin Pharmacol 2013;
8: 115-23.
5. Casas JP, Cubillos-Garzón LA, Morillo CA. Regional pathologies and glo- balization of clinical trials: has the time for regional trials arrived? Circu- lation 2003; 107: e194.
6. Glickman SW, McHutchison JG, Peterson ED, Cairns CB, Harrington RA, Califf RM, Schulman KA. Ethical and scientific implications of the global- ization of clinical research. N Engl J Med 2009; 360: 816-23.
7. Thiers FA, Sinskey AJ, Berndt ER. Trends in the globalization of clinical trials. Nat Rev Drug Discov 2008; 7: 13-4.
8. Drain PK, Robine M, Holmes KK, Bassett IV. Trial watch: global migration of clinical trials. Nat Rev Drug Discov 2014; 13: 166-7.
9. ClinicalTrials.gov (US). See studies on map. Available at https://clinical- trials.gov/ct2/search/map [accessed on 5 January 2015].
10. Korea National Enterprise for Clinical Trials. Available at http://www.ko- nect.or.kr/ [accessed on 20 October 2014].
11. Woolley M, Propst SM. Public attitudes and perceptions about health-re- lated research. JAMA 2005; 294: 1380-4.
12. Burt T, Dhillon S, Sharma P, Khan D, Mv D, Alam S, Jain S, Alapati B, Mittal S, Singh P. PARTAKE survey of public knowledge and perceptions of clini- cal research in India. PLoS One 2013; 8: e68666.
13. van der Heyden MA, van de Ven T, Opthof T. Fraud and misconduct in science: the stem cell seduction: implications for the peer-review process.
Neth Heart J 2009; 17: 25-9.
14. Hvistendahl M. Drug development. Corruption and research fraud send big chill through big pharma in China. Science 2013; 341: 445-6.
15. Kim JW, Kim SJ, Chung YH, Kwon JH, Lee HJ, Chung YJ, Kim YJ, Oh DY, Lee SH, Kim DW, et al. Cancer patients’ awareness of clinical trials, per- ceptions on the benefit and willingness to participate: Korean perspec-
tives. Br J Cancer 2008; 99: 1593-9.
16. Lee SJ, Park LC, Lee J, Kim S, Choi MK, Hong JY, Park S, Maeng CH, Chang W, Kim YS, et al. Unique perception of clinical trials by Korean cancer patients. BMC Cancer 2012; 12: 594.
17. Michaels M, Weiss ES, Guidry JA, Blakeney N, Swords L, Gibbs B, Yeun S, Rytkonen B, Goodman R, Jarama SL, et al. “The promise of community- based advocacy and education efforts for increasing cancer clinical trials accrual”. J Cancer Educ 2012; 27: 67-74.
18. Mackenzie IS, Wei L, Rutherford D, Findlay EA, Saywood W, Campbell MK, Macdonald TM. Promoting public awareness of randomised clinical trials using the media: the ‘Get Randomised’ campaign. Br J Clin Phar- macol 2010; 69: 128-35.
19. Seoul Metropolitan Government. Seoul statistics by category: population.
Available at http://english.seoul.go.kr/get-to-know-us/statistics-of-seoul/
seoul-statistics-by-category/ [accessed on 20 October 2014].
20. Korea Centers for Disease Control and Prevention. Attitudes and Percep- tions of Clinical Trials in Public: Results from a Population-Based Survey [Unpublished Report]. Cheongwon: Korea Centers for Disease Control and Prevention, 2009, 1-4.
21. Abbott D, Califf R, Morrison BW, Pierre C, Bolte J, Chakraborty S. Cycle time metrics for multisite clinical trials in the United States. Ther Innov Regul Sci 2013; 47: 152-60.
22. The Center for Information and Study on Clinical Research Participation (US). 2013 International Survey on Public and Patient Attitudes about, and Experiences with, Clinical Research Studies [Unpublished Report].
Boston, MA: The Center for Information and Study on Clinical Research Participation, 2013.
23. Happer C, Philo G. The role of the media in the construction of public be- lief and social change. J Soc Polit Psychol 2013; 1: 321-36.
24. Kim H. Exercise rehabilitation for smartphone addiction. J Exerc Rehabil 2013; 9: 500-5.