Development and Progression of Diabetic Retinopathy and
Associated Risk Factors in Korean Patients with Type 2 Diabetes:
The Experience of a Tertiary Center
The aim of this study was to evaluate the incidence of and risk factors for the development of diabetic retinopathy (DR) and progression to proliferative DR (PDR) in Korean patients.
Patients diagnosed with type 2 diabetes and followed for more than 5 years at a university- based clinic since 2000 were consecutively enrolled in this retrospective cohort study. Based on the DR classification at the initial and final visits, the incidence and progression of DR was determined and patient characteristics were compared according to DR progression.
Hazard ratios of each putative risk factor for DR progression were calculated with a multivariate Cox proportional hazard model. Rate of DR development and progression to PDR were 32.1/1,000 and 26.2/1,000 person-years, respectively. A longer duration of diabetes and higher mean HbA1c level were significant risk factors for the development of DR. Regarding progression to PDR, higher mean HbA1c level, higher standard deviation of HbA1c, and higher urine albumin-to-creatinine ratio were significant risk factors. The rates of development of DR and progression to PDR in Koreans with type 2 diabetes are lower than those reported over the last decade. An inadequate blood glycemic control is the common risk factor for development and progression of DR.
Keywords: Diabetic Retinopathy; Koreans; Diabetes Mellitus, Type 2 Yoon Jeon Kim,1 June-Gone Kim,1
Joo Yong Lee,1 Kyoung Sub Lee,1 Soo Geun Joe,1 Joong-Yeol Park,2 Min-Seon Kim,2 and Young Hee Yoon1 Departments of 1Ophthalmology, 2Endocrinology, University of Ulsan College of Medicine, Asan Medical Center, Seoul, Korea
Received: 4 May 2014 Accepted: 12 August 2014 Address for Correspondence:
Young Hee Yoon, MD
Department of Ophthalmology, University of Ulsan, College of Medicine, Asan Medical Center, 88 Olympic-ro 43-gil, Songpa-gu, Seoul 138-736, Korea
Tel: +82.2-3010-3680, Fax: +82.2-470-6440 E-mail: [email protected]
Funding: This work was supported by the Asan Institute for Life Science (08-084).
http://dx.doi.org/10.3346/jkms.2014.29.12.1699 • J Korean Med Sci 2014; 29: 1699-1705
INTRODUCTION
Diabetes mellitus (DM) is a major health problem worldwide, and is one of the most common and rapidly increasing chronic diseases. The prevalence of diabetes for all age groups world- wide was estimated to be 2.8% in 2000 and is predicted to reach 4.4% in 2030, meaning that the total number of people with dia- betes is projected to rise from 171 million in 2000 to 366 million in 2030 (1). This increasing prevalence is due to an aging popu- lation, changes in lifestyle with economic development, and in- creasing rates of obesity associated with decreased physical ac- tivity (2). The prevalence of diabetes has also increased rapidly in Korea. Estimated to be 7.6% in 2001, the prevalence of diabe- tes rose to 9.1% of the adult population according to an analysis of the 2005 Korea National Health and Nutrition Examination Survey (KNHANES), with a prevalence of impaired fasting glu- cose of 17.4% (3). The economic burden continues to rise and, according to the KNHANES, the aggregate annual direct cost of diabetes in Korea was 260 million USD in 2009 (4, 5).
Diabetes is always associated with long-term complications.
Diabetic retinopathy (DR) is the leading cause of blindness among working-aged adults worldwide. The prevalence of any DR and vision-threatening DR were variably reported as 15.8%-
46.9% and 4.6%–10%, respectively, showing that considerable numbers of patients are at risk of DR (6). Although early retinop- athy does not have a significant effect on vision, it can progress to a more advanced stage, termed proliferative DR (PDR), put- ting patients at a substantially increased risk of serious compli- cations that can result in permanent vision loss. Therefore, pre- vention, early detection, and effective management of DR and the identification of associated risk factors are very important for diabetes care to improve public health and ease the financial burden (5).
Several large population-based studies, including the Diabe- tes Control and Complications Trial (DCCT), the UK Prospective Diabetes Study (UKPDS), the Wisconsin Epidemiologic Study of Diabetic Retinopathy (WESDR), and the Action to Control Car- diovascular Risk in Diabetes (ACCORD) study, have identified other risk factors associated with the development or progres- sion of DR (7-11). From the results of these studies, age, sex, so- cioeconomic status, and comorbid systemic arterial hyperten- sion are considered important determinants of retinopathy risk.
On the other hand, one study showed that metabolic control as measured by HbA1c and disease duration accounts for only 11%
of the risk of DR, leaving 89% of the risk of the development of DR to other factors (12). As these variables are time and ethnici- Ophthalmology
ty dependent (13), an analysis based on recent data in Koreans is required. Although there have been several cross-sectional studies regarding the prevalence and associated risk factors in Korea (6, 14, 15), cohort studies on the development and pro- gression of DR in recent decades are not available, to our knowl- edge. The purpose of this study was to explore the incidence of and risk factors for the development of DR and progression to PDR in Korean patients with type 2 DM since 2000.
MATERIALS AND METHODS
Patients who were diagnosed with type 2 DM and followed for more than 5 yr annually or more often at a hospital-based dia- betic clinic (Asan Medical Center, Seoul, Korea) were selected by medical record review in a consecutive manner. In this retro- spective cohort study, patients with PDR at the initial examina- tion, with concomitant ocular disease other than DR, or history of ocular trauma or intraocular surgery were excluded. If the pa- tient became pregnant or underwent intravitreal anti-vascular endothelial growth factor (VEGF) or steroid injections, only data obtained during the period before the event were analyzed. At baseline, a detailed medical history, including previous treat- ment for diabetes, hypertension, smoking habits, and alcoholic intake, was taken. At baseline and every visit, arterial blood pres- sure (BP), body weight, and height were measured, and blood tests, including plasma glucose, HbA1c, and lipid profiles, were performed. Urine tests were also performed and urine albumin- to-creatinine ratios (UACR) were used in the analysis. Body weight and height were used to calculate the body mass index (BMI), which was used for analysis; diabetes medication infor- mation was described. Patients were followed every 3 or 6 months depending on their glucose control.
At their initial visit and at each visit to a retina clinic, all pa- tients underwent a comprehensive ophthalmologic examina- tion that included a review of their ophthalmologic history, mea- surement of visual acuity and intraocular pressure (IOP), slit lamp biomicroscopy, and funduscopic examinations through dilated pupils by retinal specialists. DR was evaluated on the basis of fundus photography taken on every patient at every visit. When necessary, fluorescein angiography was performed to assess vascular abnormalities and the extent of the capillary nonperfusion area. The frequency of the eye examination was at least once a year or more, determined by the ophthalmolo- gist depending on the degree of DR. The degree of DR was clas- sified into 5 stages by the following criteria of the Early Treat- ment Diabetic Retinopathy Study (ETDRS): 1) no diabetic reti- nopathy—“no DR”; 2) mild nonproliferative diabetic retinopa- thy—“mild NPDR”; 3) moderate nonproliferative diabetic retino- pathy—“mo derate NPDR”; 4) severe nonproliferative diabetic retinopathy—“severe NPDR”; and 5) proliferative diabetic reti- nopathy—“PDR”. If both eyes were rated at different stages, the
grade of the worse eye was used.
Based on the DR classification at the initial and final visits, the development of DR and progression to PDR were defined as follows: 1) the development of any type of DR in the patients who were free of DR at baseline—“development of DR”; and 2) the progression to PDR in patients who had NPDR at baseline—
“progression to PDR”. The incidences of the development of DR and progression to PDR were defined as the number of patients with those events divided by the total sum of person-years of the follow-up period.
Statistical analysis
Patients with no DR and NPDR at baseline were divided into 2 groups according to the development of DR and progression to PDR, respectively. Descriptive statistics (number and percent- age of each categorical variable and the mean ± standard devia- tion [SD] of each continuous variable) were evaluated to deter- mine the demographic and ocular baseline characteristics of each group. As for repeatedly measured medical values, both the baseline value and the mean during the follow-up period were used in the analysis. To analyze the long-term fluctuation of blood glucose, the SDs of all HbA1c measurements were cal- culated in each patient. Normally distributed data were com- pared between the 2 groups by using an unpaired t-test. Non- normally distributed data were compared using a Mann-Whit- ney U test. To compare categorical data, the chi-square test of the Fisher’s exact test was used as appropriate on the basis of the data distribution. Hazard ratios (HRs) for associations among potential risk factors for the development of DR and progression to PDR were obtained using a Cox’s proportional hazards mod- el. Univariate analyses were performed separately for each vari- able. Variables with a probability value of 0.2 in univariate analy- sis were considered significant and were included in a multivari- ate Cox proportional hazards model. A backward elimination process was used to develop the final multivariate model, and adjusted HRs with 95% confidence intervals (CIs) were calculat- ed. Schoenfeld residuals and the log (-log [survival rate]) test were used to verify that proportional hazards assumptions were not violated. Model fit was assessed using residual analyses. All statistical analyses were performed using SAS version 9.1 soft- ware (SAS Institute Inc., Cary, NC, USA) and SPSS version 18.0 software (SPSS Inc., Chicago, IL, USA).
Ethics statement
This study was approved by the institutional review board of Asan Medical Center, University of Ulsan (IRB No. 2014-0124).
RESULTS
Cohort characteristics
A cohort consisting of 452 patients was developed which con-
secutively enrolled Korean patients diagnosed with type 2 DM and followed them for more than 5 yr. Among them, 371 patients were included in the final analysis, excluding 49 patients with PDR (10.8%) and 32 patients with history of intraocular surgery (7.1%). The mean patient age at baseline was 56.2 ± 12.2 yr (range, 34-75) and the mean follow-up period was 6.2 ± 1.9 yr (range, 5.0-13.0). At baseline, 140 patients showed no DR (37.7%), and 152 (41.0%), 40 (10.8%), and 39 (10.5%) patients showed mild NPDR, moderate NPDR, and severe NPDR, re- spectively. At the last follow-up, 110 patients remained in the no DR group (29.6%), and 104 (28.0%), 75 (20.2%), 45 (12.1%), and 37 (10.0%) patients showed mild NPDR, moderate NPDR, se- vere NPDR, and PDR, respectively (Fig. 1). Of 45 patients with severe NPDR at the last follow-up, 23 patients (51.1%) under- went panretinal photocoagulation during the follow-up period.
During the cohort period, 1 patient became pregnant and 43 pa- tients underwent intravitreal anti-VEGF or steroid injections. For
these 44 patients, thus, only the data previous to the events were included in the analysis.
The rate of development of DR and associated risk factors Of 140 patients who had no DR at baseline, 30 developed DR in 6.6 ± 1.6 yr of follow-up, resulting in a rate of development of DR of 32.1/1,000 person-years. Among 30 patients who devel- oped DR, 16 (53.3%), 9 (30%), 3 (10%), and 2 (6.7%) patients progressed to mild NPDR, moderate NPDR, severe NPDR, and PDR, respectively. When the clinical characteristics were com- pared between the 2 groups in terms of the development of DR, the duration of diabetes at baseline was significantly longer in patients who developed DR (P < 0.001; Table 1). Regarding HbA1c, the baseline value (P = 0.155) and the SD of data ob- tained during the follow-up period (not shown in Table: 1.3 ± 0.9 vs. 1.1 ± 0.8 [developed DR vs. remained normal], P = 0.162) did not differ between the 2 groups. The mean during the follow- up period was higher in patients who developed DR (P = 0.045).
In multivariate Cox proportional hazards analysis, a longer du- ration of diabetes (HR = 1.130, P = 0.010) and a higher mean HbA1c level (HR = 1.163, P = 0.006) were significant risk factors for the development of DR (Table 2). None of age, BP, cholester- ol, triglycerides, HDL, and LDL cholesterol variables was a sig- nificant risk factor for development of DR.
The rate of progression to PDR and associated risk factors Of 231 patients who had NPDR at baseline, 35 developed PDR in 5.6 ± 2.9 yr of follow-up, resulting in a rate of progression to PDR of 26.2/1,000 person-years. Besides, among 140 patients who were free of DR at baseline, 2 progressed to PDR in 8 and 9.5 yr of follow-up. In a comparison between nonprogressors and progressors, progressors had a higher UACR at baseline
Cumulative lncidence rate (%)
Year of follow-up
0 5 10 15 100
80
60
40
20
0
Development of DR Progression to PDR
Fig. 1. Kaplan-Meier plot showing the cumulative incidence rate of development of DR and progression to PDR during follow-up.
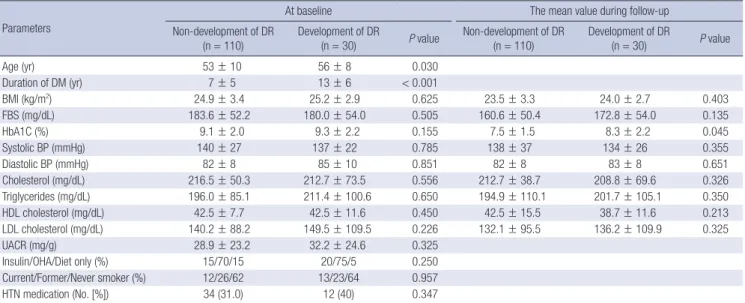
Table 1. Comparison of clinical characteristics between the 2 groups in terms of the development of diabetic retinopathy (DR)
Parameters
At baseline The mean value during follow-up
Non-development of DR
(n = 110) Development of DR
(n = 30) P value Non-development of DR
(n = 110) Development of DR
(n = 30) P value
Age (yr) 53 ± 10 56 ± 8 0.030
Duration of DM (yr) 7 ± 5 13 ± 6 < 0.001
BMI (kg/m2) 24.9 ± 3.4 25.2 ± 2.9 0.625 23.5 ± 3.3 24.0 ± 2.7 0.403
FBS (mg/dL) 183.6 ± 52.2 180.0 ± 54.0 0.505 160.6 ± 50.4 172.8 ± 54.0 0.135
HbA1C (%) 9.1 ± 2.0 9.3 ± 2.2 0.155 7.5 ± 1.5 8.3 ± 2.2 0.045
Systolic BP (mmHg) 140 ± 27 137 ± 22 0.785 138 ± 37 134 ± 26 0.355
Diastolic BP (mmHg) 82 ± 8 85 ± 10 0.851 82 ± 8 83 ± 8 0.651
Cholesterol (mg/dL) 216.5 ± 50.3 212.7 ± 73.5 0.556 212.7 ± 38.7 208.8 ± 69.6 0.326
Triglycerides (mg/dL) 196.0 ± 85.1 211.4 ± 100.6 0.650 194.9 ± 110.1 201.7 ± 105.1 0.350
HDL cholesterol (mg/dL) 42.5 ± 7.7 42.5 ± 11.6 0.450 42.5 ± 15.5 38.7 ± 11.6 0.213
LDL cholesterol (mg/dL) 140.2 ± 88.2 149.5 ± 109.5 0.226 132.1 ± 95.5 136.2 ± 109.9 0.325
UACR (mg/g) 28.9 ± 23.2 32.2 ± 24.6 0.325
Insulin/OHA/Diet only (%) 15/70/15 20/75/5 0.250
Current/Former/Never smoker (%) 12/26/62 13/23/64 0.957
HTN medication (No. [%]) 34 (31.0) 12 (40) 0.347
DM, diabetes mellitus; BMI, body mass index; FBS, fasting blood sugar; BP, blood pressure; HDL, high-density lipoprotein; LDL, low-density lipoprotein; UACR, urine albumin-to- creatinine ratio; OHA, oral hypoglycemic agent; HTN, hypertension.
than nonprogressors (P < 0.001) (Table 3). Regarding HbA1c, the baseline value did not differ between the 2 groups, such as in terms of the progression to PDR (P = 0.195). However, the mean (P = 0.015) and the SD (not shown in Table: 1.6 ± 1.0 vs.
1.2 ± 0.7 [progressors vs. non-progressors]) of the HbA1c data obtained during the follow-up period were higher in patients who progressed to PDR. In multivariate Cox proportional haz- ards analysis, a higher mean HbA1c level (HR = 1.190, P = 0.005), a higher SD of HbA1c (HR = 1.160, P = 0.020), and a higher UACR
(HR = 1.224, P = 0.004) were significant risk factors for progres- sion to PDR (Table 2). None of age, BP, cholesterol, triglycerides, HDL, and LDL cholesterol variables was a significant risk factor for progression to PDR.
DISCUSSION
In our current study, the development of DR and progression to PDR and associated risk factors in Koreans were examined Table 3. Comparison of clinical characteristics between the 2 groups in terms of the progression to proliferative diabetic retinopathy (PDR)
Parameters
At baseline The mean value during follow-up
Non-progression to PDR
(n = 196) Progression to PDR
(n = 35) P value Non-progression to PDR
(n = 196) Progression to PDR
(n = 35) P value
Age (yr) 58 ± 10 56 ± 11 0.533
Duration of DM (yr) 15 ± 13 18 ± 11 0.230
BMI (kg/m2) 23.9 ± 3.1 23.2 ± 2.9 0.729 23.7 ± 3.3 22.6 ± 2.5 0.725
FBS (mg/dL) 201.6 ± 70.2 208.8 ± 66.6 0.466 165.6 ± 63.0 173.8 ± 72.2 0.155
HbA1C (%) 9.2 ± 2.4 9.5 ± 2.7 0.195 7.9 ± 2.2 8.9 ± 2.9 0.015
Systolic BP (mmHg) 143 ± 37 140 ± 29 0.685 138 ± 37 134 ± 26 0.355
Diastolic BP (mmHg) 85 ± 17 82 ± 14 0.903 82 ± 15 82 ± 13 0.351
Cholesterol (mg/dL) 216.5 ± 69.6 204.9 ± 42.5 0.556 208.8 ± 58.0 201.2 ± 69.6 0.556
Triglycerides (mg/dL) 221.4 ± 98.7 212.6 ± 89.7 0.650 194.8 ± 111.7 221.4 ± 158.3 0.250
HDL cholesterol (mg/dL) 46.4 ± 19.3 38.7 ± 15.5 0.350 42.5 ± 11.6 34.8 ± 11.6 0.440
LDL cholesterol (mg/dL) 128.9 ± 55.7 122.2 ± 75.9 0.332 131.2 ± 90.5 135.7 ± 99.5 0.298
UACR (mg/g) 108.8 ± 93.2 324.4 ± 399.0 < 0.001
Insulin/OHA/Diet only (%) 15/70/15 20/75/5 0.250
Current/Former/Never smoker (%) 6/19/75 14/26/60 0.150
HTN medication (No. [%]) 70 (35.7) 15 (42.9) 0.420
DM, diabetes mellitus; BMI, body mass index; FBS, fasting blood sugar; BP, blood pressure; HDL, high-density lipoprotein; LDL, low-density lipoprotein; UACR, urine albumin-to- creatinine ratio; OHA, oral hypoglycemic agent; HTN, hypertension.
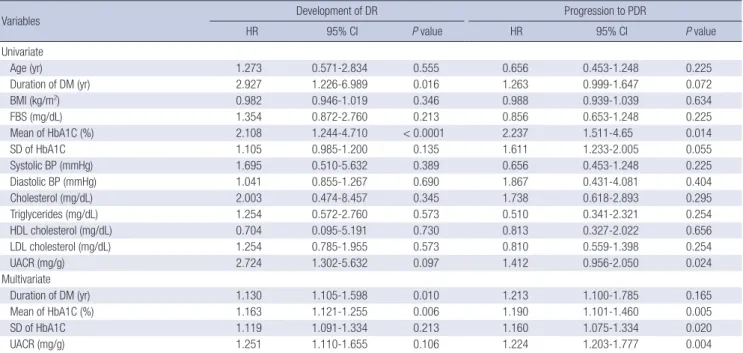
Table 2. Univariate and multivariate Cox proportional hazards models with backward elimination for predicting the development of diabetic retinopathy (DR) and the progression to proliferative diabetic retinopathy (PDR)
Variables Development of DR Progression to PDR
HR 95% CI P value HR 95% CI P value
Univariate
Age (yr) 1.273 0.571-2.834 0.555 0.656 0.453-1.248 0.225
Duration of DM (yr) 2.927 1.226-6.989 0.016 1.263 0.999-1.647 0.072
BMI (kg/m2) 0.982 0.946-1.019 0.346 0.988 0.939-1.039 0.634
FBS (mg/dL) 1.354 0.872-2.760 0.213 0.856 0.653-1.248 0.225
Mean of HbA1C (%) 2.108 1.244-4.710 < 0.0001 2.237 1.511-4.65 0.014
SD of HbA1C 1.105 0.985-1.200 0.135 1.611 1.233-2.005 0.055
Systolic BP (mmHg) 1.695 0.510-5.632 0.389 0.656 0.453-1.248 0.225
Diastolic BP (mmHg) 1.041 0.855-1.267 0.690 1.867 0.431-4.081 0.404
Cholesterol (mg/dL) 2.003 0.474-8.457 0.345 1.738 0.618-2.893 0.295
Triglycerides (mg/dL) 1.254 0.572-2.760 0.573 0.510 0.341-2.321 0.254
HDL cholesterol (mg/dL) 0.704 0.095-5.191 0.730 0.813 0.327-2.022 0.656
LDL cholesterol (mg/dL) 1.254 0.785-1.955 0.573 0.810 0.559-1.398 0.254
UACR (mg/g) 2.724 1.302-5.632 0.097 1.412 0.956-2.050 0.024
Multivariate
Duration of DM (yr) 1.130 1.105-1.598 0.010 1.213 1.100-1.785 0.165
Mean of HbA1C (%) 1.163 1.121-1.255 0.006 1.190 1.101-1.460 0.005
SD of HbA1C 1.119 1.091-1.334 0.213 1.160 1.075-1.334 0.020
UACR (mg/g) 1.251 1.110-1.655 0.106 1.224 1.203-1.777 0.004
DM, diabetes mellitus; BMI, body mass index; FBS, fasting blood sugar; SD, standard deviation; BP, blood pressure; HDL, high-density lipoprotein; LDL, low-density lipoprotein;
UACR, urine albumin-to-creatinine ratio.
based on the experiences at our tertiary institution. In patients receiving regular care and management of diabetes, the rate of development to DR from no DR was 32.1/1,000 person-years, and the rate of progression from NPDR to PDR was 26.2/1,000 person-years. These incidence rates were slightly lower than the 44.4/1,000 person-years rate of development of DR and the 37.5/1,000 person-years rate of progression to PDR reported by Kim et al. (16), who studied the rates of progression of DR in Ko- reans with type 2 diabetes in a similar manner in our center from 1990 to 1996. Baseline HbA1C level was 11.2-11.5%, which was also higher than our current study. It is not accurate, of course, to simply compare the results of different studies based on participants with unequal baseline DRs and socioeconomic backgrounds with different follow-up frequencies. However, the recent decreasing trend in diabetic micro-vasculopathy can be seen in other previous reports (17). In a previously published meta-analysis that reviewed the rates of progression of DR, rates of progression to PDR and severe visual loss were lower among participants in 1986-2008 than in 1975-1985, showing that dia- betic patients have lower rates of progression since 1985 (18). By generating a more precise estimate of the prevalence of DR and its relationship with major modifiable risk factors based on many previous large-scale studies, public health education and awareness have improved and the optimal clinical prevention and management of DR could be possible, ultimately lowering the incidence rate of DR and related complications (8, 10, 11).
It is well known that inadequate glycemic control highly cor- relates with both the development and progression of DR in previous studies (7-11, 16). Our current findings confirmed these observations and showed that a higher HbA1c is indepen- dently associated with an increased risk of DR, i.e. for every 1%
increase in HbA1c, the risk of DR development increased 1.16- fold (16%) and the risk of progression to PDR increased 1.19- fold (19%). Whereas the fasting blood sugar and HbA1c values at baseline did not differ in terms of the development of DR or progression to PDR, the mean HbA1c concentration was higher in patients who developed DR and progressed to PDR. This re- sult is in line with many earlier reports that demonstrated that a long-lasting high blood glucose level could aggravate DR and, meanwhile, that strict glucose control could slow the rates of DR development and progression in patients with previously poor glycemic control (16, 19). Of note, the SD of HbA1c, which is considered to show the long-term fluctuation in glycemic con- trol, was significantly higher in the progressor group. Although some previous studies demonstrated that variability in the HbA1c was a risk factor for diabetes-related microvascular dis- eases, there are still inconsistent results for its correlation with DR in type 2 DM (20). The duration of diabetes, which is related to the duration of high glucose levels, is an important risk factor for DR (21). Rema et al. (22) reported that for every 5-yr increase in the duration of diabetes, the risk of DR increased 1.89-fold. In
our present study, for every 1 yr increase, the risk of DR increas- ed by 1.13-fold (13%). Therefore, emphasizing continuous fol- low-up for DR assessment is important for diabetic patients.
DR and diabetic nephropathy are the 2 major diabetic micro- vascular complications and the most important causes of blind- ness and end-stage renal disease in Korea (3). Our findings sug- gest that patients with diabetic nephropathy show a more rapid progression to PDR, which is in line with the results of most pre- vious studies (23). Albuminuria is one of the indicators of gener- alized microvascular disease in diabetic patients and is therefore a risk factor for combination DR (24). Nonetheless, inconsistent data also have been reported. In patients with type 2 diabetes, the association between nephropathy and retinopathy is less predictable than that of type 1 diabetes (14). In our present study, after adjustment for other risk factors, patients with albu- minuria showed an increased risk of progression to PDR. Thus, more careful ophthalmologic follow-up is recommended when albuminuria develops in patients with DR.
Other significant risk factors for the development of DR and progression to PDR in previous studies were a younger age at DM diagnosis (21), male sex (25), hypertension (19, 23), high systolic BP (26), low diastolic BP (21), hypercholesterolemia (27), anemia (27), elevated systemic neutrophil count (28), use of in- sulin (29), high waist-to-hip ratio (21), smoking status, and dia- betic foot disease (30). In our current study of Korean patients, age, sex, BP, hyperlipidemia, and smoking status did not corre- late with DR progression (P > 0.05); caloric intake, blood cell count, and diabetic foot disease were not included in our analy- ses. Some of these differences might be explained that most of our study cohort was in good control of BP and hyperlipidemia.
And some might be due to unique characteristics of Korean pa- tients in that a significant portion of Korean diabetic patients are nonobese with type 2 DM, and their body weights often de- crease during the disease course (6).
This study has several limitations in terms of generalizing the natural course of DR because it was a tertiary clinic-based study.
It is quite possible that only patients with poorly controlled dia- betes or a more severe form of diabetes with complications at- tend our hospital-based tertiary medical center. The mean base- line HbA1c level of study participants was relatively high, indi- cating this cohort consisted of poorly controlled diabetic pa- tients. In addition, patients with severe forms of diseases gener- ally tend to follow for a longer period. Taken together, the inclu- sion of patients with poor glycemic control may have overesti- mated the incidence of DR and PDR. On the other hand, this setting makes it possible to maintain a greater portion of patients who are more concerned about their health and adopt a more active attitude to the control of chronic diseases, such as diabe- tes. Byun et al. (5) recently reported that socioeconomic factors, including occupation, family income, and education, were as- sociated with the frequency of screening for diabetic complica-
tions. In other words, patients with less education or low family income underwent less frequent screening for retinopathy or nephropathy. Thus, the participants of this study who had regu- lar check-ups in the tertiary clinic are considered to have better compliance for screening and management of DR and show lower rates of diabetic complications than the general popula- tion. Moreover, patients with high-risk severe NPDR undergo panretinal photocoagulation treatment in most cases, affecting the natural history of DR progression. Therefore, when interpret- ing the results of our current study, these possible sources of bias should be considered. Large-scale population-based longi- tudinal studies are needed to examine the natural history of the development of DR and progression to PDR in Korean diabetic patients.
In conclusion, the rates of the development of DR and pro- gression to PDR in Koreans with type 2 diabetes are lower than those reported over the last decade. And this study shows tradi- tional, known risk-factors are still the most influential in the de- velopment and progression of DR in cohort of Korean patients with type 2 DM. Poor glycemic control is the common risk factor for the development of DR and progression to PDR. In addition, a longer duration of diabetes and a combination with diabetic nephropathy are significant risk factors for the development of DR and progression to PDR, respectively. Our findings may be used as a reference when planning screening tests and the sub- sequent follow-up of DR in Koreans with type 2 DM.
DISCLOSURE
The authors have no conflicts of interest to disclose.
ORCID
Yoon Jeon Kim http://orcid.org/0000-0003-4293-9641 June-Gone Kim http://orcid.org/0000-0003-1181-941X Joo Yong Lee http://orcid.org/0000-0002-2187-196X Kyoung Sub Lee http://orcid.org/0000-0002-1854-7616 Soo Geun Joe http://orcid.org/0000-0001-6525-7243 Joong-Yeol Park http://orcid.org/0000-0002-9823-407X Min-Seon Kim http://orcid.org/0000-0002-4881-0390 Young Hee Yoon http://orcid.org/0000-0002-2849-7528 REFERENCES
1. Wild S, Roglic G, Green A, Sicree R, King H. Global prevalence of diabe- tes: estimates for the year 2000 and projections for 2030. Diabetes Care 2004; 27: 1047-53.
2. Economic costs of diabetes in the U.S. in 2012. Diabetes Care 2013; 36:
1033-46.
3. Choi YJ, Kim HC, Kim HM, Park SW, Kim J, Kim DJ. Prevalence and management of diabetes in Korean adults: Korea National Health and
Nutrition Examination Surveys 1998-2005. Diabetes Care 2009; 32:
2016-20.
4. Kim TH, Chun KH, Kim HJ, Han SJ, Kim DJ, Kwak J, Kim YS, Woo JT, Park Y, Nam M, et al. Direct medical costs for patients with type 2 diabetes and related complications: a prospective cohort study based on the Kore- an National Diabetes Program. J Korean Med Sci 2012; 27: 876-82.
5. Byun SH, Ma SH, Jun JK, Jung KW, Park B. Screening for diabetic reti- nopathy and nephropathy in patients with diabetes: a nationwide survey in Korea. PLoS One 2013; 8: e62991.
6. Jee D, Lee WK, Kang S. Prevalence and risk factors for diabetic retinopa- thy: the Korea National Health and Nutrition Examination Survey 2008- 2011. Invest Ophthalmol Vis Sci 2013; 54: 6827-33.
7. Chrisholm DJ. The Diabetes Control and Complications Trial (DCCT). A milestone in diabetes management. Med J Aust 1993; 159: 721-3.
8. Klein R, Klein BE, Moss SE, Cruickshanks KJ. The Wisconsin Epidemio- logic Study of Diabetic Retinopathy: XVII. The 14-year incidence and pro- gression of diabetic retinopathy and associated risk factors in type 1 dia- betes. Ophthalmology 1998; 105: 1801-15.
9. Matthews DR, Stratton IM, Aldington SJ, Holman RR, Kohner EM; UK Prospective Diabetes Study Group. Risks of progression of retinopathy and vision loss related to tight blood pressure control in type 2 diabetes mellitus: UKPDS 69. Arch Ophthalmol 2004; 122: 1631-40.
10. ACCORD Study Group; ACCORD Eye Study Group, Chew EY, Ambrosi- us WT, Davis MD, Danis RP, Gangaputra S, Greven CM, Hubbard L, Ess- er BA, Lovato JF, et al. Effects of medical therapies on retinopathy progres- sion in type 2 diabetes. N Engl J Med 2010; 363: 233-44.
11. The effect of intensive treatment of diabetes on the development and progression of long-term complications in insulin-dependent diabetes mellitus. The Diabetes Control and Complications Trial Research Group.
N Engl J Med 1993; 329: 977-86.
12. Hirsch IB, Brownlee M. Beyond hemoglobin A1c--need for additional markers of risk for diabetic microvascular complications. JAMA 2010;
303: 2291-2.
13. Collins VR, Dowse GK, Plehwe WE, Imo TT, Toelupe PM, Taylor HR, Zimmet PZ. High prevalence of diabetic retinopathy and nephropathy in Polynesians of Western Samoa. Diabetes Care 1995; 18: 1140-9.
14. Park CY, Park SE, Bae JC, Kim WJ, Park SW, Ha MM, Song SJ. Prevalence of and risk factors for diabetic retinopathy in Koreans with type II diabe- tes: baseline characteristics of Seoul Metropolitan City-Diabetes Preven- tion Program (SMC-DPP) participants. Br J Ophthalmol 2012; 96: 151-5.
15. Kim JH, Kwon HS, Park YM, Lee JH, Kim MS, Yoon KH, Lee WC, Cha BY, Son HY. Prevalence and associated factors of diabetic retinopathy in ru- ral Korea: the Chungju metabolic disease cohort study. J Korean Med Sci 2011; 26: 1068-73.
16. Kim HK, Kim CH, Kim SW, Park JY, Hong SK, Yoon YH, Lee KU. Devel- opment and progression of diabetic retinopathy in Koreans with NIDDM.
Diabetes Care 1998; 21: 134-8.
17. Hovind P, Tarnow L, Rossing K, Rossing P, Eising S, Larsen N, Binder C, Parving HH. Decreasing incidence of severe diabetic microangiopathy in type 1 diabetes. Diabetes Care 2003; 26: 1258-64.
18. Wong TY, Mwamburi M, Klein R, Larsen M, Flynn H, Hernandez-Medi- na M, Ranganathan G, Wirostko B, Pleil A, Mitchell P. Rates of progres- sion in diabetic retinopathy during different time periods: a systematic review and meta-analysis. Diabetes Care 2009; 32: 2307-13.
19. Klein R, Klein BE, Moss SE, Davis MD, DeMets DL. The Wisconsin Epi-
demiologic Study of Diabetic Retinopathy. IX. Four-year incidence and progression of diabetic retinopathy when age at diagnosis is less than 30 years. Arch Ophthalmol 1989; 107: 237-43.
20. Kilpatrick ES, Rigby AS, Atkin SL. A1C variability and the risk of micro- vascular complications in type 1 diabetes: data from the Diabetes Control and Complications Trial. Diabetes Care 2008; 31: 2198-202.
21. Porta M, Sjoelie AK, Chaturvedi N, Stevens L, Rottiers R, Veglio M, Fuller JH; EURODIAB Prospective Complications Study Group. Risk factors for progression to proliferative diabetic retinopathy in the EURODIAB Pro- spective Complications Study. Diabetologia 2001; 44: 2203-9.
22. Rema M, Premkumar S, Anitha B, Deepa R, Pradeepa R, Mohan V. Prev- alence of diabetic retinopathy in urban India: the Chennai Urban Rural Epidemiology Study (CURES) eye study, I. Invest Ophthalmol Vis Sci 2005; 46: 2328-33.
23. Roy MS, Affouf M. Six-year progression of retinopathy and associated risk factors in African American patients with type 1 diabetes mellitus: the New Jersey 725. Arch Ophthalmol 2006; 124: 1297-306.
24. Alzaid AA. Microalbuminuria in patients with NIDDM: an overview. Di- abetes Care 1996; 19: 79-89.
25. Fong DS, Aiello L, Gardner TW, King GL, Blankenship G, Cavallerano JD, Ferris FL 3rd, Klein R; American Diabetes Association. Retinopathy in diabetes. Diabetes Care 2004; 27: S84-7.
26. Teuscher A, Schnell H, Wilson PW. Incidence of diabetic retinopathy and relationship to baseline plasma glucose and blood pressure. Diabetes Care 1988; 11: 246-51.
27. Aiello LP, Cahill MT, Wong JS. Systemic considerations in the manage- ment of diabetic retinopathy. Am J Ophthalmol 2001; 132: 760-76.
28. Woo SJ, Ahn SJ, Ahn J, Park KH, Lee K. Elevated systemic neutrophil count in diabetic retinopathy and diabetes: a hospital-based cross-sec- tional study of 30,793 Korean subjects. Invest Ophthalmol Vis Sci 2011;
52: 7697-703.
29. Hamman RF, Mayer EJ, Moo-Young GA, Hildebrandt W, Marshall JA, Baxter J. Prevalence and risk factors of diabetic retinopathy in non-His- panic whites and Hispanics with NIDDM. San Luis Valley Diabetes Study. Diabetes 1989; 38: 1231-7.
30. Harris Nwanyanwu K, Talwar N, Gardner TW, Wrobel JS, Herman WH, Stein JD. Predicting development of proliferative diabetic retinopathy.
Diabetes Care 2013; 36: 1562-8.