Print ISSN: 2288-4637 / Online ISSN 2288-4645 doi:10.13106/jafeb.2020.vol7.no12.073
Impacts of Corruption Control on Economic Growth in Relationship with Stock Market and Trade Openness
Van Thi Hong PHAM
1Received: September 01, 2020 Revised: October 26, 2020 Accepted: November 05, 2020
Abstract
The study aims to investigate the dual effects of corruption control on economic growth in relationship with the stock market and trade openness in developing countries. The study used difference S-GMM method on the dynamic panel data model in the period (2002-2017) with data collected from the World Bank. The study discovers the dominant impacts of corruption control in the relationship with the stock market on economic growth. At the same time, the study also confirms the overwhelming impact of corruption control in the relationship between trade openness and economic growth in the developing countries. In addition, the study shows that inefficient stock markets in developing countries will not promote economic growth. Meanwhile, the long-standing credit market has a positive impact on economic growth. With the strong development of stock market and trade openness in the period (2002-2017), control on corruption in developing countries does not get better in time with the increase in demand. The findings of this study suggest a number of solutions to strengthen corruption control, leading to the increased efficiency on the stock market and as well as encouraging the positive effects of trade openness to contribute to promoting economic growth in developing countries.
Keywords: Developing Countries, Economic Growth, Corruption Control, Stock Market Development, Trade Openness JEL Classification Code: O16, O24, O43, O47
With the role of state management, the corruption restrictions of each country must be improved to encourage the positive impacts of the stock market and trade openness on economic growth. Will broad trade openness encourage the economic growth in the context of developing countries with high corruption? Will the regulation of corruption of developing nations promote the development of stock market to meet the economic growth? These are some of the issues which are a top concern for the leaders of the developing countries.
The development of the stock market, which influences economic growth, relies on the degree of progress of the national financial system and the efficiency of the public institutions (Acemoglu & Robinson, 2010; Duncan, 2014;
Talmaciu, 2014). Trade openness and corruption controls not not only influence economic growth directly (Hye, Wizarat &
Lau, 2016; Musila & Yiheyis, 2015), but it also influences the development of the stock market. The effects of corruption on the development of the stock market (Modugu & Depere, 2020; Kim, Li & Tarzia, 2018; Bolgorian, 2011) and the impacts of corruption on trade openness (Gil-Pareja, Llorca- Vivero & Martinez-Serrano, 2019; Thede & Gustafson, 2012); as well as the influences of trade openness on the stock market have been reported in several studies in the
1. Introduction
The political institutions in developing nations still concentrate a great deal of power in the public sector on the widespread corruption compared to the richer and developed nations of the world (Olken & Pande, 2012; Svensson, 2005;
Treisman, 2000), which affects development of stock market in particular and economic growth in general (Bolgorian, 2011;
Yartey, 2010; Hooper, Sim & Uppal, 2009). In addition, compared to the developed countries, developing countries account for more than 60% of the world’s population but produce less than 30% of global GDP (Spence, 2011). As a result, implementing corruption control and developing the stock market to promote economic growth is a top objective for developing countries.
1
First Author and Corresponding Author. Lecturer, Faculty of Finance and Banking, Van Lang University, Ho Chi Minh City, Viet Nam [Postal Address: 45 Nguyen Khac Nhu Street, Co Giang Ward, District 1, Ho Chi Minh City, 70000, Vietnam] Email: [email protected]
© Copyright: The Author(s)
This is an Open Access article distributed under the terms of the Creative Commons Attribution Non-Commercial License (https://creativecommons.org/licenses/by-nc/4.0/) which permits unrestricted non-commercial use, distribution, and reproduction in any medium, provided the original work is properly cited.
past (Nikmanesh, 2016; Lim & Kim, 2011). Thus, in order to lead to the economic growth, the control of corruption and the development of the stock market under open economic conditions are the top priorities for developing nations.
Many empirical studies have been performed in the past on the influence of corruption on economic development, but very few studies have been undertaken on the influence of corruption regulation on economic growth through the connection between corruption control and stock market or trade openness. This study will, therefore, solve the void left by the previous studies. This report would offer new scientific evidences and resolve the needs of administrators in developing countries. Since then, steps to improve the prevention of corruption have also been suggested to encourage the beneficial impact of stock market and trade openness, which leads to an increase in the economic development in developing countries in general and in Vietnam in particular.
2. Theoretical Basis and Literature Review 2.1. Theoretical Basis
The study focuses on the impact of corruption control on economic growth in the relationship with the stock market and trade openness in developing countries. Then, Cobb- Douglas production function reflects the factors of capital (K), labor (L) and the efficiency of the aggregate factors (A) affecting the output value of an economy by the equation of the form: Y = A.K
α.L
1-αthat will be used to clarify the above relationship. Specifically, stock market, which provides capital to the economy, is a component of the capital factor (K) of the growth model; trade openness facilitates businesses to expand consumption markets and technology investments (Bond, Jones & Wang, 2005; Almeida &
Fernandes, 2008), thus contributing to the efficiency of the aggregate factors (A); finally, corruption control provides equitable and healthy business environment (Hooper, Sim &
Uppal, 2009; Talmaciu, 2014) and an incentive for investors (Svensson, 2003; Fisman & Svensson, 2007), contributing to the efficiency of aggregate factors A of the growth model.
Besides, according to Barro’s endogenous growth theory (1990), the role of governments will arise from public expenditures and the power of civil servants to exercise managerial roles. Corruption thus occurs when a number of civil servants abuse public power for personal benefits. Corruption damages the state budget through public investment activities (Olken & Pande, 2012), leads to loss of people’s trust in the management apparatus (Olken & Baron, 2009; d’Agostino, Dunne & Pieroni, 2016) and eliminate business motivation (Svensson, 2003; Fisman & Svensson, 2007). As a result, government’s implementation of corruption control contributes in minimizing corruption, strengthening people’s trust, creating motivation to work and promoting economic growth.
2.2. Literature Review
A variety of studies have been performed on the effect of corruption control on economic growth through the variable corruption (Qu, Sylwester & Wang, 2018; Mallik & Saha, 2016; Pellegrini & Reyer, 2004). The studies conducted on a group of countries with similar conditions show that corruption in countries with low political institutional quality is considered as a lubricant for the economy, helping the economy develop but corruption in countries with high institutional quality reduces economic growth (Aidt, Dutta
& Sena, 2008; Mallik & Saha, 2016). In emerging countries, Poor regulation of corruption restricts economic growth, and corruption management is greater in wealthy countries, rendering the economy less affected by corruption (Cieślik &
Goczek, 2018). Some recent studies in developing countries where corruption is high, corruption significantly impedes firm revenue growth and labor productivity growth, limiting business innovation (Nguyen, 2020; Dutta & Sobel, 2016).
There have been few studies which have focused on the effect of corruption control on economic growth in the relationship with other factors. In most countries, when the economy is open, the flow of investment capital has been facilitated to move from ineffective places to effective ones.
A nation with high quality public government ensures that good corruption control will reduce transaction costs, reduce risks and increase the performance of stock market (Hooper, Sim & Uppal, 2009; Ho & Michaely, 1988). Increased market performance will bring more profits to investors (Hawawini, 1993), thus attracting more investors to participate in the capital market. According to Lombardo and Pagano (2000) capital flows will shift from a country with bad corruption control to a country with better corruption control to maximize investors’ returns. A study by Nguyen, Nguyen and Schinckusb (2019) also shows that in a nation with a high degree of trade openness paired with good institution, its domestic market will draw more investors instead of targeting overseas investment markets. Thus, factor of corruption is one of the indicators reflecting institutions and impacts on the performance of stock market (Hooper, Sim & Uppal, 2009; Kim, Li & Tarzia, 2018).
Besides, with the opening of the economy, there is an increase in competition among countries and it will force countries to step up corruption control to attract investment (Levchenko, 2013; Torrez, 2002), which also implies that good corruption control will increase trade openness, contributing to increasing economic growth. Majeed (2014) finds that with the state agencies’ privilege of issuing quality and origin certificates of goods for export increases the likelihood of corruption.
Review results of past empirical studies have shown that corruption control can affect economic growth as follows:
(1) Corruption control is a component of the aggregate
factors in Cobb-Douglas growth model, which
directly affects economic growth.
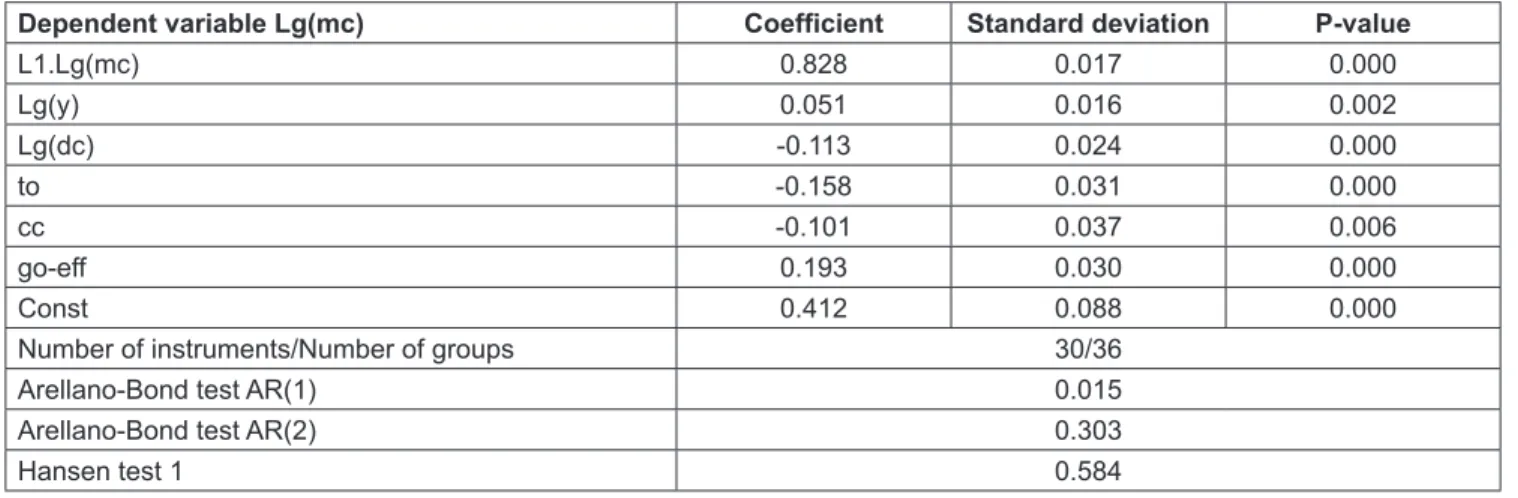
(2) Corruption control affects economic growth through the mediating role of the relationship of corruption control and stock market. Then, corruption control affects the performance of capital use on stock market.
(3) Corruption control affects economic growth through the mediating role of the relationship of corruption control and trade openness. Then, corruption control affects the efficiency of trade openness.
Among the three ways of influencing corruption control on economic growth, the past studies focused the impacts in the way (1). According to the ways (2) and (3), there have been no studies conducted. The gap in the research that the author is interested in. Therefore, this study aims at two objectives:
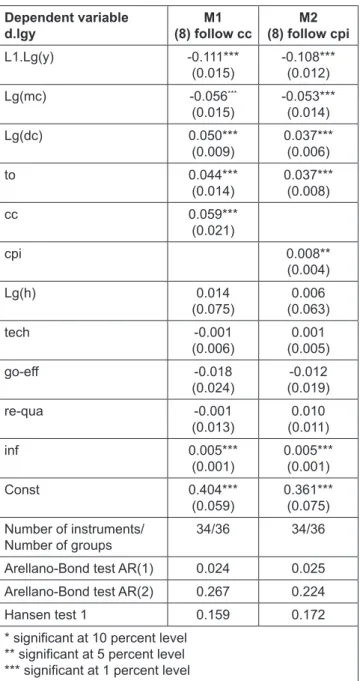
(i) The impacts of corruption control on economic growth in developing countries in the relationship with stock market.
(ii) The impacts of corruption control on economic growth in developing countries in the relationship with trade openness.
3. Study Method
3.1. Analytical Framework
From theoretical basis and reviewed results, the analytical framework of the impacts of corruption control on economic growth in the relationship with stock market and trade openness is proposed as follows
3.2. Study Model
Following approach of Mankiw, Romer and Weil (1992), with the addition of human capital (H), Cobb - Douglas production function is rewritten in terms of time t to determine the output value of country i in the form:
,
=
,.
∝,.
β,.
1,−∝−βi t i t i t i t i t
Y A K H L với 0 < α, β < 1 (1) Dividing both sides of (1) by L
i,t, the result is:
1
, , ,
, ,
, , , ,
. .
α β − −α β
=
i t i t i t
i t i t
i t i t i t i t
K H L
Y L A L L L y
i t,= A k h
i t,.
i t i tα, β,(2)
With y
itthe output per capita; k
itis the physical capital per capita; h
itis human capital per capita, α and β are the elasticities of physical capital or human capital.
Taking the two-sided decimal logarithm, the result is rewritten:
Lg(y
i,t) = Lg(A
i,t) + ∝ k
i,t+ βh
i,t(3)
Stock market is also a channel to provide capital to the
economy together with credit market, so this study uses
variable stock market (mc) and variable credit market (dc)
representing k
itin model (3) like approach of Durusu-Ciftci,
Ispir and Yetkiner (2017). According to Mankiw, Romer
and Weil (1992), A
itreflects not only technological progress
xxxxdbut also the differences in institutions, resources and
business environment between countries over time. The
institutional factor of a country is represented by indicator
corruption control and governmental efficiency (go-eff)
according to Cooray (2009); the business environment
between countries over time is represented by indicator trade
openness and the quality of laws according to Alcala and
Ciccone’s approach (2004). Thus, factors affecting overall
efficiency A
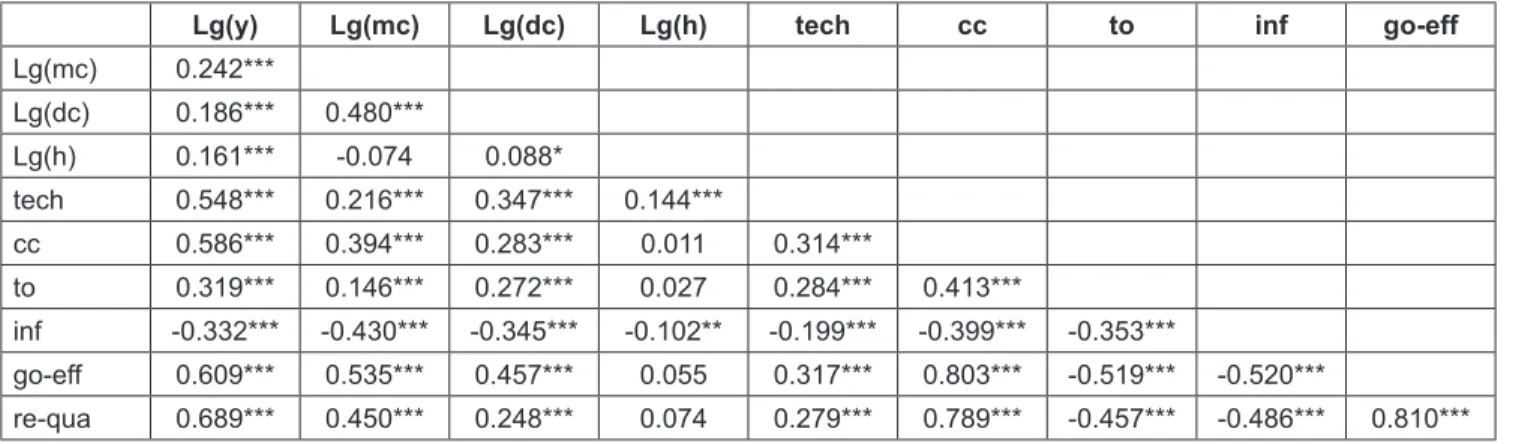
itstudied and used include variables such as
technology (tech), trade openness (to), corruption control
(cc), governmental efficiency (go-eff) and quality of laws
(re-qua).
Their relationship is expressed as a performance function:
1. 2. 3. 4. _ 5. _
,