Vol.34, No.4 pp. 299~304, 2010 (ISSN-1598-5725)
A Study on FDTD Analysis and Fabrication of the Sheet-type Millimeter EM wave Absorber
Dae-Hun Kim*․Dong-Soo Choi**․†Dong-Il Kim
†, *, ** Department of Radio Sciences & Engineering, Korea Maritime University, Busan, Korea
Abstract : In this paper, the EM wave absorber was developed for the 94-GHz detecting radar system. To analysis an EM wave absorber in millimeter wave band, we fabricated three absorber samples using carbon black and titanium dioxide and permalloy with chlorinated polyethylene. After measuring the complex relative permittivity, the absorption characteristics are simulated by 1D FDTD according to different thicknesses of less than 1.0 mm. Then, the EM wave absorber was fabricated based on the FDTD simulation. As a result, the measured results agreed well with the simulated ones, and the developed EM wave absorber with a thickness of 0.7 mm had the desired absorption characteristics of more than 14 dB in the frequency range of the 94-GHz band.
Key words : Absorption Characteristics, Millimeter wave EM absorber, FDTD simulation, Carbon black, titanium dioxide, permalloy
†Corresponding author, [email protected] 051)410-4932
* [email protected] (055)370-6848
** [email protected] 051)410-4932
1. Introduction
Millimeter wave bands are employed in a wide range of commercial, military and scientific applications. Especially, for example, military radar systems are used to identify the range, altitude, direction, or speed of targeting objects.
Millimeter wave radars offer better range resolution than microwave radars, and can penetrate fog, smoke and other obscurants much better than infrared sensors. Thus, the frequency band of radar systems was recently extended to millimeter wave band [1], [2] and millimeter wave band is used for the detecting radar system of ground-vehicle system such as tanks. To prevent own ships, aircrafts, and/or facilities from detecting by enemies, it is essential and important to develop an EM wave absorber for millimeter wave band [3]. To develop an EM wave absorber for millimeter wave band, in general, many materials such as carbon black, titanium dioxide, permalloy, etc. are investigated [4]. However, the EM wave absorbers using these materials almost have been reported in manufacturing and experimentally measured results. Therefore, the purpose of this paper is to analyze the absorption characteristics for EM wave absorber using these materials by one dimensional FDTD within a thickness of less than 1.0 mm. To analysis an EM wave absorber in millimeter wave band, we fabricated absorber samples using carbon black, titanium dioxide, permalloy with chlorinated polyethylene (CPE), The impedances of the absorbers have been measured by using
rectangular waveguide and jig. The complex relative permittivity ( ′ ″) is calculated from the measured data. And the absorption characteristics are simulated by 1D FDTD according to different thicknesses of less than 1.0 mm. After manufacturing the EM wave absorber based on FDTD result, the simulated result and the measured one were compared.
2. Theory of the EM wave absorber
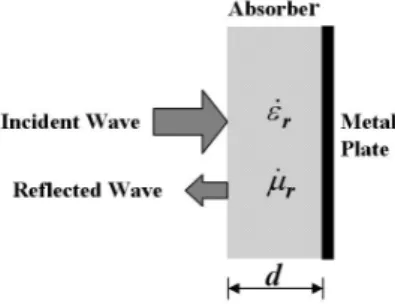
For a conductor-backed single layer EM wave absorber as shown in Fig. 1, the Return Loss (RL) can be obtained by using the equivalent circuit in Fig. 1 as follows [5-6]:
log
(1)Here, is the normalized input impedance.
Fig. 1 A single-layered EM wave absorber
Fig. 2 The EM wave absorber in rectangular waveguide
Where is the wavelength, is the thickness of the sample, is the x-direction length in the rectangular waveguide, is the complex relative permeability, and is the complex relative permittivity. when the EM wave absorber is designed in a rectangular waveguide as shown in Fig.2, TE10 mode is the only propagating mode in waveguide region [7].
The normalized impedance[8] is expressed by eq.(2).
(2)The reflectionless condition for normal incidence of an electromagnetic wave is given by eq. (3).
(3)
Hence, the material constants (complex relative permittivity and permeability ) and the sample thickness can be found by solving eq. (3).
3. Material properties
3.1 Sample preparation
We fabricated some samples in different composition ratios of carbon black and titanium dioxide and permalloy with CPE. These materials were mixed with the binder of CPE, and the sheet-type absorber was fabricated by using an open roller. The manufacturing process of absorber is shown in Fig. 3. The dimensions of the samples were 2.54×1.27×1.5 mm and 2.54×1.27×3 mm.
3.2 Measurement method
The measurement system is composed of ANRITSU ME 78080A broadband vector network analyzer, rectangular waveguide, sample jig, and short circuit, which is shown in
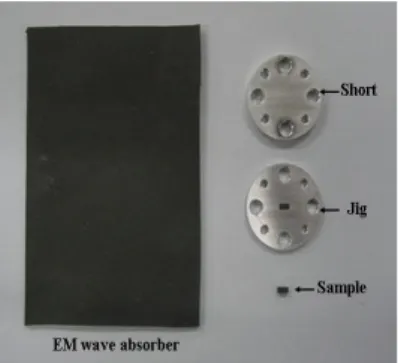
Fig. 4. Figure 5 presents manufactured samples and Figure 6 presents a photo of absorber, jig, and sample. The reflection coefficients from the sample can be obtained after proper calibration.
Fig. 3 Manufacturing process of absorber
Fig. 4 General configuration of the measurement system
Fig. 5 Manufactured samples
Fig. 6 A photo of the absorber, test jig, and sample
3.3 Measurement results
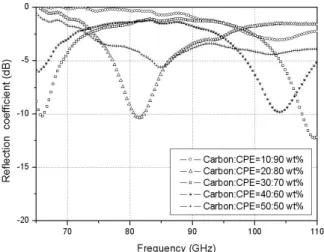
The measurement equipments in this paper are used for the reflection measurement. Figure 7 shows the composition
ratio dependence on the measured reflection coefficients for the samples using carbon black with 2 mm thickness. The optimum composition ratio of carbon black is expected as about 30 wt.%.
Fig. 7 Reflection coefficients of samples using carbon black with different composition ratio (Thickness : 2 mm)
Fig. 8 Reflection coefficients of samples using titanium dioxide with different composition ratio (Thickness : 1.5
mm).
Figure 8 shows the composition ratio dependence on the measured reflection coefficients for the samples using titanium dioxide with 1.5 mm thickness. The optimum composition ratio of titanium dioxide is expected as about 70 wt.%. Figure 9 shows the composition ratio dependence on the measured reflection coefficients for the samples using permalloy with 1.5 mm thickness. The optimum composition ratio of permalloy is expected as about 70 wt.%.
Therefore, we carried out the EM wave absorber simulation with samples containing 30 wt.% of carbon black and 70 wt.% of titanium dioxide and 70 wt.% of permalloy
to analyze the absorption characteristics according to difference thicknesses by 1D FDTD.
Fig. 9 Reflection coefficients of samples using permalloy with different composition ratio (Thickness : 1.5 mm)
Fig. 10 The measured complex relative permittivity (Carbon : CPE = 30 : 70 wt.%)
Fig. 11 The measured complex relative permittivity (titanium dioxide : CPE = 70 : 30 wt.%)
Fig. 12 The measured complex relative permittivity (Permalloy : CPE = 70 : 30 wt.%)
The material constants of these samples are calculated from S-parameter using method [9]. Figure 10 shows the measured complex relative permittivity of sample containing 30 wt.% of carbon black at frequency range of 65
~110 GHz. Figure 11 shows the measured complex relative permittivity of sample containing 70 wt.% of titanium dioxide at frequency range of 65~110 GHz.
Figure 12 shows the measured complex relative permittivity of sample containing 70 wt.% of permalloy at frequency range of 65~110 GHz.
4. FDTD simulation
To analyze the absorption characteristics of the EM wave absorber according to difference thicknesses, one- dimensional FDTD analysis [10] was applied by using only
and . The time-dependent general form of Maxwell's curl equations is
∇ ×
(4)
· · (5)
∇ ×
(6)
Where is the electric flux density, is the electric field, and is the magnetic field. Applying the normalizing equation, Maxwell' seq.(4)~(6) can be written as
∇ × (7)
(8)
∇ × (9)
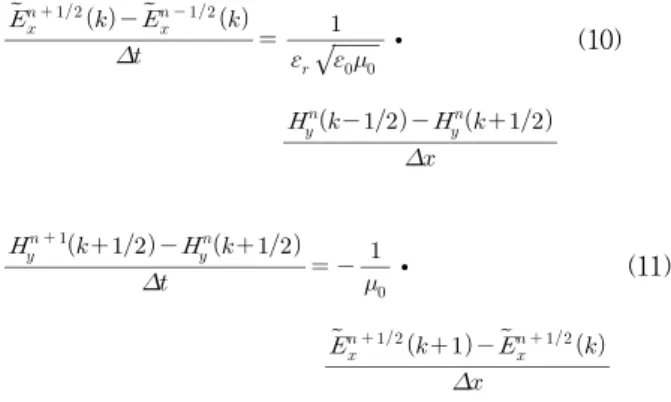
Then taking the central difference approximations for both the temporal and spatial derivatives gives
∙
(10)
∙
(11)
FDTD modeling space is partially filled with lossy materials. We have begun with the simplest case, that of a material whose complex permittivity is described by an equation with one first order pole. Such materials are often called Debye materials and the equation that describes their permittivity is the Debye equation. It is described as [11]
′ ″ ∞
∞
∞ (12)
Where is the static permittivity at first frequency in measured frequency range, ∞ is the infinite frequency permittivity, is the relaxation time, and is the frequency domain susceptibility.
In this paper, parameters of sample using carbon black are , ∞ and × based on Fig. 10.
and parameters of sample using titanium dioxide are
, ∞ and × based on Fig. 11. and parameters of sample using permalloy are ,
∞ and × based on Fig. 12.
The propagation of a distance of one cell requires a minimum time of ∆
∆ by the Courant Condition in
a one dimensional simulation. Where ∆ is the time step,
∆ is the cell size, and is the velocity of light. To meet the Courant condition, ∆ has to be determined under the condition of . Table 1 shows parameters in FDTD simulation.
Table 1 Parameters in FDTD simulation.
Cell number Cell size Time step Step number
20000 0.1mm 0.1mm/
( ∙․) 19000
The reflection coefficients are simulated by calculating the reflections of a Gaussian derivative pulse [11] normally on the EM wave absorber. The Gaussian derivative pulse is incident from the right on the proposed EM wave absorber.
In the FDTD algorithm, the electric field and the magnetic field are renewed. After the magnetic field is calculated, in other words the calculated value is stored in computer memory. Then the electric field is calculated after ∆ . This is to be repeated while the transient phenomena is disappeared.
Fig. 13 shows the FDTD simulation results of absorber containing 30 wt.% of carbon black. It has shown that the absorption in 94 GHz band is 14 dB for 0.7 mm thickness and thickness of 0.9 mm has an absorption characteristics of 17 dB at 77 GHz.
Fig. 13 FDTD results of absorber containing 30 wt.% of carbon black
Fig. 14 FDTD results of absorber containing 70 wt.% of titanium oxide
Fig. 14 shows the FDTD simulation results of absorber containing 70 wt.% of titanium oxide. It is confirmed that thickness of 0.9 mm has an absorption characteristics of 13 dB at 75 GHz.
Fig. 15 shows the FDTD simulation results of absorber containing 70 wt.% of permalloy. It is confirmed that thickness of 0.7 mm has an absorption characteristics of 15 dB at 90 GHz and thickness of 0.9 mm has an absorption characteristics of 10 dB at 72 GHz.
Fig. 15 FDTD results of absorber containing 70 wt.% of permalloy
5. Manufacture and Measurement
The EM wave absorber was fabricated based on the FDTD simulated result. The fabricated EM wave absorber had a thickness of 0.7 mm. Figure 16 shows a manufactured EM wave absorber, and Fig. 17 shows a comparison of the measured result and the simulated one. The absorption ability was confirmed to be more than 14 dB in the frequency range of 94-GHz. A SEM micrograph of the
Fig. 16 The manufactured EM wave absorber
fabricated EM wave absorber is presented in Fig. 18 to show that all carbon particles were well mixed with the CPE and that no air holes were presented.
Fig. 17 A comparison of the measured result and the simulated one
Fig. 18 A SEM micrograph of the fabricated EM wave absorber
6. Conclusions
The EM wave absorber was developed for the 94-GHz detecting radar system. To analysis an EM wave absorber in millimeter wave band, we fabricated three absorber samples using carbon black and titanium dioxide and permalloy with chlorinated polyethylene. After measuring the complex relative permittivity, the absorption characteristics are simulated by 1D FDTD according to different thicknesses of less than 1.0 mm. Then, the EM wave absorber was fabricated based on the FDTD simulation. As a result, the measured results agree well with the simulated ones, and the developed EM wave absorber with a thickness of 0.7 mm had the desired absorption characteristics of more than 14 dB in the frequency range of the 94-GHz band.
This study was supported by the basic research program of … ….(If necessary)
References
[1] Brooker, G. M., Birch, D. and Solms, J. (2005),
“W-Band Airborne Interrupted Frequency Modulated CW Imaging Radar,” IEEE Trans. on Aerospace and Electronic System, Vol.41, No.3, pp. 955-971.
[2] Choi, C. M, et al.(2006), “Development of the Electromagnetic Wave Absorber for 94 GHz Radar Sensors Using Permalloy," Inter. J. KIMICS, Vol.4, No.3, pp.114-117.
[3] Hashmoto, O.(1997), Introduction to Wave Absorber, Morikita Shuppan.
[4] Hashmoto, O. and Shimizu, Y.(1987), IEEE Trans. EMC 29, 142.
[5] KARL S. KUNZ RAYMOND J.LUEBBERS(1993), Finite Difference Time Domain Method for Electromagnetics, CRC Press.
[6] Naito, Y.(1987), Electromagnetic Wave Absorbers, New Ohm.
[7] Pozer, D. M.(2005), Microwave Engineering - 3rd ed., J.
Wiley & Sons.
[8] Russell, M. E., Crain, A., Curran, A., Campbell, R. A., Drubin, C. A. and Miccioli, W. F., “Millimeter-Wave Radar Sensor for Automotive Intelligent Cruise Control(ICC),” IEEE Trans. on Microwave Theory and Tech., Vol.45, No.12, pp. 2444-2453.
[9] Soh, T. and Hashimoto, O.(2000), “A Fundamental Study on Millimeter-Wave Absorbers Composed of Epoxy-Modified Urethane Rubber Mixed with Carbon Particles for 76 GHz or 94 GHz Frequency Band,”
Trans. IEICE, Vol.J83-B, No.6, pp. 923-925.
[10] Soh, T. and Hashmoto, O.(2001), “A Study on Millimeter-Wave Absorber Coating for V Band and W Band,” Trans. IEICE, Vol.J84-B, No.8, pp. 1523-15281.
[11] Sullivan, D. M.(2000), Electromagnetic Simulation Using the FDTD method, IEEE Press series on RF and Microwave Technology.
Received 27 May 2010 Revised 21 June 2010 Accepted 23 June 2010