DOI : http://dx.doi.org/10.5394/KINPR.2012.36.2.141
Activation Strategy for the Ship Supply Industry at the Port of Busan
Min Jin Gu*, Jinwoo Ahn**, Sang Young Moon***
* Research Fellow, DongEui University, ** Full time lecturer, Yeungnam College of Science & Technology,
*** Assistant Professor, Hankyong National University
Abstract : This study evaluates how activation plans presented by previous research are perceived by employees in the ship supply industry by sample surveys. Another objective of this study is to also assist in the selection of effective activation plans. It is becoming more and more difficult for the Port of Busan to strengthen its competitiveness in the ship supply industry by maintaining the status quo. Much research extending the scope of research subjects in the port logistics industry indicates that the development of the port logistics industry is very important for creating new value for the Port of Busan. The results shows that improvement in the retail structure and government support had a significantly positive correlation between the importance and necessity of the ship supply industry activation.
Key words : The port of Busan, Ship supply industry, Market structure, Firm Behavior, Service Industry
* First Author, [email protected] 010)2894-2122 ** [email protected] 053)650-9331
*** Corresponding Author, [email protected] 031)670-5426
Note) This paper was presented on the subject of "Activation Strategy for the Ship Supply Industry at the Port of Busan" for Master Thesis of Ms. Min Jin Gu in 2011(DongEui University, 2011)
1. Introduction
As the Port of Busan is located in the southeast of the Korean peninsula, it plays the role of a gateway connecting the Pacific Ocean and the Asian continent. Moreover, as the leading port in Korea, the Port of Busan makes a substantial contribution to Korean economic growth by handling approximately 40% of the total imported and exported overseas cargo, 80% of the international containers, and 40%
of the national fishery production. The quantity of containers transported through the Port of Busan was 1,418 million TEU in 2010 which is an increase of approximately 18.6%
compared to the previous year. Because of the increase in the international trade volume, as well as rapid economic development in Korea, the quantity of goods transported through the Port of Busan, together with its role in the international trade, will also be increased. In 2009 and 2010, the Port of Busan was the world's fifth largest port and the only Korean port in the top 10 international ports in terms of the quantity of containers transported. The quantity of containers transported decreased in 2009 mainly because of the financial crisis in 2008; however, the container quantity recovered shortly in 2010. In the global top 10 container ports, there are six Chinese ports, and four other countries' ports in the list. This implies that the quantity of containers transported to Chinese ports will increase and that these
ports will hold higher rankings in the list.
Ports are required to develop new competitive strategies in order to respond to these changes in the international logistics market environment. The Port of Busan is no exception. The Port of Busan should also develop new competitive strategies in order to create value-added service and enhance competitiveness. The ship supply industry is a typical value-added industry in the port logistics industry.
Although many researchers, through various studies, recognized the importance of the competitive strategy of the ship supply industry, most research only presented problems and a simple activation strategy at the Port of Busan.
Notably, the activation strategies presented by the previous studies did not reflect the current situation for many in the ship supply industry.
The objective of this study is to prioritize the activation
strategies of the Busan ship supply industry as a sustainable,
value-added service by developing an understanding of the
industry's circumstances and problems, analyzing literature
reviews and overseas case studies, supplemented by sample
surveys. Additionally, to address future industrial policies, a
correlation test between activation plans presented in
previous studies, as well as, the necessity and importance of
activation plans perceived by employees in the ship supply
industry are also performed.
2. Ship supply industry at the Port of Busan
2.1 Importance of ship supply industry
The European Ship Suppliers Organization defines the ship supply industry as, "In the old days, the chandler used to bring salted meat, livestock, manila ropes, cargo blocks, sail and twine and related stuff, mainly for sailing vessels.
Nowadays a ship chandler has a much wider scope of supply. Today, a ship supplier is a specialized trader or economic operator, who will deliver all goods to a vessel everything that the ship, its crew and passengers may require during time spend at sea or in port." Ship supplying can only be carried out by the smooth co-operation among ship suppliers, ship owners, freight forwarders, port authorities, customs and taxation authorities, and others.
The ship supply industry, which is a part of the port logistics industry, is a high value-added industry within in port-related industry. Jung and Kim(2007) concluded that the port logistics industry contributes by creating new quantities and keeping existing quantities by comparing and analyzing condition of the port logistics industry at major ports. They insisted that a logistics hub country in the Northeast Asia strategy should be accompanied by a development policy of the port logistics industry. Han et al.(2006) described the port logistics industry as an industry that attracts maritime industry and foreign companies. Yochum and Agarwal(1984) subdivided the port-related industry into three categories:
mandatory, attracting, and ripple industries. It showed a ripple effect of the port-related industry. Hayuth and Fleming(1994) found that the service level of the port-related industry is one of the major factors in determining location of Wayports.
Busan Development Institute(BDI) reported that the quantity of containers transported at the Port of Busan in 2009 decreased by 11.1% compared to the previous year because of the international financial crisis. In contrast, an increment of vessels passing through the Port of Busan is 13.8% in the same period. These vessels stop at the Port of Busan for oil, ship supplies, any repairs to the vessel, and rotation of crews. Note that the volume of ship supplies drastically increased by 48.4% compared to the previous year. Since there are limits to creating quantity, this indicates that, in order to handle these changes in circumstance, the Port of Busan needs to formulate a new strategy. In other words, the Port of Busan should be looking for ways to create new value, since it is more difficult to compete with other ports with only a port facilities and
supply strategy. Since the ship supply industry, a part of the port logistics industry, generates a significant synergy effect between other port logistic industries, the ship supply industry is a key industry for the activation of the port logistics industry and port growth.
There are some obstacles for the growth of the ship supply industry at the Port of Busan. First, the excessive competition among the ship supply companies causes a deterioration of the business. Since the ship supply industry entry system converted from a permit system to a reporting system in 1999, the numbers of companies in the industry increased by almost three times. Second, the small and complex retail structure of the industry hinders industrial development, which causes such obstacles as changes in economies of scale, inefficient supply chains and miscommunications among supply chain channels. This also causes high operating expenses of the companies. Since these companies do not achieve economies of scale and some warehouses are located a distance from the port, costs for transportation and inventory management also increase.
2.2 Literature Reviews about Activation strategies of the ship supply industry
Previous researches presented various activation plans to solve problems in the ship supply industry. Kim(2006) suggested that the ship supply distribution center, legal and institutional support, and e-procurement processes are crucial components of a viable activation plans. Park et al.(2007) concluded that aggressive marketing should also be incorporated in the activation plans. Table 1 shows a comparison among the ship supply industry's activation plans presented by previous studies.
Table 1 A comparison among ship supply industry's previous studies' activation plan
Researcher Activation plan
Kim, S.
(2006)
Park et al. (2007)
Kim, C.
(2006) Ship supply distribution
center ● ● ●
Legal and institutional
support ●
e-procurement process ●
Aggressive marketing ●
Additionally, considerable researches has indicated that a
lack of governmental support also reduces competitiveness in
the industry. While the tariff agency refunds tax that vessels spend for ship supplies at the Port of Busan, the complexity of the tax-refund process disrupts a quick response. Because of this, some vessels do not receive a tax refund during lay days. Moreover, the Port of Busan website does not introduce a list of ship supplies and related companies. The lack of information system for the Port of Busan also hinders the development of the ship industry at the port.
There are not many previous studies about the ship supply industry; however, those that have been performed suggested various development plans for the Port of Busan. Among them is the construction of a ship supply distribution center.
Since the ship supply industry at the port demonstrates a small and inefficient operation, communication difficulty among the channels, and a dispersion of warehouse and office, space, a centralized distribution center is required to achieve economies of scale and integrate a workable supply chain process.
3. A case study on oversea ports
The Port of Singapore, the port of Rotterdam, and the port of Kobe are selected for case studies. These ports are traditionally major ports for ship supply. The main reasons why these ports are selected are that the port of singapore and the port of rotterdam are stopover ports of major maritime routes. Also both ports deal with transhipment rather than exports and imports because both port do not have large economic background in their country. The port o Kobe is selected because it used to be a major port in trans-Asia route. However, the port of Kobe has lost its competitiveness because of downward trend of transit volume in the port. These ports is able to give implications to the port of Busan for development of ship supply industry.
3.1 The Port of Singapore
The Port of Singapore is a leading ship supply market in Asia. In 2004, 43 vessels per day, which is approximately 9%
of the vessels touching at Singapore, (482 vessels), stopped only for ship supplies, and 193 vessels purchased ship supplies during the loading and unloading. There are several factors for the growth in the Singaporean ship supply industry, such as its geographical advantage, price competitiveness, economies of scale, and a variety of ship supplies. Above all, in order to create high-added value, the Singapore government has a strong desire to develop and grow the ship supply industry.
Since Singapore is located on the Strait of Malacca, which
is in between Europe and the Africa-East Asia route, vessels that are not required to touch at the Port of Singapore sill stop purchase ship supplies. Buying power, global networks, and the simple supply chain of the Singaporean ship supply companies translate to high-price competitiveness. The ship supply industry in Singapore does not have its own manufacturing facilities and procures its supplies from overseas manufacturers. Instead, the since ship supply companies operate large ship supply distribution centers, the companies easily achieve economies of scale for ship supplies procurement and exchange information.
Moreover, the industry supplies about 25,000 ship supply products of the 35,000 products that are located in the International Marine Purchasing Association(IMPA) catalogue. Re-exports after imports are exempted from duty and value-added taxes, are also easy to refund. Furthermore, there is no heavy traffic in downtown Singapore because of the Singaporean transportation policy; therefore, cost reduction and time saving are possible when vessels procure their supply of products in Singapore. Above all, the Singaporean government operates a ship supply distribution center whose location is close to the port. Ship supply companies have the opportunity to form a cluster of businesses, which causes a vertical- and cross-integration effect. The Singaporean government also holds a ship supply fair every other year.
3.2 The Port of Rotterdam
The Port of Rotterdam in the Netherlands has grown to become a leading port in the European ship supply industry mainly because of the Dutch government's preferential treatment of trade, as well as the Netherlands' geographical characteristics, similar to Singapore's port and physical location. The number of ship supply companies in the port of Rotterdam reached approximately 190 in 2005. Most of companies focus on parts of the vessel and the engine. Since these companies take a large share of the ship logistics industry and are spread between the Europort and Botlek regions in the port of Rotterdam, vertical- and cross-integration synergy effect is created. A major unique characteristic of the ship supply industry in Rotterdam is that each ship supply company maintains goods in stock that are general-purpose ship supplies produced in countries with low production costs.
3.3 The Port of Kobe
Japanese ports operate ship supply distribution centers that
are jointly set up with funding from small and large ship
supply companies. Responding to the industry being designated as an "advanced industry." the Port of Kobe built its center earlier than others so as to be an early competitor in the promotion of the ship supply industry. A lesson learned from this is that ship supply companies become larger due to the achievement of economies of scale and the supply of specialized ship products. Table 2 shows critical factors of overseas ports' operation.
Table 2 Critical factors of overseas ports' success.
Ports
Critical factors
Singapore port
Rotterdam port
Kobe port
Geographical advantage ● ●
Companies' internal factors
Larger size ● ●
Specialization ● ●
Variety of
Products ●
Networks ●
Integration ●
Legal and institutional
support
Tax break ● ●
Others ●
Others
Ship supply distribution
center
● ●
Efficient distribution
channel
●
4. Factors for activation strategy and research hypotheses
4.1 Data collection and characteristics
To achieve the objective of this study, surveys were conducted to ship suppliers in September 2010. After sending a notice about survey, questionnaires were sent to ship suppliers, who are stakeholder in ship supply industry, via fax, mail, and e-mail, since they are not easy to touch and busy. Total 350 questionnaires were sent and 151 responses returned. However, 133 responses were used for this study because 18 responses had missing value and were inconsistent.
Ship supply wholesalers, accounting for 77.4 percent, are major parts among responses. Most popular products are machinery and part equipments(26.3%) and sales of 75.9
percent of responses are more than 200 million Korean Won per month. Table 3 shows characteristics of responses as follows:
Table 3 Characteristics of responses
Characteristics Relative Frequency(%) Characteristics Relative Frequency(%)
Type of business
Manufacturing 9(6.8) Retail 21(15.8) Wholesale 103(77.4)
Average monthly sales (million Korean Won)
less than30 10(7.5) less than 100 8(6.0) less than 200 14(10.5) more than 100 101(75.9)
Item (Multiple answer: 312)
groceries 20(6.4) cleaning 2(0.6) crew products 73(23.4) electronics 15(4.8) oil/water 2(0.6) machinery equipments 82(26.3) special equipments 41(13.1) ship supplies 77(24.7)
Number of employees (people)
less than 6 18(13.5) less than 10 27(20.3) less than 18 (13.5) less than 30 45(33.8) more than 30 25(18.8)
total 133(100%)
4.2. Factors for an activation strategy
Factors for an activation strategy are derived from activation plans presented from previous studies, as well as critical factors of overseas case studies. It is predicted that these factors will cause the activation of the Port of Busan's ship supply industry.
Since the sixth question and ninth questions are doubtful commonality and cross-loading, respectively, in exploratory factor analysis, these two questions are excluded from survey questions. The exploratory results are shown in Table 4.
The Kaiser-Meyer-Olkin(KMO) value, which determines the level of relationship among all questions without sixth and ninth questions, is 0.581. The Bartlett test value is 0.000.
This indicates that the factor analysis is statistically possible.
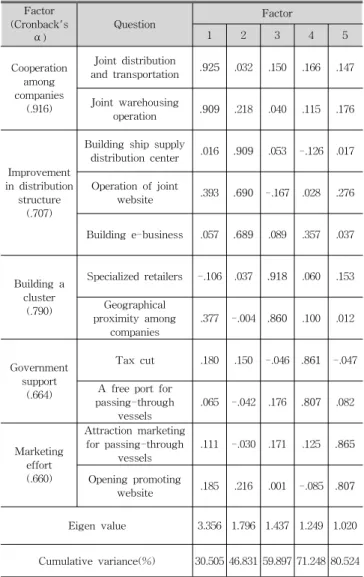
The varimax rotation is conducted for exploratory factor analysis of all 11 out of 13 questions. The lowest value of commonality determining variance of variables is 0.614. A total of five factors is extracted in terms of Eigen value(>1.0). All Cronbach's ⍺, statistically significance for each extracted factor, is over 0.6.
Extracted five factors named cooperation among
companies, improvement in distribution structure, building a
cluster, government support, and marketing effort. Activation
strategies for the ship supply industry at the Port of Busan
are completed by reference from previous research and case
studies. It is expected that activation strategies for the ship supply industry at the Port of Busan take concrete shape through these factors.
Table 4 Survey questions for the research
Factor (Cronback's
⍺)
Question Factor
1 2 3 4 5
Cooperation among companies
(.916)
Joint distribution
and transportation .925 .032 .150 .166 .147
Joint warehousing
operation .909 .218 .040 .115 .176
Improvement in distribution structure
(.707)
Building ship supply
distribution center .016 .909 .053 -.126 .017
Operation of joint
website .393 .690 -.167 .028 .276
Building e-business .057 .689 .089 .357 .037
Building a cluster
(.790)
Specialized retailers -.106 .037 .918 .060 .153
Geographical proximity among
companies
.377 -.004 .860 .100 .012
Government support
(.664)
Tax cut .180 .150 -.046 .861 -.047
A free port for passing-through
vessels
.065 -.042 .176 .807 .082
Marketing effort (.660)
Attraction marketing for passing-through
vessels
.111 -.030 .171 .125 .865
Opening promoting
website .185 .216 .001 -.085 .807
Eigen value 3.356 1.796 1.437 1.249 1.020
Cumulative variance(%) 30.505 46.831 59.897 71.248 80.524
4.3 Research hypotheses
It is necessary to prioritize activation strategies for the ship supply industry at the Port of Busan among the extracted five strategies. This is required in order to determine the relationship between necessity and the importance of perceived activation, and the extracted five activation strategies. The hypotheses for the correlation between necessity and importance of perceived activation plans, and the extracted activation factors of the ship supply industry by previous studies and overseas case studies are developed. Previous studies about the ship supply industry presented various activation plans; however, there is no research on how ship supply companies, a stakeholder in the ship supply industry, perceive the activation plan. Therefore, the objective of this study is to determine the correlation
between the necessity and the importance, and perceived activation factors of the ship supply plans. The hypotheses are as follows:
1) Hypotheses associated with the cooperation factor among companies.
① Hypothesis 1-1: There is a positive correlation between companies' cooperation and the importance of the perceived ship supply industry activation.
② Hypothesis 1-2: There is a positive correlation between companies' cooperation and the necessity of the perceived ship supply industry activation.
2) Hypotheses associated with improvement factors of the distribution structure.
① Hypothesis 2-1: There is a positive correlation between distribution structure improvement and the importance of the perceived ship supply industry activation.
② Hypothesis 2-2: There is a positive correlation between distribution structure improvement and the necessity of the perceived ship supply industry activation.
3) Hypotheses associated with building the ship supply cluster.
① Hypothesis 3-1: There is a positive correlation between building clusters and the importance of the perceived ship supply industry activation.
② Hypothesis 3-2: There is a positive correlation between building clusters and the necessity of the perceived ship supply industry activation.
4) Hypotheses associated with government support.
① Hypothesis 4-1: There is a positive correlation between government support and the importance of the perceived ship supply industry activation.
② Hypothesis 4-2: There is a positive correlation between government support and the necessity of the perceived ship supply industry activation.
5) Hypotheses associated with the marketing effort.
① Hypothesis 5-1: There is a positive correlation between the marketing effort and the importance of the perceived ship supply industry activation.
② Hypothesis 5-2: There is a positive correlation
between the marketing effort and the necessity of
the perceived ship supply industry activation.
4.4. Operational definitions
An operational definition defines something in terms of the specific process or set of validation tests used to determine its presence and quantity. In other words, one defines something in terms of the operations that count as measuring it. Measurement items are developed for this study to estimate the relationship between perceived activation strategies and extracted activation strategy of the ship supply industry. Operational definitions for this study to verify the research model are indicated in Table 5.
Much research has indicated that fierce competition in the ship supply industry is a leading factor hindering the activation of the industry. It is the reason why this research sets up an operational definition of the cooperation as a major factor. The following four questions are evaluated with a seven-point Likert scale: promoting the effort with the use of a website, joint warehousing operations, attraction marketing for passing-through vessels, and joint distribution and transportation.
Government law and regulation support is necessary for activation, according to previous research. Therefore, government law and regulation support is also set up as an operational definition. Two questions relating to tax cuts and a free port for passing-through vessels are evaluated with a seven-point Likert scale. Improvement in the distribution structure, such as building a ship supply distribution center, building e-business, and operating joint websites, is also evaluated with seven-point Likert scale.
A cluster is a small group or bunch of something that produces a synergy effect, based on geographical proximity and special knowledge. Building a cluster is necessary because a cluster promotes proximity, similarity, and grouping among companies and related agencies. Building a cluster for specialized retailers and geographical proximity among companies is evaluated with a seven-point Likert scale. The marketing effort, including attraction marketing for passing-through vessels and designing a promotional website, is evaluated with a seven-point Likert scale. The importance and necessity of the ship supply industry activation are also evaluated with a seven-point Likert scale in order to investigate the relationship with established activation plans that emanated from previous studies.
From September 1, 2010, to September 15, 2010, this study entailed conducting a survey targeting employees in the ship supply industry via phone, fax, and email. From a total of 350 questionnaires that were sent, 151 questionnaires were returned. Among these, a total of 133 questionnaires were ultimately used for the study, since 18 questionnaires lacked
statistical significance. The survey questions consisted of such issues as problems of the ship supply industry, the level of necessity and importance of the ship supply industry activation, and characteristics of responding companies.
Table 5 Operational definitions for this study
Factor
1 Cooperation among companies
2 Government support
3 Improvement in distribution structure
4 Building a cluster
5 Marketing effort
6 Necessity of ship supply industry activation 7 Importance of ship supply industry activation
5. Results of Analysis
5.1 Testing of hypotheses
A Pearson correlation analysis was conducted in order to estimate the correlation between existing activation plans and the importance of perceived activation, as well as existing activation plans and the necessity of perceived activation.
Table 6 Results of correlation analysis
Pearson correlation coefficient
Cooperation among companies
Improvement in distribution
structure
Building a cluster
Govern ment support
Marketing effort
Improveme nt in distribution
structure
.367**
Building a
cluster .273** .048
Government
support .288** .174* .190*
Marketing
effort .355** .281** .206* .071
Importance of ship supply industry activation
.125 .257** .065 .272** .080
Necessity of ship supply industry activation
.045 .306** -.090 .266** .038
M.(S.D.) 4.58 (0.93)
5.26 (1.11)
4.42 (1.49)
5.38 (0.97)
5.30 (1.19) Note) N = 133
* p<0.05, ** p< 0.01
The result indicated that improvements in the distribution structure correlates the importance and the necessity of perceived activation at 1% of statistical significance.
Moreover, government support also correlates importance and necessity of perceived activation at 1% of statistical significance.
However, three factors, cooperation among companies, building a cluster, marketing effort, do not significantly correlate importance and necessity of perceived activation.
As a result, improvement in distribution structure and government support among five factors positively correlate importance and necessity of perceived activation(Table 6).
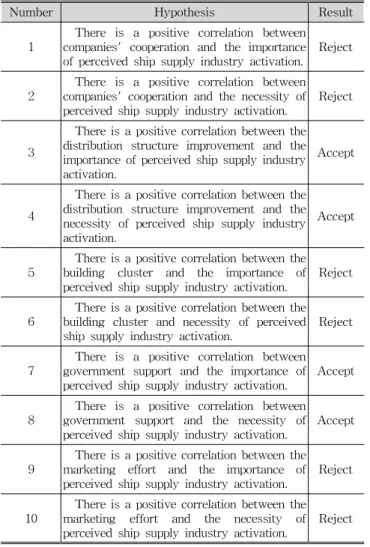
Results of the correlation analysis show that hypotheses 1-1, 1-2, 3-1, 3-2, 5-1, and 5-2 are rejected, since there is no significant correlation between the importance and the necessity of perceived activation. Besides, hypotheses 2-1, 2-2, 4-1, and 4-2 are accepted because there is a significant correlation between the importance and the necessity of perceived activation. Table 7 shows results of the hypothesis tests.
Table 7 Results of hypothesis tests
Number Hypothesis Result
1
There is a positive correlation between companies' cooperation and the importance of perceived ship supply industry activation.
Reject
2
There is a positive correlation between companies' cooperation and the necessity of perceived ship supply industry activation.
Reject
3
There is a positive correlation between the distribution structure improvement and the importance of perceived ship supply industry activation.
Accept
4
There is a positive correlation between the distribution structure improvement and the necessity of perceived ship supply industry activation.
Accept
5
There is a positive correlation between the building cluster and the importance of perceived ship supply industry activation.
Reject
6
There is a positive correlation between the building cluster and necessity of perceived ship supply industry activation.
Reject
7
There is a positive correlation between government support and the importance of perceived ship supply industry activation.
Accept
8
There is a positive correlation between government support and the necessity of perceived ship supply industry activation.
Accept
9
There is a positive correlation between the marketing effort and the importance of perceived ship supply industry activation.
Reject
10
There is a positive correlation between the marketing effort and the necessity of perceived ship supply industry activation.
Reject
5.2 Regression
Regression among necessity and importance with variables is performed to support results of hypothesis tests conducted in this study. This is able to be important analysis because it is possible to confirm whether perceived activation plans, which are analyzed by correlation analysis, are related to importance and necessity.
Results of additional multiple regression between perceived importance of activation plans and improvement in distribution structure, and government support show very similar results of the correlation analysis(β=.225, t-value=2.454; β=.239, t-value=2.712). Second, multiple regression between perceived necessity of activation plans and improvement in distribution structure, and government support show very similar results of the correlation analysis (β=.306, t-value=3.440; β=.268, t-value=3.138). Regression also shows that cooperation among companies, building a cluster, and marketing effort are statistically significant as the correlation analysis. Table 8 shows results of regression as follows:
Table 8 Results of regression
Model Variable standardized β t-value R2
Model 1 (dep.
Importance)
Cooperation among
companies -.033 -.339
.347 Improveme
nt in distribution
structure
.225 2.454*
Building a
cluster .016 .187
Government
support .239 2.712**
Marketing
effort .008 .089
Model 2 (dep.
Necessity)
Cooperation among
companies -.109 -1.148
.414 Improveme
nt in distribution
structure
.306 3.440**
Building a
cluster -.125 -1.462
Government
support .268 3.138**
Marketing
effort -.002 -.023