Analysis of the GOP Border security systems of the ROK Army by Using ABMS and NOLH design
Kyungtack Oh
1†ABMS와 NOLH을 이용한 한국군 GOP 경계시스템에 관한 분석
오경택
ABSTRACT
In this study, the border security problem of the ROK Army is examined by applying the agent-based modeling and simulation (ABMS) concept as well as its platform, MANA. Based on the approximately optimized behavior of the infiltrator obtained using genetic algorithm (GA), we evaluate the GOP border security system which consists of human resources, surveillance, as well as command and control (C2) systems. We use four measures of effectiveness (MOEs) to evaluate its performance, and we apply a near optimal latin hypercube (NOLH) design to deal with the large number of factors of interest in our model. By using a NOLH design, our simulation runs are implemented efficiently. We hope the results of this study provide valuable data for deciding the configuration of the border security system structure and the number of soldiers assigned in the platoon.
Key words : ABMS, border security system, NOLH design, MOEs
요 약
본 논문은 에이전트 기반 모델링 및 시뮬레이션 개념과 그 플랫폼인 MANA를 적용한 연구이다. 유전학적 알고리즘을 이용 하여 획득한 근사 최적화된 침투하는 적의 행동을 바탕으로 병력, 감시, 통신 시스템들로 이루어진 GOP 경계시스템의 효과를 평가하였다. 경계시스템의 효과 분석을 위해 4가지의 효과척도를 이용하였고, 모델을 구성하는 다수의 경계 자산을 고려하기 위해 NOLH 디자인을 적용하였다. NOLH 디자인을 적용함으로써, 시뮬레이션을 효과적으로 수행할 수 있었다. 이 연구의 결 과는 경계시스템을 구성하는 경계자산의 효과적인 구성과 소초에 적정한 병력배치 등을 결정하는데 좋은 자료를 제공할 수 있을 것으로 기대한다.
주요어 : 에이전트 기반 모델링 & 시뮬레이션, 국경경계시스템, NOLH 디자인, 효과척도
접수일(2014년 2월 6일), 심사일(2014년 6월 3일), 게재 확정일(2014년 6월 16일)
1)육군사관학교 운영분석과
주 저 자: 오경택 교신저자: 오경택 E-mail; [email protected]
1. Introduction
This study develops and analyzes a model of the ROK Army’s border security system, which aims to prevent the infiltration of the enemy in the DMZ. The analysis uses a 10
×7km section of the DMZ, representing the area of responsibility of a battalion in the 5th infantry division.
1.1 Scope of this study
Our model in MANA is formulated with Fixed Guard Posts (FGPs), Moving Guard Posts (MGPs), TODs, platoon Command and Control Centers (CCCs), and battalion CCC as available agents. We analyze the border security system in terms of an overall system instead of considering these assets individually.
Our model exploration analyses an efficient experimental
design methodology to capture a large number of interactions
between the agents that may potentially affect the scenario
outcomes. The controllable factors mainly include guard
post parameters (detection range), equipment parameter
Fig. 1. DMZ between South and North Korea
Fig. 2. Configuration of the DMZ (for the TODs), network parameters (latency and reliability
of network), and reinforcement troop parameters (response time, maneuver speed). The only type of uncontrollable parameters are the enemy parameters (detection range) that characterize infiltration behavior.
The model is run multiple times, varying a large number of design points, i.e., values for the controllable and uncontrollable factors. Then regression analysis, a statistical technique, is used to provide insights to the following question:
・ Given the limited resources, what are the optimal combinations of sensors, surveillance and command and control (C2) systems to detect, classify and prevent enemy infiltrations into the DMZ?
1.2 Literature review
Since the 9/11 terrorist attack, there have been numerous types of studies on border security systems and other security systems in the U.S., but few studies have been conducted in South Korea. Berner
[1]analyzes the best combination of broad area maritime surveillance, UAV, and Vertical Take-off UAVs (VTUAVs) through ABMS.
Pulat
[2]develops two-side optimization model using a mixed integer linear program to minimize the maximum achievable probability of infiltrator escape. Sung
[3]develops a security guard model to calculate the enemy detection rate and develops a TOD model to optimize the location of new equipment for the DMZ border security system.
Based on these two models, Sung suggests an integrated model which incorporates the security guard model and the TOD model. While Sung obtains the detection rate of the TOD model, he also comments that a simulation model would have given better results for this problem because his model does not consider the enemy.
1.3 GOP border security concept
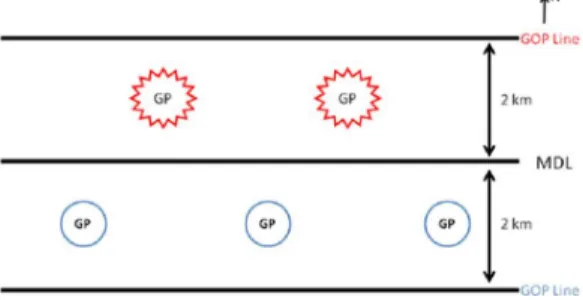
The overall shape of the Korean DMZ is depicted in Fig. 1. The length of the DMZ is approximately 248km (155 miles) and its maximum width is 4 km.
As Fig. 2 depicts, GOP lines are formed on each side of the DMZ from the central line, namely the military demarcation line (MDL). A guard post (GP) depicted in Fig. 2 is a type of security element located between the
MDL and GOP lines. We do not consider GPs in our study due to their sensitive and classified nature.
2. Model development
Based on the description given in Section 1.3, and information on how the security system is implemented in reality, we develop the GOP border security system model using MANA
[4].We aim to formulate a model in which we can flexibly develop scenarios so that insights may be obtained as to how different scenarios behave. In order to change the variables specifying these scenarios we use data mining tools as described in Section 3.2.
2.1 GOP border security model with MANA
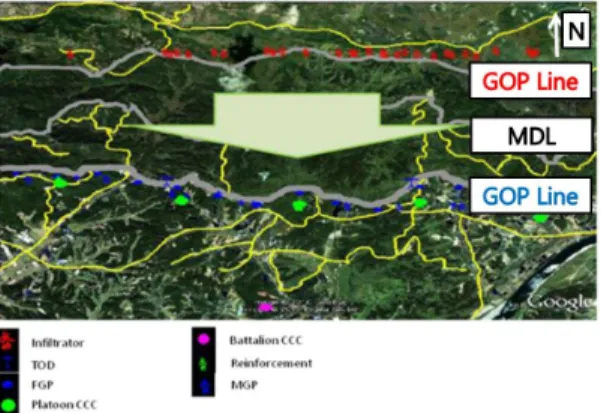
Fig. 3 shows a simple scenario of the border security
model when the number of FGP = 3, MGP = 3 and
Reinforcement = 8 per platoon and the number of TOD =
2 per battalion with terrain map. In this simple scenario,
the TOD detects the infiltrator, sends the information to
the battalion CCC, then the battalion CCC makes decision
and directs the platoon CCC to dispatch the reinforcement
Fig. 3. Screenshot of the GOP border security system model
along with the GOP line.
As MANA 4 has its own unit, we define that the MANA distance unit 1 = 10 m and time unit 1 = 5 sec and transform input parameters throughout the model.
When we compare the result of the human resource model of Sung
[3]with the parameters revealed in his paper, we obtain comparable results to his work. Compared to his model, our model’s new contribution is to consider the infiltrator, and to jointly combine the human resource model and equipment model, which is separately implemented in his work.
2.2 Infiltrator
The behavior of the infiltrator is a significant variable that affects the results. We only assume that the enemy has a longer detection range than the FGP and MGP when these defensive human resources are in their default state.
Furthermore, the objective of the infiltrators is to reach the waypoint without being killed. We exclude the case when the infiltrators attack the border security.
In the previous work
[5], we formulated an optimization model and approximately solved it using a GA in order to capture near optimal behavior of an infiltrating force. we used five simulation model constructs as decision variables to control that behavior, as enumerated below:
・ Next waypoint ;
・ Avoid FGPs ;
・ Avoid Reinforcements ;
・ Avoid MGPs ;
・ Speed of movement ;
In our experiments, the GA obtains its best solution.
The best behavior of the infiltrator is used to evaluate the effectiveness of security assets in the following section.
3. Analysis of the GOP border security system
3.1 MOEs
In the context of the overall security system, it is useful to choose representative MOEs to evaluate and compare the results of different configurations and the values of numerous factors including number of assets, detection range, shooting distance, etc. Although multiple MOEs can result in more sophisticated measures, limitations of the capabilities of MANA must also be considered. Based on these considerations, four MOEs are identified:
・ Probability of enemy detection (MOE 1);
・ Probability of enemy kill (MOE 2);
・ Average time to reach enemy waypoint (MOE 3);
・ Probability of enemy mission failure (MOE 4).
Each experiment starts with single infiltrator whose initial location is uniformly distributed along the 2km segment of interest on the northern edge of the GOP line, as described earlier. The infiltrator then proceeds south, towards his final waypoint. One of four events then occurs:
He is first detected by a TOD, he is first detected by FGP, he is first detected by a MGP, or he reaches the final waypoint undetected. We let TODD, FGPD, and MGPD denote the first three of these events. Then, we can represent MOE 1 as:
MOE 1 = P(TODD)+P(FGPD)+P(MGPD),
Where P( . ) is the probability associated with the
corresponding event. If the enemy is first detected by a
TOD then subsequently detected by an FGP or MGP then
event TODD occurs but events FGPD and MGPD do not
occur, i.e., the detection of the enemy is only counted
once. We can define FGPK, MGPK, and ReinK in a similar
manner, more specifically the event that the infiltrator is
killed by a FGP, MGP, or Reinforcement, respectively. In
our scenario, Reinforcements are deployed conditioning
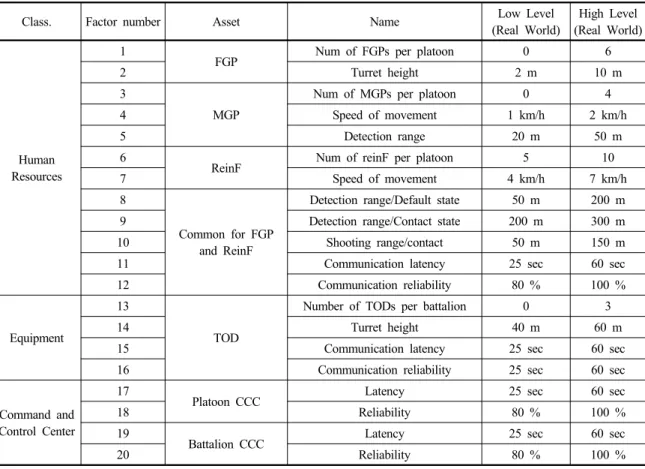
Table 1. Important factors and range of the GOP border security system.
Class. Factor number Asset Name Low Level
(Real World)
High Level (Real World)
Human Resources
1 FGP Num of FGPs per platoon 0 6
2 Turret height 2 m 10 m
3
MGP
Num of MGPs per platoon 0 4
4 Speed of movement 1 km/h 2 km/h
5 Detection range 20 m 50 m
6 ReinF Num of reinF per platoon 5 10
7 Speed of movement 4 km/h 7 km/h
8
Common for FGP and ReinF
Detection range/Default state 50 m 200 m
9 Detection range/Contact state 200 m 300 m
10 Shooting range/contact 50 m 150 m
11 Communication latency 25 sec 60 sec
12 Communication reliability 80 % 100 %
Equipment
13
TOD
Number of TODs per battalion 0 3
14 Turret height 40 m 60 m
15 Communication latency 25 sec 60 sec
16 Communication reliability 25 sec 60 sec
Command and Control Center
17 Platoon CCC Latency 25 sec 60 sec
18 Reliability 80 % 100 %
19 Battalion CCC Latency 25 sec 60 sec
20 Reliability 80 % 100 %
on the upgrade of border security level when detection is occurred by FGP, MGP, or TOD. We can define MOE 2 as
MOE 2 = P(FGPK)+P(MGPK)+P(ReinK | Security level upgraded).
MOE 3 represents the average time the infiltrator takes to reach their waypoint, given that they reach it within 1500 time steps. Finally, MOE 4 is the sum of the probability that the enemy is killed and the probability he is not killed but still fails to reach the final waypoint within 1500 time steps.
3.2 Design of experiment
3.2.1 Important Factors and Range
Our simulation model has many inputs that can be varied across a range of reasonable values. When this is
the case we must select a means for considering such an enormous number of possible combinations.
Among the numerous factors which comprise our border security model, twenty significant factors are identified in Table 1. The table groups these factors depending on whether they are specific to human resources, equipment(TOD) or the CCCs. Moreover, the table further indicates whether those human resources are FGPs, MGPs, or reinforcements, and whether it involves the platoon CCC or the battalion CCC.
3.2.2 NOLH Design
Latin Hypercube(LH) designs provide a flexible way to
construct efficient designs for quantitative factors
[6]. In
this study, the NOLH design helps reduce the computational
requirements of some classic designs by many orders of
magnitude, while still capable of developing a better
understanding of a complex simulation model.
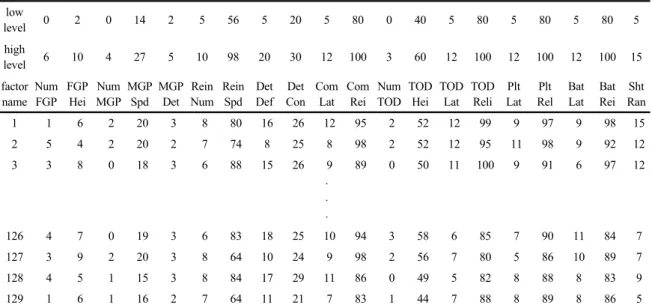
Table 3. NOLH design with 20 factors and 129 runs low
level 0 2 0 14 2 5 56 5 20 5 80 0 40 5 80 5 80 5 80 5
high
level 6 10 4 27 5 10 98 20 30 12 100 3 60 12 100 12 100 12 100 15
factor name
Num FGP
FGP Hei
Num MGP
MGP Spd
MGP Det
Rein Num
Rein Spd
Det Def
Det Con
Com Lat
Com Rei
Num TOD
TOD Hei
TOD Lat
TOD Reli
Plt Lat
Plt Rel
Bat Lat
Bat Rei
Sht Ran 1 1 6 2 20 3 8 80 16 26 12 95 2 52 12 99 9 97 9 98 15 2 5 4 2 20 2 7 74 8 25 8 98 2 52 12 95 11 98 9 92 12 3 3 8 0 18 3 6 88 15 26 9 89 0 50 11 100 9 91 6 97 12
·
·
·
126 4 7 0 19 3 6 83 18 25 10 94 3 58 6 85 7 90 11 84 7 127 3 9 2 20 3 8 64 10 24 9 98 2 56 7 80 5 86 10 89 7 128 4 5 1 15 3 8 84 17 29 11 86 0 49 5 82 8 88 8 83 9 129 1 6 1 16 2 7 64 11 21 7 83 1 44 7 88 8 89 8 86 5 Table 2. Requirement for NOLH design
No. of factors No. of Design points
2~7 17
8~11 33
12~16 65
17~22 129
23~29 257
Let k denote the number of factors and let
≥ denote the number of design points. If each factor has 2 or 5 levels we could employ a
or
factorial design but the number of design points increases exponentially with k and quickly becomes impractical. To avoid the danger associated with high pairwise correlations associated with random LH designs, we employ the ideas of Cioppa and Lucas
[7], who develop NOLH design with good space-filling and orthogonality properties. In Table 2, the number of required design points is dramatically reduced from that of a full factorial
design. Such design points are easily generated through the NOLH.xml file, which can be downloaded at the Seed center website
[8].
We use our 20 factors from Table 2 with varying number of levels for each factor. A full factorial design
would require
× design points whereas only 129 design points are used in our NOLH design, as indicated in Table 2. Based on the factors and ranges of the GOP border security system from Table 1, a NOLH design is generated, which an excerpt shown in Table 3.
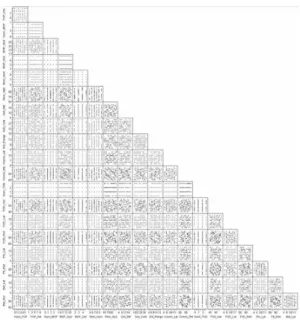
Fig. 4 shows the pairwise plots for each pair of design points. These show that, at least pairwise, the design points are spread out fairly evenly. The pairwise correlations from Fig. 4 range from –0.097 and 0.105, suggesting pairwise correlations are relatively low.
3.3 Model run
After generating 129 design points based on a NOLH design, numerous replications of the simulation model are formed. From a single run of the simulation model the enemy is either detected or not, the enemy is either killed or not, and the enemy’s mission either fails or succeeds.
We encode these events in a binary manner, using 0s and 1s. We use 1000 replications of the simulation to form estimators for MOE 1, MOE 2, MOE 3, and MOE 4.
3.3.1 Analysis tools
We use Xstudy and OldMcdata
[9], developed by the
SEED Center, to facilitate the iteration through each of the
129 design points and to process output data from MANA.
Fig. 4. Pairwise scatter plots for NOLH design with 20
factors in 129 runsFig. 5. Data process flow
Xstudy uses information specified within a MANA scenario file to identify the factors that are to be varied.
Given a scenario file and the NOLH design file it generates a file called study.xml, which contains the study information about scenario, the number of replications, the exact specification of the algorithm for generating the factor variations, and factors to be used for that variation.
By using the study.xml file from Xstudy, OldMcData generates excursions which are modified from the original scenario file with the factors detailed in the sutdy.xml file.
For our GOP border security system model, 129 excursion files are generated and OldMcData conducts experiments using Condor
[10]. Condor is a workload management system developed at the University of Wisconsin-Madison for computationally intensive jobs. When the simulation
run terminates, OldMcData carries out post-processing in which it collects all output data into one file. The overall data process flow is described in Fig. 5.
To run the 129 excursions with 1000 replications for each excursion, the HPC (High Performance Computer) resources at the Naval Postgraduate School were used; the run time was approximately 6.5hours, which corresponds to approximately 240 hours on a typical personal laptop (2.4 GHz, 4.0 GB RAM).
3.4 Results analysis with statistical tools
After running the simulation model for 129 design points and 1000 replications for each design point, a total of
× data points are analyzed for each MOE. To perform a statistical analysis of the obtained data points and to provide an appropriate visual tool for the decision makers, JMP is primarily used in this study, because its features are dynamic, interactive, visual, and easy to use.
For this study, several techniques are used, which are listed below:
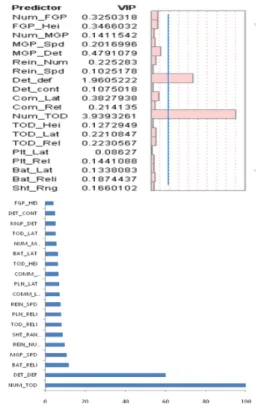
[11]・ Variable importance plot : PLS(Partial Least Square) regression in JMP and the variable importance score in TreeNet are used to identify importance factors among the 20 used in our model. Variable importance in the projection (VIP) is obtained by using PLS regression, and it summarizes the contribution a variable makes to the model, i.e., its correlation to the response (MOE).
This enables us to choose the number of extracted factors by fitting the model to a subset of these factors and minimizing the prediction error. If a factor has a small VIP, then it means that the factor does not influence much on response. VIP score below one (We use 0.8 instead of 1
[12]) can be considered a small VIP since the average of squared VIP score is one.
・ Contour plot : This is a graphical representation of the relationships among three numeric variables in two dimensions. Two important factors are identified from the VIPs, and each MOE provides a third variable for the contour levels.
・ Bivariate scatter plot and fitting : This explores how the
distribution of one continuous factor is related to another
continuous factor. The analysis begins with scatter plot
of points, to which we can interactively add other types
Table 4. Pair-wise correlations between
Variable Variable Correlation Lower 95%
Upper 95%
Detection(X) Casualty(Y) 0.1326 0.1271 0.1379 Mission(Z) Detection(X) 0.4182 0.4137 0.4227 Mission(Z) Casualty(Y) 0.4012 0.3966 0.4058 Remain(F) Detection(X) 0.3621 0.3573 0.3668 Remain(F) Casualty(Y) -0.2065 -0.2117 -0.2013 Remain(F) Mission(Z) 0.8130 0.8112 0.8149
Fig. 6. VIP score(top) and variable importance score(bottom)
for MOE 1of fits, such as simple linear regression and polynomial regressions of selected degree.
3.5 Relation between MOEs
The correlation coefficient(
) between random variables for the estimators of MOEs (
) can give insights into linear relationship between MOEs. In our model, the enemy detected (X), killed (Y), and mission failed (Z) are the random variables which have binary number ‘0’ or ‘1’, i.e., detected(1) or not detected(0), from which
,
, and
can be estimated as shown in Section 3.1. Instead of the time length variable, the infiltrator remained (F) variable is added for a better understanding of
. This result shows how the mission failure of infiltrator is caused by either a kill or remaining above the GOP line. The multivariate platform of JMP is used to explore the relationship and dependency between random variables. Suppose we compute the sample
between two random variables, enemy detection (X) and enemy killed (Y), to explore the correlation between
and
. We have
× with an iid pair of X and Y, written as
and
where
, then we can estimate the
between X and Y by computing:
,
where
and
are the sample means,
and
are the sample standard deviations of X and Y respectively. The matrix in Table 4 summarizes the strength of the linear relationship between each pair of random variables.
The dependency between X and Y is only 0.1326 which is lower than one might anticipate. The reason is that most detection of infiltrators was by the TOD. TOD does not have an ability to kill directly from a long distance. From this result, we observe the necessity of enforcing the connection between surveillance systems and weapon systems.
By observing the correlation between F and Z, at around 0.8130, we conclude that the mission failure of the infiltrator is mostly caused by remaining above the GOP line within 1500 time steps.
Considering only one MOE can be relatively simple, but the results above show that it can be insufficient and have limitations in evaluating the overall system. The following section shows the statistical results for each MOE.
3.6 Probability of Enemy Detected(MOE 1)
Simulation results are analyzed through JMP and
TreeNet as can be seen in Fig. 6. The VIP plot in the left
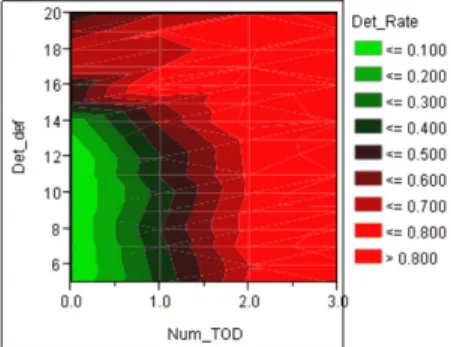
Fig. 7. Contour plot for MOE 1 correspond to the detection
range and the number of TODNo. of TOD = 0 No. of TOD = 1
No. of TOD = 2 No. of TOD = 3
Fig. 8. MOE 1 corresponding to the detection distance and
the number of TOD
side of Fig. 6 reports the VIP scores corresponding to the 20 factors. The factors which have VIP score greater than 0.8, denoted by the blue vertical line in the left figure, represent important factors among the twenty. The graph in the right side of Fig. 6 reflects the contribution of each factor in predicting MOE 1 by regression in TreeNet. We identify the number of TODs and detection range (default state) as the important factors with the VIP scores of 3.94 and 1.96, and the variable importance scores of 100% and 60% respectively. These scores are calculated using the results of both methods as shown in Fig. 6.
We can see that the security guards, including FGP and MGP, does not contribute much to the enemy detection
according to the results in Fig. 6.
The contour plot for MOE 1 corresponding to the number of TODs and the detection range (default state) is identified in Fig. 7. In general, as the number of TODs and the detection range increases, MOE 1 tends to increase.
Since the infiltrator is assumed to have a detection range of 150m, MOE 1 abruptly increases when the detection range becomes 150m. The detection rate has a relatively high spread from 0 to 0.8 when none of the TODs are used in the operational area, whereas it ranges from 0.6 to 0.9 when two TODs are used. When the number of TODs is greater than or equal to 2, then the MOE 1 is always greater than 0.6. Later, we explore this using a regression.
Since the number of TODs seems to be the most important factor of the surveillance system, i.e., MOE 1 is most sensitive to changes in the number of TODs, this sensitivity is further examined in Fig. 8. The variability chart shows that when the number of TODs is more than one, the value of MOE 1 becomes reasonably stable, whereas it has a huge variability when the number of TOD is strictly fewer than two.
4. Conclusion
In this paper, the border security problem of the ROK Army is examined by applying the ABMS concept and its platform, MANA. Based on the stream of border security using ABMS, this study contributes to the military operations for the following aspects.
First, in a departure from the previous works, this study suggests a way to evaluate the border security system in terms of three main systems, namely surveillance, communication, and weapon system, through the four MOEs. The coefficient correlation matrix of estimators for MOEs demonstrates the dependency of the pair of MOEs and it is expected to help analyze the system in different aspects.
Second, a variety of factors comprising the border
security system were considered in order to identify the
importance factors and obtain the interaction between
these factors. In a contrast to the previous works, the
number of assets (TOD, FGP, MGP, and reinforcement
오 경 택
([email protected])
2005 육군사관학교 이학사2008 텍사스 오스틴대학 운영분석&산업공학 석사 2012~현재 육군사관학교 수학과 조교수
관심분야 : 모델링&시뮬레이션, 국방 시뮬레이션, 메타휴리스틱
troop) are considered for some of the design point factors.
From the results using an enormous number of simulation runs, it was possible to determine the qualitative importance of each factor and to obtain the graphical results for the decision maker.
The results of this study can be a valuable resource in terms of deciding the configuration of the assets, border security system structure, and number of soldiers assigned to either a post or a platoon. The connection between the surveillance and weapon systems needs to be enforced in order to attain an effective border security system, based on the scenario we used.
From the basis of this study, the ROK army can evaluate an ongoing project, more specifically the GOP unmanned border security system, which aims to substitute human resources with cameras and sensors. The ROK Army also has plans to increase the number of TODs to improve the border security system. As we identified in the results of Section 3.5, the effectiveness of TOD is not linearly increased. Thus, the method used in this study can be applied to obtain the optimal number of assets given the limited budget.
References
1. Berner, A. R. (2004). The Effect Use of Multiple Unmanned Aerial Vehicle in Surface Search and Control. M. S.
Thesis. Naval Postgraduate School, Monterey, CA.
2. Pulat, H. (2005). A Two-sided Optimization of Border Patrol Interdiction. M. S. Thesis. Naval Postgraduate School, Monterey, CA.
3. Sung, C. (2005). Exploration of Matehmatical Modeling of the Border Security. Korea Advanced Institute of Technology (KAIST).
4. Galligan, D. P., Anderson, M. A., Lauren, M. K., &
McIntosh, C. G. (2007). MANA version 4 user manual.
DTA.
5. Kyungtack Oh., & Jae-Yeong Lee. (2013). Exploration of Border Security Systems of the ROK Army Using ABMS and GA Algorithm, Journal of Korea Society for Simulation, Vol 22(2), pp 33~40.
6. Sanchez, S. M. (2007). Work Smarter, Not Harder:
Guidelines for Designing Simulation Experiments. Winter Simulation Conference.
7. Cioppa, T. M. (2005). Efficient Nearly Orthogonal and Space-filling Latin Hypercubes, Naval Postgraduate School, Monterey, CA.
8. SEED Center for Data Farming. (n.d.). Retrieved 12. 03, 2013, from http://harvest.nps.edu
9. Upton, S. C. (2006). User’s Guide, OldMcData-The Data Farmer, ver 1.0 beta.
10. University of Wisconsin-Madison. Condor. Retrieved from http://www.cs.wisc.edu/condor/
11. Proust, M. (2008). JMP Statistics and Graphics Guide, released 8. SAS Institute.
12. Wold, S. (1994). PLS for Multivariate Linear Modeling.
QSAR: Chemometric Methods in Molecular Design.
Methods and Principles in Medicinal Chemistry.