Ⅰ. Introduction
Obesity and fatty liver disease is a global health challenge. In the absence of appropriate management, it can progress to chronic liver disease, such as liver fibrosis or cirrhosis [1-4]. In particular, transplantation of more than moderate fatty liver in patients can trigger serious events such as hepatic dysfunction [5].
Thus, evaluation of hepatic fat deposition is one of the most important tasks in diagnostic radiology [6-9].
Liver biopsy is known to be the most accurate method for diagnosing fatty liver [10-12]. However, it can only be repeated a limited number of times in a short period and is associated with complications such as infection [13]. Computed tomography (CT) scan has been successfully used to evaluate intra-abdominal
<원저>
The Study of Lipid Proton Composition Change in a Rat Model of High Fat Diet Induced Fatty Liver by Magnetic Resonance
Spectroscopy Analysis
Kim Sang-Hyeok・Yu Seung-Man
Department of Radiological Science, Jeonju University
고지방식이 유도성 지방간 쥐 모델에서 간의 자기공명분광 분석을 이용한 지질 양성자 조성 변화 연구
김상혁・유승만
전주대학교 방사선학과
Abstract
The purpose of this study is to investigate the changes in lipid proton (LP) composition according to the in- duced obese fatty liver and to use it as basic data for treatment and diagnosis of fatty liver in the future. The phantom study was conducted to identify differences between STEAM and PRESS Pulse sequences in LP concentration. A high-fat diet (60%) was administered to eight Sprague-Dawley rats to induce obesity and fatty liver disease. Baseline magnetic res- onance imaging /spectroscopy data were obtained prior to the introduction of high-fat diet, and data acquisition experi- ments were performed after eight weeks using procedures identical to those used for baseline studies. The six lipid pro- ton metabolites were calculated using LCModel software. The correlation between the fat percentage and each LP, re- vealed that the methylene protons at 1.3 ppm showed the highest positive correlation. The α-methylene protons to car- boxyl and diallylic protons showed negative correlation with fat percentage. The methylene proton showed the highest in- crease in the LP; however, it constituted only 71.86% of the total LP concentration. The methylene proton plays a lead- ing role in fat accumulation in liver parenchyma.
Key Words :
Fatty Acid, Fatty Liver, Magnetic Resonance Spectroscopy, Magnetic Resonace Imaging, Lipid Proton
중심 단어 :지방산, 지방간, 자기공명분광, 자기공명영상, 지질 양성자
This research was supported by Basic Science Research Program through the National Research Foundation of Korea (NRF) funded by the Ministry of Science, ICT & Future Planning (Grant no. 2021R1F1A1056078 and 2018R1D1A1A02085800)
Corresponding author: Seung-Man Yu, Department of Radiological Science, Jeonju University, 303, Cheonjam-ro, Wansan-gu, Jeonju-si, Jeollabuk-do, 55069, Republic of Korea / Tel:+2-63-220-2382 / E-mail: [email protected]
Received 10 August 2021; Revised 24 August 2021; Accepted 25 August 2021 Copyright ⓒ2021 by The Korean Journal of Radiological Science and Technology
fat within a short test period [14-16]. However, the quantification of fat deposition inside tissues is virtually impossible and test reproducibility is also limited due to radiation exposure [17]. Quantification of intra-hepatic fat using an ultrasonic test without the risk of exposure to ionized radiation is also difficult, and the inter-observer variations limit the collection of objective data. Even if the experimental method is accurate, it is impossible to observe changes in fatty acid composition of the liver. Magnetic resonance spectroscopy (MRS) can be used to accurately quantify fat composition while overcoming these limitations. MRS can not only analyze the molecular structure using the processed frequency changes caused by differences in physicochemical environment such as
1H,
13C, and
31P protons, but also estimate the concentration of quantified metabolites. In particular, the
1H-MRS lipid analysis can be used to express the respective concentrations: 0.90ppm(methyl), 1.30ppm (methylene), 1.59ppm(methylene proton β to COO), 2.03ppm(methylene protons α to C=C), 2.25ppm(methylene proton α to COO), 2.77ppm(diallylic methylene protons), and 5.31ppm(methane protons). Changes in individual lipid proton(LP) concentration have been used as a basis to diagnose differential and pathological progression of liver fibrosis and steatosis. In addition, the total lipid(TL), total saturated fatty acids(TSFA), total unsaturated fatty acids(TUSFA), total unsaturated bonds(TUSB), and poly unsaturated bonds(PUSB) can be calculated using the concentration ratio of LP[18].
A study using this method to investigate changes in the concentration of specific fatty acids in a rat liver fibrosis model was also conducted, suggesting that different types of fatty acid are deposited in the liver parenchyma depending on the mechanism of liver disease induction. However, few studies investigated the changes in LP composition according to the differences in the pathogenesis of fatty liver.
In order to better represent each of these LP changes, a more precise MRS acquisition technique is essential. A high magnetic field MRI/S scanner provides better resolution and signal-to-noise (SNR).
In addition, resolving the problem of J coupling to
minimize the influence of adjacent LPs is also one of the important issues to be considered in the data acquisition process. Despite the advantages of these ultra-high field MRI devices, 1.5T and 3T MRI/S scanners are mainly used in humans due to MR safety such as SAR. MRS data acquisition for liver study mainly used STEAM and PRESS pulse sequences. The STEM pulse sequence facilitated more accurate LP quantification because it is less influenced by J coupling. Because of data acquisition with a low SNR value, a high average number increase the probability of test failure in the case of organs moving with the liver. In the case of PRESS, the SNR is two- to three-fold higher than STEM, which reduces the scan time. However, studies disputing the reliability of each quantified LP data have been preceded by the impact on J coupling [19, 20]. Therefore, it is feasible to apply the PRESS pulse sequence to liver MRS data.
We determined LP concentration difference degree by applying STEAM and PRESS pulse sequences via phantom experiments. Thus, LP concentration of liver was evaluated in 3T PRESS pulse sequence based on comparison of LP concentrations determined by PRESS and STEAM pulse sequences. In addition, we evaluated the changes in LP in animal models to determine the differences in the mechanism of liver disease such as toxicology, obesity and alcoholic fatty liver, starting with obese fatty liver.
In this study, we investigated the LP concentration according to the differences in induced mechanism of various fatty livers. We suggest using it as basic data for the development of treatment and diagnosis of fatty liver in the future. It is the first study of its kind to observe the changes in LP, which represent hepatic lipids before and after induction of obese fatty liver.
Ⅱ. Material and Methods
1. Phantom study to identify differences between STEAM and PRESS Pulse sequences of LP concentration
We designed a phantom containing 43 mM sodium
dodecyl sulfate (surfactant), 43 mM sodium chloride, 3.75 mM sodium azide, 0.3 mM gadobenate dimeglumine, and 20% soybean oil in deionized water. Soil bean oil has an appropriate LP profile compared with other edible oils. A 9.4 T MRI animal scanner (Biospec 94/20 USR, Bruker Biospin GmbH, Ettlingen, Germany) with a four-channel receive-only array animal coil was used for lipid phantom data acquisition. The T2-weighted image was obtained first in order to perform voxel localization of MRS acquisition, and MRS data were obtained as shown in Table 1 using PRESS and STEAM pulse sequences. The voxel located in the center of the lipid phantom was obtained, and data were acquired with water both for suppressed and unsuppressed signal to calculate water scaling LP concentration value.
2. Animal model of fatty liver
This experiment was conducted in accordance with the “Guidelines for the Management and Use of Laboratory Animals” of the National Institute of Health, which provides health guidance for animal experimental research, and followed a protocol approved by the Animal Experiment Committee of Korea Basic Science Institute (KBSI-AEC 1305). Ten male Sprague-Dawley rats weighing about 100 to 150g were housed in an aseptically isolated space at room temperature (20.5 ± 2°C) and constant relative humidity of 45 ~ 60%. In door illumination was turned on/off during a 12-hour cycle (from 9:00 AM to 9:00 PM). High-fat diet and water were arbitrarily supplied in order to adjust the rats to the environment during the entire experimental period. High-fat diet 60%
(D12492, Research Diets, New Brunswick, NJ, 60% fat, 20% protein, and 20% carbohydrate) was used to feed Sprague-Dawley rats to induce fatty liver. Baseline MRI and MRS data (control group) were obtained
prior to the introduction of the high-fat diet. Data acquisition experiments were performed after eight weeks using a procedure identical to that of the baseline, since the study results of Takahashi et al.
showed that the fatty liver developed after eight weeks [21].
3. Phantom study to identify differences between STEAM and PRESS Pulse sequences of LP concentration
The rat liver was subjected to in vivo MRI/spectroscopy using a 3.0 Tesla MRI (Achiva Tx 3.0 T; Philips Medical Systems, Netherlands) with a four-channel receive-only animal coil (CGMUC18H300AP, Shanghai Chenguang Medical Technologies Co., Ltd., China). In order to obtain the MRI/S data of the experimental animals, respiratory anesthesia was administered by nose cone, maintaining the isoflurane/air to 1.0 to 1.5% and controlling the respiratory cycle frequency to 15-30 times per minute via respiration gating. The volume of interest (VOI) to acquire the MRS data in the liver parenchyma was set to the T2-weighted fast spin echo imaging (T2WI). T2WI was performed in the whole liver parenchyma in the three directional sections of trans axial (FOV 60 mm×60 mm, slice thickness = 1.5 mm), coronal (FOV 60 mm×60 mm, slice thickness = 1.5 mm), and sagittal plan (FOV 60 mm×60 mm, slice thickness = 1.5 mm). The parameters were set as follows: a repetition time = 3000 msec, echo time = 104 msec, matrix = 256×256, section thickness
= 1 mm, and number of repetitions = 1. In order to obtain the
1H-MRS data, a point-resolved spectroscopy(PRESS) sequence was used along with TR=1,500msec, TE=35msec, and NEX=64. A8×8×8 mm
3voxel was also set. The VOI was located near the right side of the liver showing homogeneous signal intensity of liver parenchyma, avoiding large blood vessels, as shown in Fig. 1. For data acquisition, the width of the lipid peak was set Table 1. The 9.4T in-vitro phantom MRS experiment PRESS and STEAM pulse sequence parameters
TR (time to repeat)
TE (time of echo)
number of average /
water un-suppression acquisition data point acquisition bandwidth mixing time
5000msec 20msec 128 / 16 2048 2048
5000msec 20msec 128 / 16 2048 2048 10msec
to 4-6Hz using the method of iterative VOI shim, and the method of variable pulse power and optimized relaxation delays(VAPOR) was used for water signal suppression prior to data acquisition.
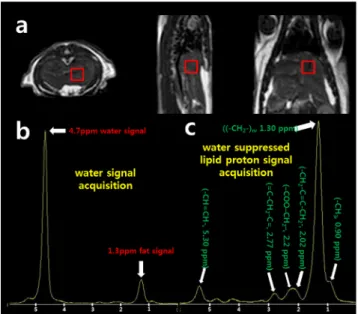
Fig. 1. Typical
1H magnetic resonance spectroscopy of fatty liver rat model with voxel(0.8×0.8×0.8cm
3) placement shown in the T2-weighed axial, sagittal, and coronal turbo spin images. As shown in (a), the signal intensity in the parenchyma was constant and concentrated on the right side of the liver avoiding major vessel, (b) six lipid protons of the parenchyma in the liver: (CH
3;0.90ppm); methylene proton((CH
2)n, 1.30 ppm); allylic protons (CH
2C=CCH
2, 2.02 ppm);
α-methylene protons to carboxyl(–COO–CH
2–,2.2ppm); diallylic protons(=CCH
2C=, 2.77 ppm); and methane protons (CH=CH; 5.30 ppm).
4. MRS and statistical analysis
After the 9.4T lipid phantom and 3T in vivo rat liver MRS experiment were completed, the MRS raw data of all lipid proton metabolites were analyzed by LCModel software (version 6.31H, Stephen W. Provencher).
The lipid proton metabolite concentration in the liver of the subject animals was calculated using LCModel, and the analysis was carried out according to the guidelines of LCModel & LCMgui User's manual. Data points of less than 10% of the CramerRao (standard deviation of SNR) value, representing the confidence level of the quantified concentration, were excluded from the analysis in this study. As shown in Fig. 1 (c),
quantitative analysis of the hepatic lipid was calculated according to the fat percentage of water scaled six lipid protons.
5. Quantification of lipid protons
The MRS data of the liver parenchyma were compared with those of methyl protons (CH
3;0.90ppm), methylene proton((CH
2)n;1.30ppm), allylic protons(CH
2C=
CCH
2;2.02ppm), α-methylene protons to carboxyl (–COO–CH
2–;2.25ppm), diallylic protons(=CCH
2C=;
2.77ppm), and methane protons(CH=CH;5.31ppm).
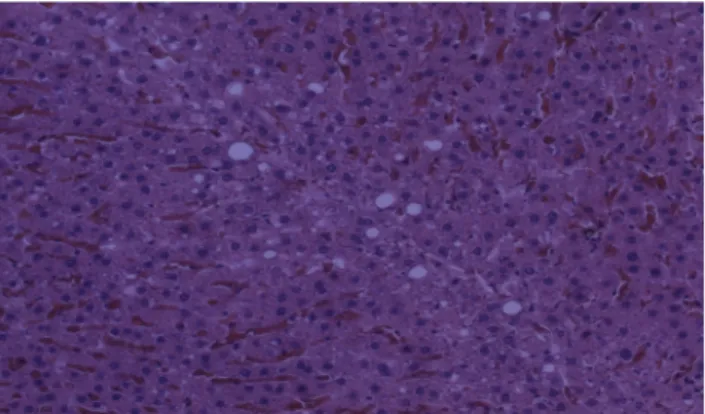
6. Histology
The histological evaluation was conducted to confirm the pathology of hepatic fat deposition after all the experiments were completed. Liver tissues derived from 8 fatty liver animal models were extracted and fixed with 4% formalin, embedded in paraffin, sectioned, and examined under light microscopy after standard hematoxylin-eosin staining.
Ⅲ. Results
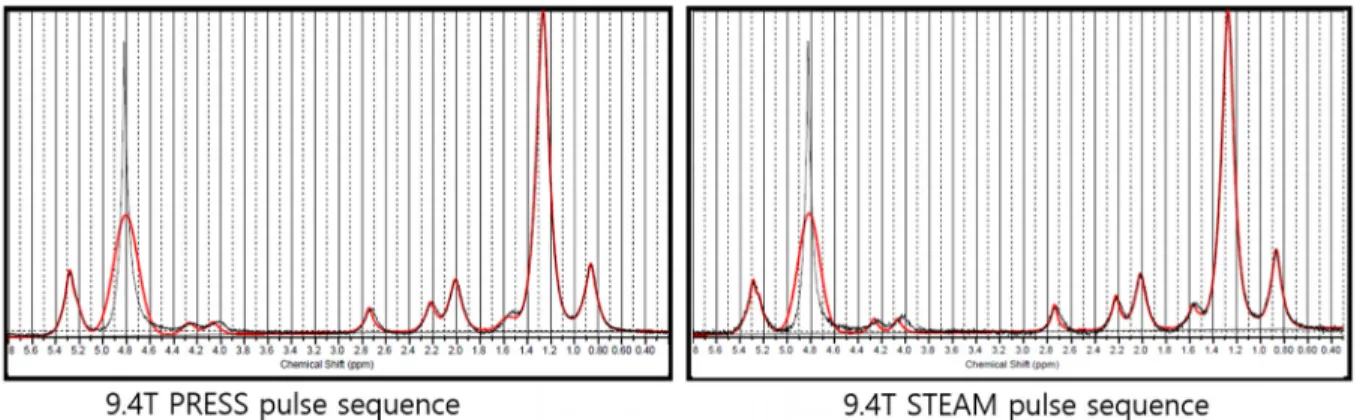
The water signal intensity was 423.66 and 823.35 on STEAM and PRESS pulse sequences, respectively, in the phantom study. Each LP concentration was quantified with water normalization. Each LP concentration value on STEAM was higher than in PRESS pulse sequence as shown in Table 2, and the total lipid percentage was 21.25% and 19.20% with STEAM and PRESS pulse sequences, respectively.
The two rats were killed during the baseline testing phase of the in vivo rat fatty liver. Eight rats completed fatty liver modeling and MRS data acquisition finally.
We confirmed adequate fat deposition in liver biopsies
after all the experiments involving rat liver tissue
(Fig. 2). In the rat baseline study before fatty liver
development, data with 10% or more of CramerRao
consisted of one of the methane protons and another
one in the allylic protons. In the MRS performed eight
weeks after administering the high-fat diet, no data
representing more than 10% of CramerRao appeared, and the fatty liver data of the eight rats prior to and after exposure to high-fat diet were analyzed for the corresponding comparison of average values.
The average concentration of methylene proton/water proton was found to be 0.038 (3.8%). The concentration of the other LP was very small with insignificant variation. Following the development of fatty liver induced by high-fat diet, the LP increased as a whole, although the ratio of the LP uptake varied (Table 3).
Raw data of fatty liver MRS induced by high-fat diet showed the highest methylene proton/water proton at 1.3 ppm (Table 4), similar to the baseline results. Since the experimental results did not satisfy normality according to the Kolmogorov-Smirnov test, the corresponding t-test was performed as a nonparametric statistical method. Fig. 3 shows the ratio of each LP to total LP prior to and after the development of fatty liver. It was difficult to evaluate the significance difference of each LP concentration Table 2. Results of in vitro experiment of each lipid proton
concentration/water ratio value based on PRESS and STEAM pulse sequences.
Water (primary
signal intensity)
0.90 ppm
1.30 ppm
1.59 ppm
2.03 ppm
2.25 ppm
2.77 ppm
5.31 ppm
PRESS 1
(823.35) 0.0217 0.1180 0.0053 0.0175 0.0099 0.0075 0.0121
STEAM 1
(423.66) 0.0241 0.1230 0.0100 0.0206 0.0110 0.0076 0.1620
Fig. 2. Rat model of fatty liver tissue induced with H&E stain
Table 3. The baseline values and results of fatty liver in MRS analysis were obtained before induction of the fatty liver, and the obtained data were scaled according to the concentration of water proton in the liver.
Case 0.90 ppm 1.30 ppm 2.02 ppm 2.3 ppm 2.77 ppm 5.30 ppm Sum of fat percentage
control group
1 0.004 0.018 0.002 0.002 0.002 0.008 3.61%
2 0.002 0.057 0.007 0.010 0.007 0.002 8.49%
3 0.007 0.032 0.004 0.003 0.005 0.000 5.20%
4 0.010 0.030 0.006 0.004 0.007 0.004 5.95%
5 0.005 0.031 0.006 0.011 0.013 0.003 6.88%
6 0.005 0.052 0.002 0.005 0.002 0.009 7.39%
7 0.006 0.048 0.004 0.003 0.003 0.005 6.94%
8 0.006 0.040 0.002 0.003 0.002 0.003 5.57%
average 0.006 0.038 0.004 0.005 0.005 0.004 6.25%
experimental group
1 0.012 0.148 0.007 0.015 0.010 0.022 21.51%
2 0.010 0.165 0.014 0.026 0.018 0.013 24.60%
3 0.021 0.208 0.018 0.024 0.020 0.020 31.18%
4 0.015 0.201 0.006 0.018 0.009 0.031 28.10%
5 0.025 0.362 0.013 0.027 0.014 0.046 48.66%
6 0.024 0.237 0.011 0.022 0.012 0.028 33.48%
7 0.037 0.387 0.013 0.031 0.017 0.041 52.64%
8 0.038 0.231 0.002 0.016 0.012 0.003 30.13%
average 0.023 0.242 0.011 0.022 0.014 0.026 33.79%
as only 8 rat models were compared with baseline data. However, the concentration of methylene proton (1.3 ppm) was higher in the obese fatty liver group.
The Spearman test correlating the fat percentage, which is the sum of the total water scaling LP concentrations, and each LP, is shown in Fig. 4.
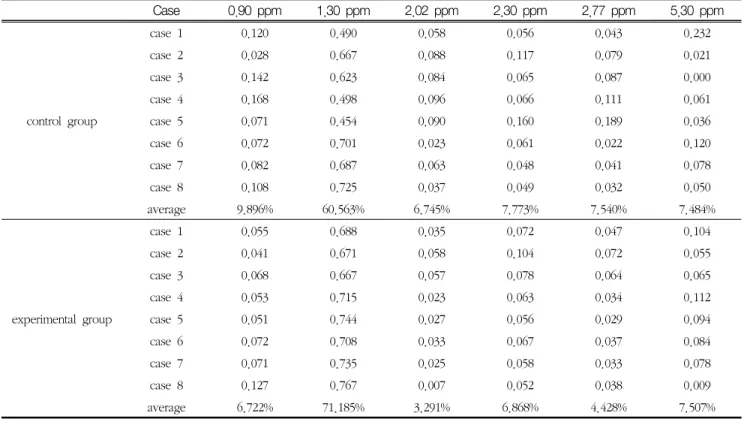
Table 4. The results of each lipid proton concentration ratio with total lipid proton
Case 0.90 ppm 1.30 ppm 2.02 ppm 2.30 ppm 2.77 ppm 5.30 ppm
control group
case 1 0.120 0.490 0.058 0.056 0.043 0.232
case 2 0.028 0.667 0.088 0.117 0.079 0.021
case 3 0.142 0.623 0.084 0.065 0.087 0.000
case 4 0.168 0.498 0.096 0.066 0.111 0.061
case 5 0.071 0.454 0.090 0.160 0.189 0.036
case 6 0.072 0.701 0.023 0.061 0.022 0.120
case 7 0.082 0.687 0.063 0.048 0.041 0.078
case 8 0.108 0.725 0.037 0.049 0.032 0.050
average 9.896% 60.563% 6.745% 7.773% 7.540% 7.484%
experimental group
case 1 0.055 0.688 0.035 0.072 0.047 0.104
case 2 0.041 0.671 0.058 0.104 0.072 0.055
case 3 0.068 0.667 0.057 0.078 0.064 0.065
case 4 0.053 0.715 0.023 0.063 0.034 0.112
case 5 0.051 0.744 0.027 0.056 0.029 0.094
case 6 0.072 0.708 0.033 0.067 0.037 0.084
case 7 0.071 0.735 0.025 0.058 0.033 0.078
case 8 0.127 0.767 0.007 0.052 0.038 0.009
average 6.722% 71.185% 3.291% 6.868% 4.428% 7.507%