ORIGINAL ARTICLE
Epac2a-null mice exhibit obesity-prone nature more susceptible to leptin resistance
M Hwang1,5, Y Go2,5,6, J-H Park1, S-K Shin1, SE Song1, B-C Oh3, S-S Im1, I Hwang1, YH Jeon2, I-K Lee2, S Seino4and D-K Song1
BACKGROUND: The exchange protein directly activated by cAMP (Epac), which is primarily involved in cAMP signaling, has been known to be essential for controlling body energy metabolism. Epac has two isoforms: Epac1 and Epac2. The function of Epac1 on obesity was unveiled using Epac1 knockout (KO) mice. However, the role of Epac2 in obesity remains unclear.
METHODS: To evaluate the role of Epac2 in obesity, we used Epac2a KO mice, which is dominantly expressed in neurons and endocrine tissues. Physiological factors related to obesity were analyzed: body weight, fat mass, food intake, plasma leptin and adiponectin levels, energy expenditure, glucose tolerance, and insulin and leptin resistance. To determine the mechanism of Epac2a, mice received exogenous leptin and then hypothalamic leptin signaling was analyzed.
RESULTS: Epac2a KO mice appeared to have normal glucose tolerance and insulin sensitivity until 12 weeks of age, but an early onset increase of plasma leptin levels and decrease of plasma adiponectin levels compared with wild-type mice. Acute leptin injection revealed impaired hypothalamic leptin signaling in KO mice. Consistently, KO mice fed a high-fat diet (HFD) were significantly obese, presenting greater food intake and lower energy expenditure. HFD-fed KO mice were also characterized by greater impairment of hypothalamic leptin signaling and by weaker leptin-induced decrease in food consumption compared with HFD-fed wild-type mice. In wild-type mice, acute exogenous leptin injection or chronic HFD feeding tended to induce hypothalamic Epac2a expression.
CONCLUSIONS: Considering that HFD is an inducer of hypothalamic leptin resistance and that Epac2a functions in pancreatic beta cells during demands of greater work load, hypothalamic Epac2a may have a role in facilitating leptin signaling, at least in response to higher metabolic demands. Thus, our data indicate that Epac2a is critical for preventing obesity and thus Epac2a activators may be used to manage obesity and obesity-mediated metabolic disorders.
International Journal of Obesity (2017)41, 279–288; doi:10.1038/ijo.2016.208; published online 13 December 2016
INTRODUCTION
The prevalence of obesity increased dramatically in recent decades worldwide and is a substantial contributor to the epidemic of type 2 diabetes.1–3Body weight reduction improves a number of metabolic and cardiovascular risk factors. Despite the importance of weight control strategies in the prevention and management of obesity-related diseases, long-term results of lifestyle or drug interventions are generally disappointing.4,5 Therefore, better understanding of the molecular mechanisms underlying the development of obesity is crucial.
Body weight homeostasis is influenced by cyclic AMP (cAMP)- mediated signaling pathways,6which are involved in modulating insulin,7leptin8,9and atrial natriuretic peptide (ANP) secretion.10In addition to cAMP-dependent protein kinase, exchange proteins directly activated by cAMP (Epac)11are also important targets of cAMP. Epac1 and Epac2 (Rapgef4) are the two isoforms.12 Although Epac1 is ubiquitously present, splice variants of Epac2 are differentially expressed (Epac2a; brain/heart/beta-cell type, 2b;
adrenal type, and 2c; liver type).13,14
Epac2a deletion caused impaired glucose-stimulated insulin secretion (GSIS) only when metabolic demand was high,15
suggesting that Epac2a is important for ameliorating beta-cell function against obesity or insulin resistance. Epac2a in cardio- myocytes is involved in ANP secretion. ANP has an important role in blood pressure control and natriuretic action.10 Moreover, evidence suggests that ANP participates in energy metabolism such as lipolysis16,17and browning of adipose tissues.18However, the ANP effect associated with obesity is observed in humans, but not rodents.
It was recently reported that Epac1 knockout (KO) mice had exhibited reduced body weight and plasma leptin levels, and displayed increased leptin sensitivity,19 demonstrating that hypothalamic Epac1 activation induces obesity by way of leptin resistance. Consistently, an adenylyl cyclase activator or Epac activator, but not a protein kinase activator, exacerbates leptin resistance in the hypothalamus.20Because the Epac activator used in this study20 may be non-selective and as both Epac1 and Epac2a are expressed in the hypothalamus, Epac2a-selective function in leptin resistance should be further demonstrated.
In the present study, using Epac2a KO mice, we demon- strated the effect of Epac2a on leptin resistance and thus obesity.
1Department of Physiology and Obesity-mediated Disease Research Center, Keimyung University School of Medicine, Daegu, Korea;2Department of Internal Medicine, Kyungpook National University School of Medicine, Daegu, Korea;3Laboratory of Molecular and Cellular Biochemistry, Lee Gil Ya Cancer and Diabetes Institute, Gachon University, Incheon, Korea and4Division of Molecular and Metabolic Medicine, Department of Physiology and Cell Biology, Kobe University Graduate School of Medicine, Kobe, Japan. Correspondence: Professor D-K Song, Department of Physiology and Obesity-mediated Disease Research Center, Keimyung University School of Medicine, 1095 Dalgubeoldae-Ro, Dalseo-Gu, Daegu 42601, Korea.
E-mail: [email protected]
5These authors contributed equally to this work.
6Current address: Korea Institute of Oriental Medicine (KIOM), Daegu, Korea.
Received 11 March 2016; revised 7 October 2016; accepted 30 October 2016; accepted article preview online 21 November 2016; advance online publication, 13 December 2016 www.nature.com/ijo
MATERIALS AND METHODS Animals and diets
Age-matched male C57BL/6 (wild-type, WT) mice were purchased from Jung-Ang Experimental Animals (Seoul, Korea). The Epac2a KO mice were generated as previously described.7Mice were initially fed a normal chow diet (10% of calories from fat, 70% from carbohydrates and 20% from proteins). From 4 weeks of age, the WT and Epac2a KO mice were fed a high-fat diet (HFD) for indicated weeks. The HFD was composed of 60% of calories from fat, 20% from carbohydrates and 20% from proteins (Research Diet Inc., New Brunswick, NJ, USA). Food intake and body weight were followed up every 4 days or everyday if necessary using an automatic BioDAQ system (Research Diet Inc.). The animals were housed under a daily 12 h light/12 h dark cycle. All animal experiments were approved by the Institutional Ethics Committee, Daegu, Korea (KM-2013-12).
Collection of blood and internal organ samples
At the end of the study, blood sample was collected from the orbital venous plexus. White (WAT) and brown adipose tissue (BAT), the liver, the pancreas and the hypothalamus were dissected out. Tissues were immediately frozen in liquid nitrogen and stored at− 80 °C. Embedded tissue blocks were cut into 6-μm sections and stained with hematoxylin and eosin.
Plasma hormone and lipid measurements
Plasma leptin and adiponectin concentrations were determined using colorimetric sandwich enzyme-linked immunosorbent assay (ELISA) kits (Raybiotech Inc., Norcross, GA, USA and R&D systems, Minneapolis, MN, USA; respectively) following the manufacturer’s instructions. Plasma total cholesterol, low-density lipoprotein, high-density lipoprotein, free fatty acid (FFA), and triglyceride were measured using an AU-480 analyzer (Beckman Coulter, Fullerton, CA, USA).
Intraperitoneal glucose tolerance test and insulin tolerance test Intraperitoneal (i.p.) glucose tolerance (IPGTT) and insulin tolerance tests (ITT) were performed as previously described.13Briefly, WT and Epac2a KO mice were fasted for 12 h (IPGTT) or 4 h (ITT). For IPGTT, mice received an i.p. injection of glucose (1 g kg− 1). To observe insulin tolerance, an i.p.
injection of human insulin (Eli Lilly, Indianapolis, IN, USA) at 0.5 mUg− 1was performed. Tail blood samples were collected at 0, 15, 30, 60, 90 and 120 min. Blood glucose levels were measured using the Glucocard Test Strip II (Arkray Inc., Edina, MN, USA). Plasma insulin levels were measured by EIA using ultrasensitive insulin (Mercodia, Winston Salem, NC, USA).
Real-time PCR analysis
Tissue was homogenized in TRI reagent (Sigma-Aldrich, St Louis, MO, USA) using an Ultra-Turax T25 (IKA, Staufen, Germany). RNA was reverse transcribed to complimentary DNA from 1μg of total RNA using a High- Capacity cDNA Reverse Transcription Kit (Applied Biosystems, Foster City, CA, USA). Quantitative real-time PCR was performed by Power SYBR Green PCR master mix using the Real-Time PCR 7500 system (Applied Biosystems). The expression level of glyceraldehyde 3-phosphate dehy- drogenase (Gapdh) was used as an internal control. The reactions were incubated at 95 °C for 10 min, followed by 45 cycles of 95 °C for 15 s, 55 °C for 20 s and 72 °C for 35 s. PCR primers are listed in supplementary Table S1.
Ex vivo lipolytic activity
Adipose tissue from epididymis was harvested in age-matched WT and Epac2a KO mice fed a chow diet. About 20 mg of isolated fat tissue was placed in 30 mMHEPES buffer (1 ml, pH 7.4), which contains 120 nMNaCl, 4 mMKH2PO4, 1 mMMgSO4, 0.75 mMCaCl2, 10 mMNaHCO3. Lipolysis was amplified by isoproterenol (10 nM) for 4 h at 37 °C. An NEFA-2HR kit (Wako Chemicals, Richmond, VA, USA) and glycerol determination kit (Sigma-Aldrich) were used to measure the concentrations of secreted FFA and glycerol, respectively. For measurement of protein content, the tissue was homogenized with lysis buffer, which contains 1% Triton X-100, 150 nMNaCl, 10 mMTris-HCl (pH 7.5), 1 mMEDTA and 1% Nonidet P-40.
Then, we used the Pierce BCA protein assay kit (Thermo Scientific, Waltham, MA, USA).
pSTAT3 immunofluorescence staining
Leptin (5 mg kg− 1; a recombinant murine type; PeproTech, Rocky Hill, NJ, USA) or 1 × phosphate-buffered saline (PBS) was i.p.-injected in male mice aged 7 weeks and fasted overnight. Intracardiac perfusion was achieved 45 min after leptin injection with PBS followed by 4% paraformaldehyde.
The mouse brain was maintained in 4% paraformaldehyde at 4 °C overnight and in a 30% sucrose solution for cryoprotection. Brains were embedded in Shandon Cryomatrix resin (Thermo Scientific) and kept at
− 80 °C. Brain was cut with 15 μm thickness and placed on glass slides. We performed pSTAT3 Y705 immunofluorescence staining according to a previous description.19 The sections were consecutively exposed to 1%
NaOH, 0.3% glycine and 0.03% sodium dodecyl sulfate (SDS) for 20, 20 and 10 min, respectively. They were then incubated for 1 h in 3% normal donkey serum-containing PBS with 0.4% Triton X-100 and 1% bovine serum albumin. Antibody for STAT3 phosphorylated at tyrosine 705 (rabbit anti-P-STAT3; 9131, Cell Signaling, Danvers, MA, USA) was added at a dilution of 1:1000 in blocking solution (PBS containing 0.4% Triton X-100, 1% bovine serum albumin and 3% goat serum) for overnight incubation at 4 °C. The slides were washed three times for 5 min each with PBS− 0.4%
Triton X-100 and then incubated with FITC-conjugated donkey anti-rabbit secondary antibody (711-095-152, Jackson ImmunoResearch, West Grove, PA, USA) at a dilution of 1:500 in blocking solution for 2 h at room temperature. The slides were then washed again with PBS containing 0.4% Triton X-100 three times for 5 min each and then mounted with anti-fade mounting medium with DAPI (4′,6-diamidino-2-phenylindole) (Invitrogen, Carlsbad, CA, USA). Images were acquired with a confocal microscope (Zeiss, Oberkochen, Germany).
Western blot analysis
Homogenates of mouse hypothalamic tissues were subjected to sodium dodecyl sulfate-polyacrylamide gel electrophoresis and immunoblotting with anti-PTP1B (protein-tyrosine phosphatase 1B; ab52650, Abcam, Cambridge, MA, USA), SOCS-3 antibody (suppressor of cytokine signaling 3; ab16030, Abcam), anti-Epac2a (4156, Cell signaling), anti-pSTAT3 (9131, Cell signaling) and anti-GAPDH antibody (2118, Sigma-Aldrich). The immunoreactive bands were visualized using horseradish peroxidase- conjugated secondary antibody (Santa Cruz Biotechnology, Santa Cruz, CA, USA) and enhanced chemiluminescence (Amersham Biosciences, Little Chalfont, UK). The experiments were repeated at least three times.
Whole-body micro-CT scan and total volume measurement of the adipose tissue
Mice images were obtained in a prone position on the CT couch.
Anesthesia was achieved with 1–2% isoflurane carried by O2via a nostril cone tube. Siemens Inveon Multi-Modality micro-CT system (Siemens Preclinical Solutions, Malvern, PA, USA) was used for CT scans of mouse whole body. Exposure conditions of the high-resolution micro-CT were peak voltage of 70 kV, tube current of 0.5 mA and full rotations. The image reconstructions were carried out to achieve a voxel size of about 107μm.
Data analysis tool was Siemens Inveon research workplace software (Erlangen, Germany). The C1 to L6 vertebrae distance for body length was measured in mm. The total volume measurement of the adipose tissue was performed in three-dimensional (3D) volume punch mode on Siemens Syngo VE36a MultiModality workplace software (Erlangen, Germany).
Coronal images reconstructed from 3D data were obtained with GE Advantage Workstation, version 4.0 (General Electric Medical Systems, Chicago, IL, USA).
Leptin sensitivity
For in vivo leptin sensitivity measurements, recombinant mouse leptin (2 mg kg− 1) or PBS was administered i.p. to HFD-fed male mice after an overnight fast. Leptin was i.p. injected every 12 h (morning and evening) for the indicated period of time (36 h). Body weight and food intake were monitored daily for 5 days. Body weight and baseline food intake measurements for the 2 days prior to the start of the experiment were averaged and used to calculate percent change.
Indirect calorimetry
Mice were placed by one and one in calorimetric chambers and spent for 10 days. The acclimation period was thefirst 5 days. Hence, data were recorded for the next 5 days. The indirect calorimetry system possessed a 16-chamber (TSE system, Chesterfield, MO, USA). From each mouse, 280
simultaneous analysis was performed to measure oxygen consumption rate (Vo2; ml kg− 1per hour), carbon dioxide production rate (Vco2; ml kg− 1 per hour), respiratory exchange ratio (RER; Vco2Vo2− 1), energy expenditure (EE; kcal kg− 1per hour) and total activity (beam breaks).
Administration of Sp-8-BnT-cAMPS (S220)
The selective Epac2 activator S220 (BIOLOG, Bremen, Germany) was tested on diet-induced obesity. Age-matched male mice were randomly allocated into three groups (five per each group): a normal chow diet, HFD and HFD plus S220. On 2-week HFD, mice i.p. received S220 (50 mg kg− 1 for 2 weeks and 20 mg kg− 1for 2 weeks) or saline everyday (at 0900 hours) for 4 weeks. The chow group received 0.2 ml of saline. At the end of the experiment, mice were fasted overnight and anesthetized with isoflurane.
Blood was collected from the inferior vena cava to determine the leptin concentration. Another experiment was performed to see the effect of S220 on hypothalamic leptin signaling; normal chow diet mice were randomly divided into four groups: vehicle, vehicle plus S220, leptin and leptin plus S220. Mice received S220 (20 mg kg− 1, i.p.) or saline at 30 min prior to leptin (5 mg kg− 1) or PBS injection. Forty-five minutes after, mice were killed for further experiments.
Statistics
The results are expressed as mean ± s.e.m. SPSS version 14.0 (SPSS Inc., Chicago, IL, USA) was used. Comparisons between the two groups were performed using a Student’s two-tailed t-test. For the comparison of more than two groups, the significance was tested using analysis of variance.
Differences were considered significant if Po0.05. Sample size was chosen according to previous observations, which perform similar experiments to see significant results, or the results from our preliminary experiments. Variance was similar between the groups that are being statistically compared.
RESULTS
Epac2a KO mice presented more adiposity and higher plasma leptin levels
To evaluate Epac2a function in obesity, we first compared the body weight and fat mass of Epac2a KO and WT mice fed with a chow diet. KO mice appeared generally healthy, with no obvious physiological abnormality. Body weights and food intake of WT and KO mice were similar until 12 weeks of age (Figures 1a and b).
Figure 1. Epac2a ablation increases plasma leptin levels, but the response to glucose and insulin remains normal. (a) Body weights from 4 to 12 weeks after birth and (b) average daily food intake of wild-type (WT) and Epac2a KO mice (n= 9). (c) Representative image of hematoxylin and eosin (H&E)-stained sections of epididymal white adipose tissue (WAT) from WT and KO mice on 12 weeks. Scale bar, 100μm. The average fat size was significantly larger in WAT-section of KO mice than in WT mice (n = 6). (d) Plasma leptin levels in fed WT and KO mice on week 7 and 12 (n= 9). (e) Plasma adiponectin in fed WT and KO mice on week 7 and 12 (n = 9). (f) Blood glucose and plasma insulin levels during an intraperitoneal glucose tolerance test in WT and KO mice on week 12 (n= 9). (g) Blood glucose levels during an intraperitoneal insulin tolerance test in WT and KO mice on week 12 (n= 9). The values represent the mean ± s.e.m. *Po0.05, ***Po0.001 vs WT.
281
However, the adipocyte size and fat storage in WAT were higher in KO mice than in WT mice (Figure 1c). Adipose tissue secretes leptin and plasma leptin concentrations are positively asso- ciated with adipose tissue mass.21–23 The average plasma leptin levels in WT mice were 5.97 ± 1.07 ngml− 1 and 9.94 ± 3.07 ngml− 1at 7 and 12 weeks, respectively. Plasma leptin levels for age-matched KO mice were higher: 16.77 ± 4.73 ngml− 1 and 23.77 ± 6.73 ngml− 1 at 7 and 12 weeks, respectively (Figure 1d). The average plasma adiponectin levels were lower in KO mice than in WT mice (Figure 1e). Nevertheless, glucose tolerance, GSIS (Figure 1f) and insulin sensitivity (Figure 1g) were not altered in KO mice. Epac2a has a central role in augmenting GSIS during periods of increased beta-cell secretory activity. However, it has a minor role in GSIS under basal conditions.24Consistent with this previous observation, KO mice exhibited no difference in insulin secretion under basal conditions (Figure 1f).
The expression of lipolysis-related genes was decreased in KO mice
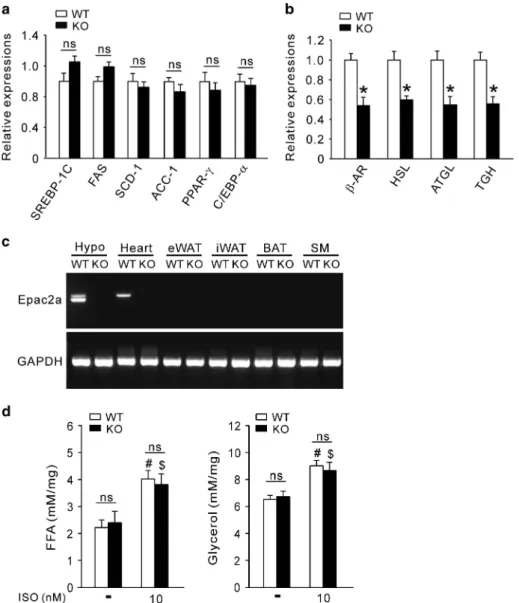
To investigate the molecular mechanism of increased adiposity in Epac2a KO mice, lipogenic, adipogenic and lipolytic gene expression was examined. The expression of several adipogenic and lipogenic genes did not differ between WT and KO mice (Figure 2a). In contrast, the expression of lipolytic genes was significantly downregulated in WAT from KO mice (Figure 2b).
These results suggest that increased adiposity is due to decreased lipolytic activity in KO mice. However, Epac2a was not expressed in WAT, but was expressed at high levels in the hypothalamus and heart (Figure 2c). Thus, lipolysis downregulation in WAT was not due to loss of Epac2a in WAT itself. To confirm this, ex vivo lipolysis activity in epididymal WAT was studied using isoproterenol, a nonspecific β-adrenergic receptor agonist. There was no differ- ence in FFA or glycerol release between the two groups under either basal or stimulated conditions (Figure 2d). These results
Figure 2. Adipocytes in Epac2a KO mice lower lipolytic gene expression but lipolytic activity remains normal in response to beta-adrenergic stimulation. Relative expression of adipo-lipogenic genes (a) and lipolytic genes (b) in epididymal WAT from WT and KO mice on 12 weeks using real-time PCR (n= 9). (c) Distribution of Epac2a mRNA. RT-PCR analysis shows that Epac2a mRNA was expressed in the hypothalamus (Hypo) and heart, but not in skeletal muscle (SM), BAT, and WAT in WT mice. (d) Ex vivo lipolytic activity was measured on epididymal fat explants from WT or KO mice on chow diet (n= 6). FFA and glycerol release in response to isoproterenol (ISO) were measured in the incubation buffer. The values represent the mean± s.e.m. *Po0.05 vs WT mice,#Po0.05 vs non-treated WT,$Po0.05, vs non-treated KO. BAT, brown adipose tissue; eWAT, epididymal WAT; iWAT, inguinal WAT; mRNA, messenger RNA.
282
suggest that adipocytes from KO mice present a normal lipolytic sensitivity. Thus, decreased expression levels of lipolytic genes in WAT suggest decreased extracellular lipolytic stimuli.
Epac2a ablation suppresses leptin signaling
Epac activity is involved in leptin signaling in the hypothalamus19,20 and Epac2a is important in beta cells for higher insulin secretion in response to sulfonylureas, incretins and diet-induced obesity.15To determine whether the consequence of
Epac2a loss is associated with leptin resistance, we compared STAT3 phosphorylation (pSTAT3) in the hypothalamus of WT and KO mice. Immunofluorescence staining indicated that pSTAT3 (Y705) was shown in the nucleus of the arcuate nucleus and ventromedial hypothalamus (Figure 3a), well matched with previously observed data.20 WT mice displayed more prominent nuclear immunostaining of pSTAT3 of arcuate nucleus and ventromedial hypothalamus in response to leptin than KO mice (Figure 3b and Supplementary Figure S1). This was also true for the pSTAT3 protein levels (Figures 3c and d). In addition, Epac2a
Figure 3. Effect of Epac2a ablation on leptin signaling in the hypothalamus. (a) Image of pSTAT3 (Y705) immunofluorescence in the arcuate nucleus (Arc) and the ventromedial hypothalamic nucleus (VMH). Seven-week-old WT or Epac2a KO mice was injected with PBS or leptin (i.p., 5 mg kg− 1) 45 min before sample collection. × 100, Scale bar, 100μm. (b) High magnification image and quantification of pSTAT3 (Y705) immunofluorescence in Arc (n = 5). × 200, Scale bar, 50 μm. (c) Representative western blot of pSTAT3 (Y705) and Epac2a in the hypothalamus of 7- week-old WT or KO mice after the injection of vehicle (PBS) or leptin (5 mg kg− 1). (d) Quantification of pSTAT3 in western blot was normalized to GAPDH (n= 3). The values represent means ± s.e.m. **Po0.01 vs WT mice with leptin. 3V, third ventricle; Lep, leptin; ME, median eminence.
283
level was also increased by leptin treatment in WT mice (Figure 3c), implying its association with leptin signaling.
Epac2a KO mice are susceptible to developing obesity
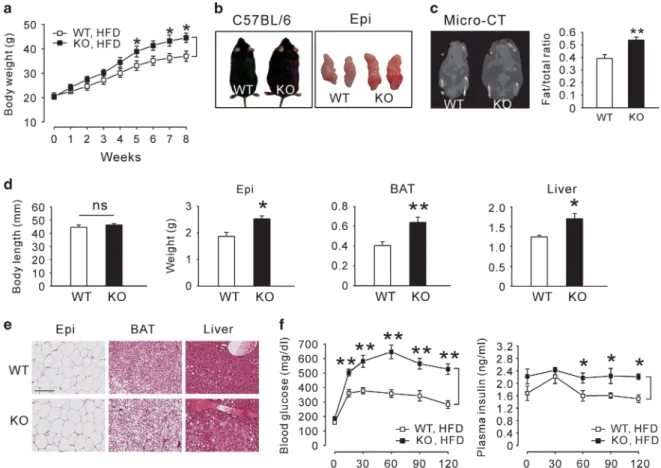
To amplify the impact of Epac2a ablation associated with obesity and leptin resistance, mice were fed a HFD for 8 weeks. KO mice significantly gained more weight than WT mice (Figure 4a). At the end of the HFD feeding, the greater body fat mass was also observed in KO mice (Figures 4b and c), without an alteration in body length (Figure 4d). Histological examination of the epididymal WAT, BAT and liver revealed that KO mice accumu- lated more lipids than WT mice (Figures 4d and e). Fasting plasma cholesterol and triglyceride levels tended to increase, but plasma FFA levels were lower in KO mice (Supplementary Table S2). In addition, KO mice had worse glucose intolerance (Figure 4f) and insulin resistance (Supplementary Figure S2a). Fasting blood glucose and plasma insulin levels were elevated in HFD-fed KO mice (Supplementary Figure S2b). The pancreas morphometric analyses of WT mice on a HFD revealed an increase in pancreas weight (data not shown) and islet size (Supplementary Figure S2c) compared with their littermates on normal diet. KO mice on a HFD exhibited larger pancreas weight and islet size than WT mice on a HFD, but the differences were not significant.
Leptin resistance in HFD-fed Epac2a KO mice
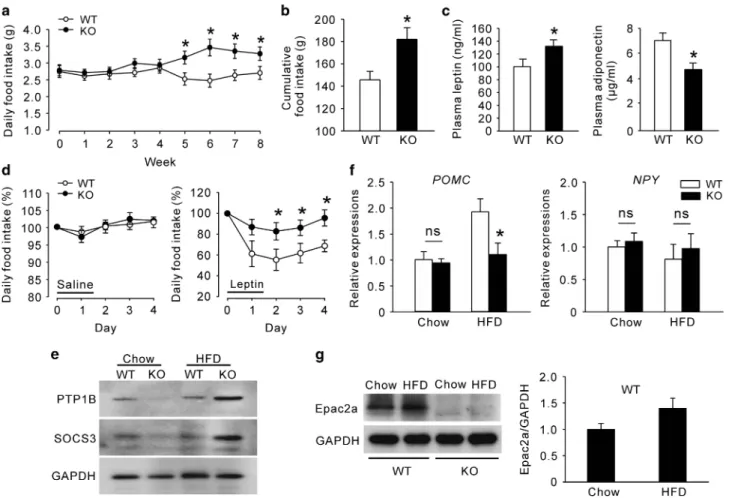
We examined the average daily and cumulative food intake during 8 weeks of HFD feeding. Food intake was higher in KO mice after 5 weeks of HFD feeding (Figure 5a). From that point onward, the daily food intake of WT mice somewhat decreased, whereas that of KO mice increased. Thus, cumulative food intake was substantially higher in KO mice than that of WT mice (Figure 5b). Consistent with the results in normal chow diet, Epac2a KO mice had higher plasma leptin and reduced adiponectin levels than WT mice (Figure 5c). We then performed an in vivo leptin resistance test. We determined that KO mice were resistant to the effects of leptin (2 mg kg− 1 per injection, i.p.), whereas WT mice were not (Figure 5d). Consistent with this in vivo study, the basal levels of SOCS-3 and PTP1B, important markers of leptin resistance,25–27 were higher in the hypothalamus of KO mice (Figure 5e). Leptin has an important role in the maintenance of energy balance by reducing food intake,28 mainly by proopiomelanocortin (POMC) secretion from the hypothalamic arcuate nucleus. KO mice fed a HFD presented decreased Pomc mRNA expression levels (Figure 5f), although there was no significant change in the hypothalamic neuropeptide Y (Npy) mRNA expression. To reiterate the fact that HFD-fed KO mice are vulnerable to leptin resistance, we tested whether HFD is related with hypothalamic Epac2a expression (Figure 5g). Remarkably, 8-week-HFD feeding tended
Figure 4. Effects of Epac2a ablation on high-fat diet-induced obesity. (a) Body weights of WT and Epac2a KO mice fed a high-fat diet (HFD) for 8 weeks (n= 9). (b) Representative photographs of WT and KO mice and their epididymal fat pad (Epi) after 8 weeks of HFD feeding.
(c) Coronal projection images of 3D reconstructions of micro-CT scans of WT and KO mice after 8 weeks of HFD feeding. The fat/total body ratio was determined by whole-body CT imaging (n= 6). (d) Body length and various tissue weights in absolute amounts from WT and KO mice after 8 weeks of HFD feeding (n= 9). (e) Representative images of H&E-stained sections of Epi (×100), BAT (×200) and liver (×200) from WT and KO mice after 8 weeks of HFD feeding. Tissue blocks were cut into 6-μm sections and stained with H&E. Scale bar, 100 μm.
(f) Intraperitoneal glucose tolerance test (blood glucose and plasma insulin levels) in WT and KO mice after 8 weeks of HFD feeding (n= 9).
The values represent the mean± s.e.m. *Po0.05, **Po0.01 vs WT mice.
284
to increase Epac2a expression in the hypothalamus of WT mice compared with normal chow diet, although data were not statistically significant, possibly due to the limited sample size and/or duration of HFD feeding. In addition, energy expenditure, another marker of leptin resistance, in KO mice fed a HFD was lower than that of WT mice (Supplementary Figures S3 and S4), although resting locomotor activity did not differ between WT and Epac2a KO mice.
Effect of S220 on HFD-induced increase in body weight and plasma leptin levels
To elucidate whether Epac2 activation ameliorates HFD-induced obesity, we employed the selective Epac2 activator S220.29When S220 was acutely treated in WT mice fed a chow diet, hypothalamic pSTAT3 expression showed an increasing trend, when compared with PBS-treated control (Figure 6a). By only a 4-week administration with S220 on a HFD, body weight gain was dramatically alleviated (Figure 6c), whereas food intake did not differ from the PBS-treated HFD group (Figure 6b). Furthermore, plasma leptin levels on a HFD were significantly ameliorated by the treatment with S220 for 4 weeks, when compared with HFD group treated with PBS (Figure 6d).
DISCUSSION
Over the last few years, several studies involving Epac1, Epac2a or Epac1/2 double KO mice have been published.13,15,19,30–32
Experiments using Epac1 KO mice revealed diverse functions of Epac1 associated with cancer metastasis,31beta-cell dysfunction32 and leptin resistance.19In addition, studies indicated that Epac1 is involved in the inhibition of IL6 response,33attenuation of chronic kidney disease,34 age-related skeletal muscle derangement,35 promotion of adipocyte differentiation36 and ghrelin signaling.37 Diverse actions of Epac1 may be due to its wide tissue distribution.
In contrast, only few studies report functions of Epac2a, which is expressed in few tissues, including the brain and neuroendocrine and endocrine tissues. In this study, Epac2a function was investigated in relation to obesity. Epac2a KO mice on normal chow diet exhibit elevated leptin and lowered adiponectin plasma levels, but normal glucose and lipid metabolism at least until 12 weeks of age. However, acute high dose of leptin injection or chronic metabolic stimulation such as a HFD reveals abnormal leptin signaling within the hypothalamus. In addition, we confirmed Epac2a expression in the hypothalamus and heart, but not in WAT, BAT and skeletal muscle. These results indicate that the premature elevation of plasma leptin levels in KO mice does not stem from adipocytes.
Figure 5. Epac2a knockout results in a severer high-fat diet-induced leptin resistance. (a) Daily and (b) cumulative food intake of WT and Epac2a KO mice during the 8 weeks of high-fat diet (HFD) feeding (n= 9). (c) Plasma leptin and adiponectin levels in fed WT and KO mice after 8 weeks of HFD feeding (n= 9). (d) Daily food intake after saline and leptin administration (i.p. 2 mg kg− 1) during the indicated period in WT and KO mice after 8 weeks of HFD feeding (n= 6). (e) Representative western blot of PTP1B and SOCS-3 proteins in the hypothalamus of WT and KO mice after 8 weeks of normal chow diet or HFD feeding (n= 6). (f) Hypothalamic expression of Pomc and Npy genes in WT and KO mice fed a normal chow diet and HFD for 8 weeks (n= 9). (g) Representative western blot of Epac2a protein in the hypothalamus of WT and KO mice after 8 weeks of HFD feeding and quantification of Epac2a western blot normalized to GAPDH (n = 3). The values represent the mean ± s.e.m. *Po0.05 vs WT mice in HFD.
285
In cardiomyocytes, Epac2a induces ANP secretion through GLP-1 receptor activation.10In humans, increased ANP levels due to genetic polymorphisms are associated with a lower prevalence of obesity and metabolic disorder.38,39This association is mainly due to the stimulatory role of ANP in lipolysis, which is demonstrated in primate, but not in rodents.39–41Therefore, even if there is a defect in ANP secretion in Epac2a KO mice, it cannot be a primary cause of abnormally increased plasma leptin levels. In beta cells, Epac2a enhances insulin secretion by incretins, pharmacological drugs and a high-calorie diet.13,15,42 Impaired function of beta cells, which also express Epac2a, may be a candidate, because beta-cell Epac2a has an important role in insulin secretion. However, it is only involved during high insulin demand15 and Epac2a KO mice did not exhibit significant decrease in GSIS when plasma leptin levels were already elevated.
Nevertheless, it could accelerate the leptin resistance develop- ment in HFD-fed Epac2a KO mice, which showed significant glucose intolerance and insulin resistance. This may be because appropriate insulin signaling in the hypothalamus is critical for leptin sensitivity through enhancement of phosphoinositide 3-kinase activity, thus increasing Pomc and decreasing Npy expression.43,44
Amelioration of leptin sensitivity by Epac1 ablation is well demonstrated and KO mice presented reduced WAT, reduced plasma leptin levels and resistance to diet-induced obesity, which contrasts the present results. They also demonstrated that, with a normal chow diet, body weight and adiposity were reduced in Epac1 KO mice, in contrast to Epac2a KO mice, which exhibited a
significant gain in body weight and adiposity, and reduced energy expenditure only when fed a HFD. The results from Fukuda et al.20 also indicates that cAMP signaling within the hypothalamus preferentially exploits Epac1, demonstrating that elevation of cAMP levels or an Epac activator impairs multiple signaling cascades activated by leptin, which is independent of the protein kinase pathway. Therefore, in the hypothalamus, Epac1 and Epac2a may have opposite roles with non-equal potencies (Epac144Epac2a) in response to certain identical signaling associated with leptin function such as cAMP. Alternatively, upstream regulators for the differential regulation of Epac1 and Epac2a may exist in the hypothalamus besides cAMP signaling.
For example, sulfonylureas, which primarily target ATP-sensitive potassium channels, can activate Epac2a directly by allosteric binding, but not through cAMP signaling, in beta cells to augment insulin secretion.45 In addition, various plasmalemmal receptors, including growth factor and cytokine receptors, activate Epac2 differentially from Epac1 independently of cAMP.46 Therefore, novel modulators of hypothalamic Epac2a may be identified in the future to develop drugs against leptin resistance.
Consistent with our hypothesis that Epac1 preferentially participates in leptin signaling within the hypothalamus rather than Epac2a, at least in the basal conditions, Epac1 ablation in beta cells showed severer impairment in GSIS with deranged islet architecture,32 in contrast to Epac2a-ablated beta cells showing defects in GSIS only when insulin secretory demand is high.15 Therefore, the hypothalamus may share Epac2a function with beta Figure 6. Effect of S220 on high-fat diet-induced obesity. (a) Representative western blot data and the quantification of hypothalamic pSTAT3 (Y705) protein expression in normal chow diet, 7-week-old WT mice. Mice i.p. received S220 (20 mg kg− 1) or saline 30 min prior to leptin (5 mg kg− 1) or PBS injection. Sampling was achieved after 45 min. The experiments were repeated at least three times. Daily food intake (b) and changes in body weight (c) in WT mice during 6 weeks of high-fat diet (HFD) feeding. Five mice were allocated randomly for each group. Daily S220 or PBS injection started from 2 weeks after HFD feeding. (d) Fasting plasma leptin levels measured after 4-week treatment with S220 or PBS on a HFD (n= 5). The values represent means ± s.e.m. *Po0.05 vs Chow diet WT,#Po0.05 vs HFD WT with PBS.
286
cells, mainly playing a role in urgent conditions like high calorie intake or hyperleptinemia.
In conclusion, we demonstrate hypothalamic Epac2a that is utilized to augment leptin signaling and differentially regulated from Epac1. Besides hypothalamic selective Epac1 inhibition, we suggest that Epac2a activation is also helpful to manage leptin resistance in obesity and related metabolic disorders. In addition to its hypothalamic effect, Epac2a will also positively act on beta cells and cardiomyocytes to normalize body energy metabolism in humans.
CONFLICT OF INTEREST
The authors declare no conflict of interest.
ACKNOWLEDGEMENTS
This research was supported by the National Research Foundation of Korea (NRF) Grant funded by the Korean Government (MSIP; No. 2014R1A5A2010008) and (No.
NRF-2013R1A2A2A01068220). IKL was supported by the Ministry of Health & Welfare, Republic of Korea (Grant Number: HI11C1300). SS was supported by Grants-in-Aid for Scientific Research from the Ministry of Education, Culture, Sport, Science and Technology, Japan.
REFERENCES
1 Gaede P, Lund-Andersen H, Parving HH, Pedersen O. Effect of a multifactorial intervention on mortality in type 2 diabetes. N Engl J Med 2008;358: 580–591.
2 Stamler J, Vaccaro O, Neaton JD, Wentworth D. Diabetes, other risk factors, and 2- yr cardiovascular mortality for men screened in the Multiple Risk Factor Intervention Trial. Diabetes Care 1993;16: 434–444.
3 Van Gaal LF, Mertens IL, De Block CE. Mechanisms linking obesity with cardio- vascular disease. Nature 2006;444: 875–880.
4 Bray GA, Ryan DH. Medical therapy for the patient with obesity. Circulation 2012;
125: 1695–1703.
5 Scheen AJ, Van Gaal LF. Combating the dual burden: therapeutic targeting of common pathways in obesity and type 2 diabetes. Lancet Diabetes Endocrinol 2014;2: 911–922.
6 McKnight GS, Cummings DE, Amieux PS, Sikorski MA, Brandon EP, Planas JV et al.
Cyclic AMP, PKA, and the physiological regulation of adiposity. Recent Prog Horm Res 1998;53: 139–159.
7 Shibasaki T, Takahashi H, Miki T, Sunaga Y, Matsumura K, Yamanaka M et al.
Essential role of Epac2/Rap1 signaling in regulation of insulin granule dynamics by cAMP. Proc Natl Acad Sci USA 2007;104: 19333–19338.
8 Fried SK, Ricci MR, Russell CD, Laferrère B. Regulation of leptin production in humans. J Nutr 2000;130: 3127S–3131S.
9 Li H, Matheny M, Scarpace PJ. Beta 3-adrenergic-mediated suppression of leptin gene expression in rats. Am J Physiol 1997;272: E1031–E1036.
10 Kim M, Platt MJ, Shibasaki T, Quaggin SE, Backx PH, Seino S et al. GLP-1 receptor activation and Epac2 link atrial natriuretic peptide secretion to control of blood pressure. Nat Med 2013;19: 567–575.
11 Seino S, Shibasaki T. PKA-dependent and PKA-independent pathways for cAMP- regulated exocytosis. Physiol Rev 2005;85: 1303–1342.
12 Bos JL. Epac: a new cAMP target and new avenues in cAMP research. Nat Rev Mol Cell Biol 2003;4: 733–738.
13 Takahashi H, Shibasaki T, Park JH, Hidaka S, Takahashi T, Ono A et al. Role of Epac2A/Rap1 signaling in interplay between incretin and sulfonylurea in insulin secretion. Diabetes 2015;64: 1262–1272.
14 Schmidt M, Dekker FJ, Maarsingh H. Exchange protein directly activated by cAMP (epac): a multidomain cAMP mediator in the regulation of diverse biological functions. Pharmacol Rev 2013;65: 670–709.
15 Song WJ, Mondal P, Li Y, Lee SE, Hussain MA. Pancreatic beta-cell response to increased metabolic demand and to pharmacologic secretagogues requi- res EPAC2A. Diabetes 2013;62: 2796–2807.
16 Birkenfeld AL, Budziarek P, Boschmann M, Moro C, Adams F, Franke G et al. Atrial natriuretic peptide induces postprandial lipid oxidation in humans. Diabetes 2008;
57: 3199–3204.
17 Moro C, Crampes F, Sengenes C, De Glisezinski I, Galitzky J, Thalamas C et al. Atrial natriuretic peptide contributes to physiological control of lipid mobilization in humans. FASEB J 2004;18: 908–910.
18 Bordicchia M, Liu D, Amri EZ, Ailhaud G, Dessì-Fulgheri P, Zhang C et al. Cardiac natriuretic peptides act via p38 MAPK to induce the brown fat thermogenic program in mouse and human adipocytes. J Clin Invest 2012;22: 1022–1036.
19 Yan J, Mei FC, Cheng H, Lao DH, Hu Y, Wei J et al. Enhanced leptin sensitivity, reduced adiposity, and improved glucose homeostasis in mice lacking exchange protein directly activated by cyclic AMP isoform 1. Mol Cell Biol 2013;
33: 918–926.
20 Fukuda M, Williams KW, Gautron L, Elmquist JK. Induction of leptin resistance by activation of cAMP-Epac signaling. Cell Metab 2011;13: 331–339.
21 Considine RV, Sinha MK, Heiman ML, Kriauciunas A, Stephens TW, Nyce MR et al. Serum immunoreactive-leptin concentrations in normal-weight and obese humans. N Engl J Med 1996;334: 292–295.
22 Friedman JM, Halaas JL. Leptin and the regulation of body weight in mammals.
Nature 1998;395: 763–770.
23 Maffei M, Halaas J, Ravussin E, Pratley RE, Lee GH, Zhang Y et al. Leptin levels in human and rodent: measurement of plasma leptin and ob RNA in obese and weight reduced subjects. Nat Med 1995;1: 1155–1161.
24 Zhang CL, Halaas J, Ravussin E, Pratley RE, Lee GH, Zhang Y et al. The cAMP sensor Epac2 is a direct target of antidiabetic sulfonylurea drugs. Science 2009;325:
607–610.
25 Bjørbaek C, El-Haschimi K, Frantz JD, Flier JS. The role of SOCS-3 in leptin signaling and leptin resistance. J Biol Chem 1999;274: 30059–30065.
26 Howard JK, Cave BJ, Oksanen LJ, Tzameli I, Bjørbaek C, Flier JS. Enhanced leptin sensitivity and attenuation of diet-induced obesity in mice with haploinsufficiency of Socs3. Nat Med 2004;10: 734–738.
27 Mori H, Cave BJ, Oksanen LJ, Tzameli I, Bjørbaek C, Flier JS. Socs3 deficiency in the brain elevates leptin sensitivity and confers resistance to diet-induced obesity.
Nat Med 2004;10: 739–743.
28 Schwartz MW, Woods SC, Porte D, Seeley RJ, Baskin DG. Central nervous system control of food intake. Nature 2000;404: 661–671.
29 Schwede F, Bertinetti D, Langerijs CN, Hadders MA, Wienk H, Ellenbroek JH et al.
Structure-guided design of selective Epac1 and Epac2 agonists. PLoS Biol 2015;
13: e1002038.
30 Yang Y, Shu X, Liu D, Shang Y, Wu Y, Pei L et al. Epac null mutation impairs learning and social interaction via aberrant regulation of miR-124 and Zif268 translation. Neuron 2010;73: 774–788.
31 Almahariq M, Chao C, Mei FC, Hellmich MR, Patrikeev I, Motamedi M et al.
Pharmacological inhibition and genetic knockdown of exchange protein directly activated by cAMP 1 reduce pancreatic cancer metastasis in vivo. Mol Pharmacol 2015;87: 142–149.
32 Kai AK, Lam AK, Chen Y, Tai AC, Zhang X, Lai AK et al. Exchange protein activated by cAMP 1 (Epac1)-deficient mice develop β-cell dysfunction and metabolic syndrome. FASEB J 2013;27: 4122–4135.
33 Yarwood SJ, Borland G, Sands WA, Palmer TM. Identification of CCAAT/enhancer- binding proteins as exchange protein activated by cAMP-activated transcription factors that mediate the induction of the SOCS-3 gene. J Biol Chem 2008;283:
6843–6853.
34 Fang F, Liu GC, Kim C, Yassa R, Zhou J, Scholey JW. Adiponectin attenuates angiotensin II-induced oxidative stress in renal tubular cells through AMPK and cAMP-Epac signal transduction pathways. Am J Physiol Renal Physiol 2013;304:
F1366–F1374.
35 Park SJ, Ahmad F, Philp A, Baar K, Williams T, Luo H et al. Resveratrol ameliorates aging-related metabolic phenotypes by inhibiting cAMP phosphodiesterases. Cell 2012;148: 421–433.
36 Jia B, Madsen L, Petersen RK, Techer N, Kopperud R, Ma T et al. Activation of protein kinase A and exchange protein directly activated by cAMP promotes adipocyte differentiation of human mesenchymal stem cells. PLoS One 2012;
7: e34114.
37 Heldsinger A, Grabauskas G, Wu X, Zhou S, Lu Y, Song I et al. Ghrelin induces leptin resistance by activation of suppressor of cytokine signaling 3 expression in male rats: implications in satiety regulation. Endocrinology 2014; 155:
3956–3969.
38 Schlueter N, de Sterke A, Willmes DM, Spranger J, Jordan J, Birkenfeld AL.
Metabolic actions of natriuretic peptides and therapeutic potential in the meta- bolic syndrome. Pharmacol Ther 2014;144: 12–27.
39 Birkenfeld AL, Boschmann M, Engeli S, Moro C, Arafat AM, Luft FC et al. Atrial natriuretic peptide and adiponectin interactions in man. PLoS One 2012; 7:
e43238.
40 Sengenes C, Zakaroff-Girard A, Moulin A, Berlan M, Bouloumié A, Lafontan M et al.
Natriuretic peptide-dependent lipolysis in fat cells is a primate specificity. Am J Physiol Regul Integr Comp Physiol 2002;283: R257–R265.
41 Matsukawa N, Grzesik WJ, Takahashi N, Pandey KN, Pang S, Yamauchi M et al.
The natriuretic peptide clearance receptor locally modulates the physiological effects of the natriuretic peptide system. Proc Natl Acad Sci USA 1999;96:
7403–7408.
42 Almahariq M, Mei FC, Cheng X. Cyclic AMP sensor EPAC proteins and energy homeostasis. Trends Endocrinol Metab 2014;25: 60–71.
287
43 Porte Jr D, Baskin DG, Schwartz MW. Insulin signaling in the central nervous system: a critical role in metabolic homeostasis and disease from C. elegans to humans. Diabetes 2005;54: 1264–1276.
44 Kwon O, Kim KW, Kim MS. Leptin signaling pathways in hypothalamic neurons.
Cell Mol Life Sci 2016;73: 1457–1477.
45 Zhang CL, Katoh M, Shibasaki T, Minami K, Sunaga Y, Takahashi H et al. The cAMP sensor Epac2 is a direct target of antidiabetic sulfonylurea drugs. Science 2009;
325: 607–610.
46 Zheng Y, Quilliam LA. Activation of the Ras superfamily of small GTPases. Work- shop on exchange factors. EMBO Rep 2003;4: 463–468.
This work is licensed under a Creative Commons Attribution- NonCommercial-ShareAlike 4.0 International License. The images or other third party material in this article are included in the article’s Creative Commons license, unless indicated otherwise in the credit line; if the material is not included under the Creative Commons license, users will need to obtain permission from the license holder to reproduce the material. To view a copy of this license, visit http://
creativecommons.org/licenses/by-nc-sa/4.0/
© The Author(s) 2017
Supplementary Information accompanies this paper on International Journal of Obesity website (http://www.nature.com/ijo) 288