Introduction
Increases in carbon dioxide (CO
2) concentration in the atmosphere has been of serious concern for global warming and subsequent changes of agricultural circumstances for a last century (Lal, 2004; Zach et al., 2006). Such increase in atmosphere carbon dioxide concentration has been caused not only by combustion of fossil fuel but also by agricultural practices such as, deforestration and soil disturbance (Lal et al., 2004).
Since organic carbon (SOC) is a principal constituent of soil organic matter (Cambardella and Doran, 1996), soil organic carbon enhancement due to atmospheric carbon sequestration would improve agronomic productivity and resource use efficiency of soils (VandenBygaart and Kay, 2004). Therefore, judicious management of soil organic carbon is crucial for enhancing soil quality, improving soil productivity, maintaining clean water, and mitigating global warming effect through reducing increases in atmospheric CO
2(Allen et al., 2006; Lal et al., 2004). Soil organic carbon loss from the agricultural lands primarily comes from plowing that turns over the soil, making it vulnerable to accelerated soil erosion (Lal et al., 1997).
However, it is well-known that leaving crop residues after
harvest increases the amount of soil organic carbon content and controls soil erosion, but the benefits are likely to lost if the biomass is plowed because microorganism quickly decompose residue carbon to CO
2(Weil and Magdoff, 2004). Intense plowing in the water saturated soil (puddling) for rice crop, removing crop residues and burning could minimize sequestration of carbon into soils..
As carbon sequestration implies transferring atmospheric CO
2into long-lived pools and storing it securely so it is not immediately reemitted (Esuola and Weersinic, 2006), soil organic carbon sequestration means increasing SOC stocks through judicious land use and recommended management practices. Therefore, SOC sequestration in agricultural and restored ecosystems depend on soil texture (Lal, 1997), topographical characteristics (Guo et al., 2006), and climate (Frenzluebbers and Steiner, 2002), and vary from 0 to 150 kg C ha
-1yr
-1in dry and warm regions, and 100 to 1,000 kg C ha
-1yr
-1in humid and cool climates (Lal, 2004), suggesting that soil misuse should lead to emission of green house gases from soil to the atmosphere.
The Kyoto protocol on climate change has prompted the agricultural sector to promote more seriously various forms of conservation tillage as practices to help sequester CO
2from the atmosphere into soil organic
Received : 18 January 2007 Accepted : 5 February 2007*Corresponding author: Phone : +82312900276, E-mail : [email protected]
Soil Organic Carbon Dynamics in Korean Paddy Soils
Won-Kyo Jung,
*and Sun-Kwan Kim
Soil Management Div., National Institute of Agricultural Science and Technology, RDA, Suwon, 441-707, Korea
Korean paddy soils have long been almost uniformly managed throughout the whole country with flooded, deep tillage, puddlling, transplanting, and uncovering after harvest. Management of soil organic carbon could be more important in the sources of green house gases. However, soil organic carbon dynamics were not been studied for Korean paddy soils. Therefore, we evaluated the changes in soil organic carbon (SOC) of paddy soils between 1999 and 2003 at the same locations nationwide except islands. Soil organic carbon tends to increase in Inceptisols, which is predominant soil order for Korean paddy soils, from 1999 to 2003.
Soil organic carbon increases in topographically plain paddy soils was greater than in valley soils, and was considerably high in predominant types of paddy soils (i.e., well adapted paddy soils, sandy paddy soils, and poorly drained paddy soils) but low and stable in the saline paddy soils. We also found that clay paddy soils are greater in soil organic carbon than sandy paddy soils. Through this study, we concluded that a proper management of paddy soils could contribute to soil organic carbon storage, which imply that the Korean paddy soils could help to enhance carbon dioxide sequestration via soil organic matter into the soil.
Key words : Soil organic carbon, Carbon sequestration, Paddy soils
matter (Olness et al., 2002; Sherrod et al., 2005). In response, most studies related to the changes in SOC has focused on the long term effects of different cropping systems, fertilization, tillage practices, soil characteristics, climatic conditions and depth of sampling (Hooker et al., 2005; Jung and Kim, 2006; Sainju et al., 2006).
Environmental control factors (e.g., climatic variables of temperature and precipitation) could limit the potential SOC sequestration (Wall et al., 2006) and were the best predictors of net change in SOC (Parkin and Kaspar, 2003). Five major abiotic factors affecting mineralization of soil organic matter are clay content, soil pH, soil bulk density, rainfall, and temperature (Frenzlubbers and Steiner, 2002). Of them, temperature is perhaps the most important factor. While temperatures higher than about 30 ℃ and lower than about 9℃ have little effect on biological activity, in the range of 9 to 30℃, even a slight change in soil temperature has an important effect on biological respiration (Lal, 2004).
Accordingly, elevated atmospheric temperature would influence soil carbon sequestration and the turn over of soil organic matter (SOM) under different agricultural managemenr practices, since SOM increases not only soil fertility, productivity and quality but also green house gases emission (Machado et al., 2006). However a few studies of soil organic carbon sequestration on Korean paddy soils have reported. In response, this study evaluated the changes in soil organic carbon in the Korean paddy soils.
Materials and Methods
Measurements and analysis Sampling sites (i.e., 1,545 sites) were selected based on probability proportion of paddy areas of county and province. Soil samples were obtained prior to tillage at the top 15 cm from the soil surface from March to May in 1999 and 2003. Three to five samples were randomly obtained in a field and mixed for soil testing. Samples were air dried, crushed and sieved through 2-mm diameter screen. Reference samples, data values are known by previous analyses, were used to verify the data analysis every 20 to 30 samples analysis.
Soil organic carbon was determined by wet combustion method. Ground soil samples (i.e., 0.2 to 0.3 gram) were used to digest with K
2Cr
2O
7by heating at 200℃ for 2 hours and were titrated using diphenylamine indicator. In
characteristics, types of paddy soils, surface soil texture, and taxonomical properties are characterized from soil survey data (NIAST, 2000).
Results and Discussion
Soil organic carbon showed normal distribution for both 1999 and 2003. Average SOC in 1999 was 12.4 g kg
-1(SD=4.5) and that in 2003 was 12.8 g kg
-1(SD=4.1). T- value (i.e., -6.13, p<0.0001) showed that average SOC in 2003 was significantly different from the average SOC in 1999. SOC in paddy soils was increased by 0.11 g kg
-1yr
-1during the period of 1999 and 2003. Proportion of low SOC (i.e., less than 11 g kg
-1) was decreased in 2003 compared to 1999. But proportion of high SOC (i.e., SOC ranged from 11 g kg
-1to 25 g kg
-1) was increased in 2003 compared to 1999 (Fig. 1).
SOC changes between 1999 and 2003 by topographic factors were summarized in Table 1. Average SOC in 1999 was significantly different from the average SOC in 2003 for alluvial plain, Fluvio-marine alluvium, local valley and fan. Exception was old alluvium. Average SOC in old alluvium soils was greater (i.e., 12.8 g kg
-1in 1999 and 13.0 g kg
-1in 2003) than other topographical characteristics. SOC storage rate for alluvial plain and fluvio-marine alluvium was higher than old alluvium.
SOC in newly reclaimed paddy soils were higher for
both 1999 and 2003 compared to other types of paddy
soils and average of SOC was significantly different
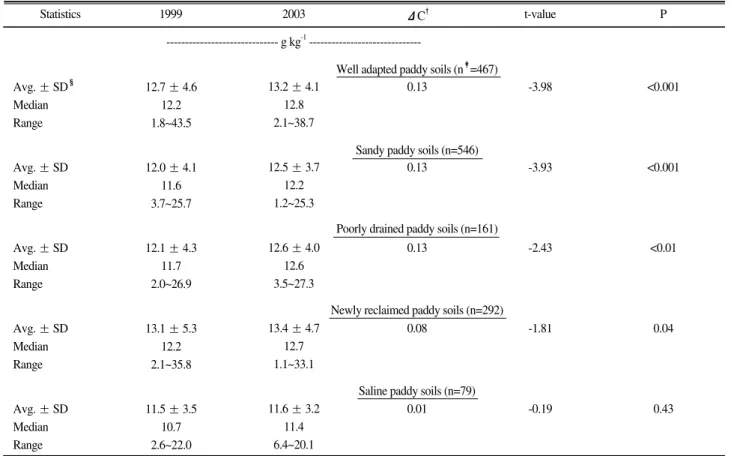
(p<0.04) between 1999 and 2003 (Table 2). On the other
hand, SOC in saline paddy soils was lower than in any
other types of paddy soils and the average of SOC wasn't
significantly different between 1999 and 2003. Average
Fig. 1. Distribution of Korean paddy soil organic carbon in 1999 and 2003.Statistics
"
Change of soil oranic carbon per year
‡Number of samples Standard deviation Avg. ± SD Median Range
Avg. ± SD Median Range
Avg. ± SD Median Range
Avg. ± SD Median Range
12.2 ± 4.8 11.2 1.8~43.5
12.1 ± 3.8 11.6 2.6~22.6
12.6 ± 4.6 12.2 2.2~35.8
12.8 ± 4.0 12.4 4.3~25.2
12.7 ± 4.4 12.2 2.0~38.7
12.7 ± 3.4 12.2 2.3~26.7
12.9 ± 4.1 12.6 1.1~35.9
13.0 ± 3.7 12.7 3.6~22.7
0.13
0.15
0.08
0.05
-4.12
-3.38
-3.34
-0.88
<0.001
<0.001
<0.001
0.19 P t-value
ΔC"
2003 1999
Table 1. Descriptive statistics of soil organic carbon changes between 1999 and 2003 by topographical characteristics in Korea paddy soils.
--- g kg-1---
Alluvial plain (n‡=430)
Fluvio-marine alluvium (n=241)
Local valley and fan (n=779)
Old alluvium (n=95)
Statistics
"
Change of soil oranic carbon per year
‡Number of samples Standard deviation Avg. ± SD Median Range
Avg. ± SD Median Range
Avg. ± SD Median Range
Avg. ± SD Median Range
Avg. ± SD Median Range
12.7 ± 4.6 12.2 1.8~43.5
12.0 ± 4.1 11.6 3.7~25.7
12.1 ± 4.3 11.7 2.0~26.9
13.1 ± 5.3 12.2 2.1~35.8
11.5 ± 3.5 10.7 2.6~22.0
13.2 ± 4.1 12.8 2.1~38.7
12.5 ± 3.7 12.2 1.2~25.3
12.6 ± 4.0 12.6 3.5~27.3
13.4 ± 4.7 12.7 1.1~33.1
11.6 ± 3.2 11.4 6.4~20.1
0.13
0.13
0.13
0.08
0.01
-3.98
-3.93
-2.43
-1.81
-0.19
<0.001
<0.001
<0.01
0.04
0.43 P t-value
ΔC"
2003 1999
Table 2. Descriptive statistics of soil organic carbon changes between 1999 and 2003 by types of paddy soils.
--- g kg-1---
Well adapted paddy soils (n‡=467)
Sandy paddy soils (n=546)
Poorly drained paddy soils (n=161)
Newly reclaimed paddy soils (n=292)
Saline paddy soils (n=79)
soils in 2003 were significantly increased compare to those in 1999. SOC change rate for well adapted, sandy and poorly drained paddy soils was relatively higher (i.e., 0.13 g kg
-1yr
-1) than other types of paddy soils.
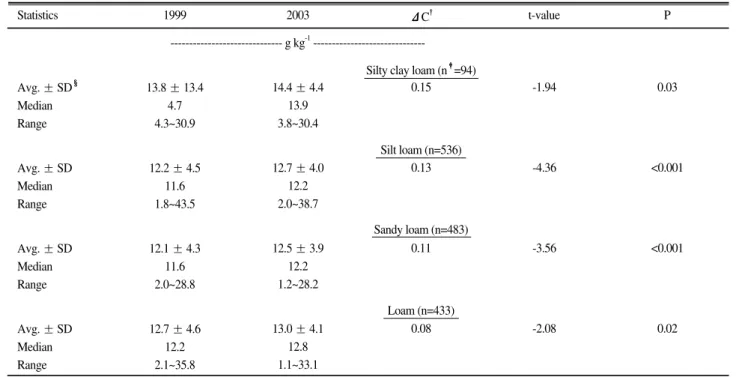
Average SOC of silty clay loam soils showed the highest both 1999 (i.e., 13.8 g kg
-1) and 2003 (i.e., 14.4 g kg
-1) when compared to other surface soil texture (Table 3). Average SOC of 2003 for silt loam and sandy loam was very significantly increased (p<0.001) when compared to that of 1999. Average SOC for silty clay loam and loam was also significantly different between 1999 and 2003. Average SOC increase rate was 0.13 and 0.15 g kg
-1yr
-1for silt loam and silty clay loam, respectively.
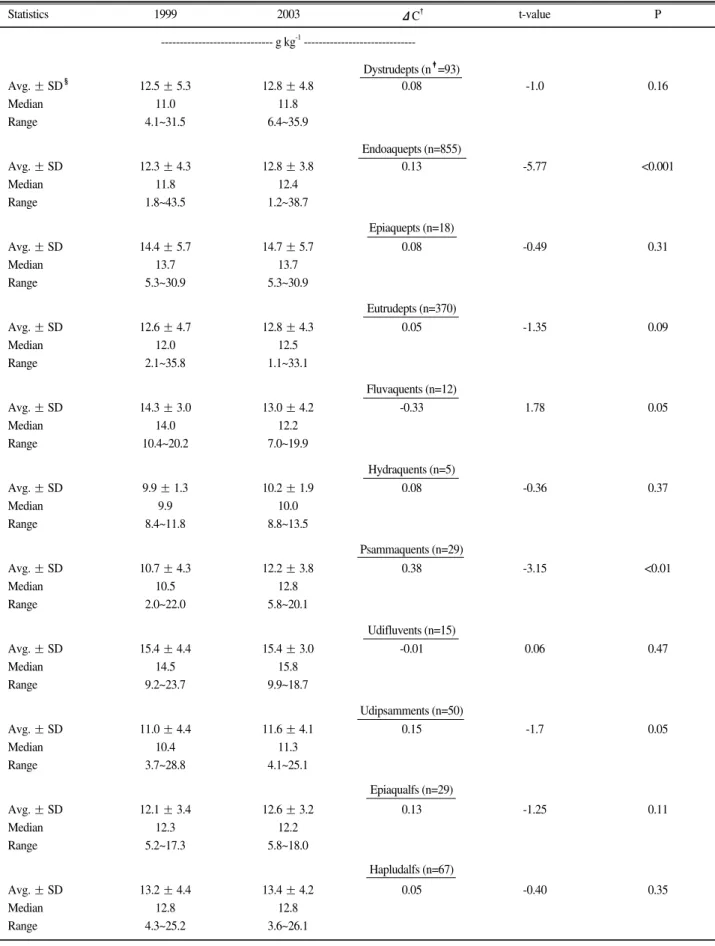
Average SOC of Endoaquepts, which is the predominant great group in Korean paddy soil taxonomical class, was significantly increased (p<0.001) in 2003 compared to 1999. Otherwise, average SOC of Fluvaquents was decreased (-0.33 g kg
-1yr
-1) in 2003 compared to 1999 (Table 4). Average SOC of Psammaquents was significantly increased (p<0.01) from 1999 (10.7 g kg
-1) to 2003 (12.2 g kg
-1). The greatest annual SOC increase (0.38 g kg
-1yr
-1) great group was observed in Psammaquents.
same locations in nationwide except islands. Soil organic carbon in paddy soils for 2003 was compared to that for 1999 by topographical, types of paddy soils, surface soil texture, and taxonomical characteristics. SOC tend to increase in Inceptisol, which is predominant soil order for Korean paddy soils, from 1999 to 2003.
Soil organic carbon increases in topographically plain paddy soils were greater than valley soils.
Soil organic carbon increasing in paddy soils was observed in predominant types of paddy soils (i.e., well adapted paddy soils, sandy paddy soils, and poorly drained paddy soils) while soil organic carbon of saline paddy soils was low and stable between 1999 and 2003.
We also found that clay paddy soils are greater in soil organic carbon than sandy paddy soils.
Conclusion
Generally, Korean paddy soils have long been almost uniformly managed throughout the whole country with flooded, deep tillage, puddlling, transplanting, and uncovering after harvest. However, soil organic carbon dynamics for Korean paddy soils have not well understood. As one of major sources of green house
Statistics
"
Change of soil oranic carbon per year
‡Number of samples Standard deviation Avg. ± SD Median Range
Avg. ± SD Median Range
Avg. ± SD Median Range
Avg. ± SD Median Range
13.8 ± 13.4 4.7 4.3~30.9
12.2 ± 4.5 11.6 1.8~43.5
12.1 ± 4.3 11.6 2.0~28.8
12.7 ± 4.6 12.2 2.1~35.8
14.4 ± 4.4 13.9 3.8~30.4
12.7 ± 4.0 12.2 2.0~38.7
12.5 ± 3.9 12.2 1.2~28.2
13.0 ± 4.1 12.8 1.1~33.1
0.15
0.13
0.11
0.08
-1.94
-4.36
-3.56
-2.08
0.03
<0.001
<0.001
0.02 P t-value
ΔC"
2003 1999
Table 3. Descriptive statistics of soil organic carbon changes between 1999 and 2003 by surface soil texture
--- g kg-1---
Silty clay loam (n‡=94)
Silt loam (n=536)
Sandy loam (n=483)
Loam (n=433)
Statistics
Avg. ± SD Median Range
Avg. ± SD Median Range
Avg. ± SD Median Range
Avg. ± SD Median Range
Avg. ± SD Median Range
Avg. ± SD Median Range
Avg. ± SD Median Range
Avg. ± SD Median Range
Avg. ± SD Median Range
Avg. ± SD Median Range
Avg. ± SD Median Range
12.5 ± 5.3 11.0 4.1~31.5
12.3 ± 4.3 11.8 1.8~43.5
14.4 ± 5.7 13.7 5.3~30.9
12.6 ± 4.7 12.0 2.1~35.8
14.3 ± 3.0 14.0 10.4~20.2
9.9 ± 1.3 9.9 8.4~11.8
10.7 ± 4.3 10.5 2.0~22.0
15.4 ± 4.4 14.5 9.2~23.7
11.0 ± 4.4 10.4 3.7~28.8
12.1 ± 3.4 12.3 5.2~17.3
13.2 ± 4.4 12.8 4.3~25.2
12.8 ± 4.8 11.8 6.4~35.9
12.8 ± 3.8 12.4 1.2~38.7
14.7 ± 5.7 13.7 5.3~30.9
12.8 ± 4.3 12.5 1.1~33.1
13.0 ± 4.2 12.2 7.0~19.9
10.2 ± 1.9 10.0 8.8~13.5
12.2 ± 3.8 12.8 5.8~20.1
15.4 ± 3.0 15.8 9.9~18.7
11.6 ± 4.1 11.3 4.1~25.1
12.6 ± 3.2 12.2 5.8~18.0
13.4 ± 4.2 12.8 3.6~26.1
0.08
0.13
0.08
0.05
-0.33
0.08
0.38
-0.01
0.15
0.13
0.05
-1.0
-5.77
-0.49
-1.35
1.78
-0.36
-3.15
0.06
-1.7
-1.25
-0.40
0.16
<0.001
0.31
0.09
0.05
0.37
<0.01
0.47
0.05
0.11
0.35 P t-value
ΔC"
2003 1999
Table 4. Descriptive statistics of soil organic carbon changes between 1999 and 2003 by taxonomical class of Korean paddy soils (i.e., great group)
--- g kg-1--- Dystrudepts (n‡=93)
Endoaquepts (n=855)
Epiaquepts (n=18)
Eutrudepts (n=370)
Fluvaquents (n=12)
Hydraquents (n=5)
Psammaquents (n=29)
Udifluvents (n=15)
Udipsamments (n=50)
Epiaqualfs (n=29)
Hapludalfs (n=67)
"
Change of soil oranic carbon per year
‡Number of samples Standard deviation
found that soil organic carbon of paddy soils tended to increase since 1999, and help to reduce carbon dioxide emission through acting as a sink for atmospheric CO
2. This could be explained by an increased soil carbon sequestration. We suggest that further researches including the effects of paddy soils tillage practices and plant residues return into the soils, could contribute to reduction in carbon dioxide emission into the atmosphere. With the adoption of improved management practices, these soils have potential for SOC gains.
References
Allen, L.H. Jr., S.L. Albrecht, K.J. Boote, J.M.G. Thomas, Y.C.
Newman, and K.W. Skirvin. 2006. Soil Organic Carbon and Nitrogen Accumulation in Plots of Rhizoma Perennial Peanut and Bahiagrass Grown in Elevated Carbon Dioxide and Temperature.
J. Environ. Qual. 2006; 35:1405-1412.
Cambardella, C.A. and H.W. Doran. 1996. Assessing soil quality by testing organic matter. p. 41-50. In Jerry M. Bogham et al. (ed.) Soil organic matter: Analysis and interpretation. SSSA Special publication No. 46. SSSA, Madison, WI, USA.
Esuola, A.G. and A. Weersink. 2006. Carbon Banks: An Efficient Means to Exchange Sequestered Carbon. J. Environ Qual.
35:1525-1532
Frenzluebbers, A.J. and J.L. Steiner. 2002. Climatic influences on soil organic carbon storage with no tillage. In Kimble et al. (ed.), Agricultural practices and policies for carbon sequestration in soil, Lewis Publ., Boca Raton, FL.
Guo, Y., P. Gong, R. Amundson, and Q. Yu. 2006. Analysis of Factors Controlling Soil Carbon in the Conterminous United States. Soil Sci. Soc. Am. J. 70:601-612.
Hooker, B. A., T.F. Morris, R.Peters, and Z.G. Cardon. 2005. Long term Effects of Tillage and Corn Stalk Return on Soil Carbon Dynamics. Soil Sci. Soc. Am. J. 69:188-196.
Jung, W.K. and Y.H. Kim. 2006. Soil organic carbon determination for calcareous soils. Korean J. Soil Sci. Fert. 39:396-402.
Lal, R. 2004. Soil carbon sequestration impacts on global climate change and food security. Science 304:1623-1626.
Lal, R., J. Kimble, and R.F. Follett. 1997. Pedospheric processes and the carbon cycle. p. 1-8. In Rattan Lal et al. (ed.) Soil process and the carbon cycle. CRC Press. Boca Raton, FL, USA.
Lal, R., M. Griffin, J. Apt, L. Lave, M.G. Gorgan. 2004. Managing soil carbon. Science 304:393.
Machado, S., K. Rhinhart and S. Petrie. 2006. Long Term Cropping System Effects on Carbon Sequestration in Eastern Oregon. J Environ Qual. 35:1548-1553.
NIAST (National Institute of Agricultural Science and Technology).
2000. Taxonomical classification of Korean soils. National Institute of Agricultural Science and Technology, Suwon, Korea.
Olness, A., D. Lopez, J. Cordes, C. Sweeney, N. Mattson, and W.B.
Voorhees. 2002. Agricultural practices and policies for carbon sequestration in soil, Lewis Publ., Boca Raton, FL.
Parkin, T.B. and T.C. Kaspar. 2003. Temperature Controls on Diurnal Carbon Dioxide Flux: Implications for Estimating Soil Carbon Loss. Soil Sci. Soc. Am. J. 67:1763-1772.
Sainju , U.M., A. Lenssen, T. Caesar Tonthat, and J. Waddell. 2006.
Tillage and Crop Rotation Effects on Dryland Soil and Residue Carbon and Nitrogen. Soil Sci. Soc. Am. J. 70:668-678.
Sherrod, L. A., G.A. Peterson, D.G. Westfall, and L.R. Ahuja. 2005.
Soil Organic Carbon Pools After 12 Years in No-Till Dryland Agroecosystems. Soil Sci. Soc. Am. J. 69:1600-1608.
VandenBygaart, A. J. and B.D. Kay. 2004. Persistence of Soil Organic Carbon after Plowing a Long-Term No-Till Field in Southern Ontario, Canada. Soil Sci. Soc. Am. J. 68:1394-1402.
Wall, G.W., R.L. Garcia, B.A. Kimball, D.J. Hunsaker, P.J. Pinter Jr., S.P. Long, C.P. Osborne, D.L. Hendrix, F. Wechsung, G.
Wechsung, S.W. Leavitt, R.L. LaMorte, and S.B. Idso. 2006.
Interactive Effects of Elevated Carbon Dioxide and Drought on Wheat. Agron. J. 98:354-381.
Weil, R.R. and F. Magdoff. 2004. Significance of soil organic matter to soil quality and health. In F. Magdoff and R.R. Weil (ed.). Soil organic matter in sustainable agriculture. CRC Press.
Boca Raton, FL, USA.
Zach, A., H. Tiessen, and E. Noellemeyer. 2006. Carbon Turnover and Carbon-13 Natural Abundance under Land Use Change in Semiarid Savanna Soils of La Pampa, Argentina Soil Sci. Soc.
Am. J. 70:1541-1546
지구온난화, 기후변화 및 온실가스 배출 및 저감기술에 관한 많은 연구가 수행되고 있으나, 토양 내 유기탄소의 축적을 통한 온실가스 배출억제에 대한 연구는 매우 미진하며, 특별히 우리나라 농경지의 주요 이용형태인 논 토양에 대해서는 유기탄소의 축적량 산정을 포함한 변동 등에 대한 연구가 매우 미흡하다. 본 연구에서는 도서 를 제외한 우리나라 전국적인 논 토양 유기탄소의 연차별 모니터링을 통하여 토양에서 유기탄소의 연차간 변 동을 평가하였으며 토양의 생성학적, 물리적 특성에 따라 토양유기탄소의 변화에 대한 해석을 시도하였다. 연 구결과, 토양 생성분류학적으로 우리나라의 주된 논토양인 Inceptisol 에서 토양유기탄소량이 1999년에 비하여 2003년에 증가하는 경향이었던 것으로 나타났으며, 논의 이용형태별로는 염해답이나 미숙답에서 보다 보통답, 사질답, 배수불량답에서 토양유기탄소가 증가하는 것으로 나타났다. 표토의 토성별로 양토에서 보다 미사 식양 토 및 미사양토에서 유기탄소의 증가가 높게 나타났다. 지형적으로는 곡간지에서 보다 평탄지에서 토양유기탄 소의 증가율이 높게 나타났다. 결론적으로, 본 연구의 결과를 통하여, 1999년 이후 논토양에서 토양유기탄소의 양이 증가하는 경향을 나타내고 있으며 (+0.11 g kg-1 yr-1) 이는 대기중의 이산화탄소를, 논 토양의 유기탄소 축적기능을 통해, 토양 중에 저장함으로써 논토양이 온실가스 흡수원으로서의 역할을 하는 것으로 해석할 수 있다.
우리나라 논 토양의 토양유기탄소 변동 특성
정원교*·김선관
농업과학기술원 농업환경부 토양관리과