JDCS Vol. 18, No. 8, pp. 1661-1669, Dec. 2017
라즈베리파이 센서를 활용한 독거노인 모니터링 시스템
이 성 훈 · 이 준 엽 · 김 정 숙1*
삼육대학교 컴퓨터학부
Monitoring System for the Elderly Living Alone Using the RaspberryPi Sensor
Sung-Hoon Lee · June-Yeop Lee · Jung-Sook Kim
1*Division of Computer Engineering & Science, Sahmyook University, Seoul 01795, Korea
[요 약]
2017년 우리나라는 독거노인 130만 시대에 이르렀다. 정부는 독거노인의 안부를 체크하기 위해 생활보호사를 활용한 노 인돌봄 기본서비스 사업을 추진하고 있다. 하지만 노인돌보미의 인력 부족과 서비스 이용률 저하로 관리의 어려움에 놓여 있다. 이러한 환경적 제약사항을 개선하기 위하여 본 논문에서는 온도, 습도, 동작 감지, 가스누출 감지 등의 센서를 활용 하는 독거노인 모니터링 시스템을 구축하였다. 센서는 주기적으로 노인들의 각종 현황 데이터를 수집하여 서버에 전송하 고, 이 데이터를 기반으로 실시간 그래프를 작성한 후 웹을 통해 모니터링하는 체제이다. 모니터링 과정에서 센서가 정해 진 값의 범위를 벗어나면 보호자에게 경고 문자 메시지를 보내어 현황을 통보해 주는 기능을 추가하여 독거노인들의 안전 생활을 지원할 수 있도록 설계하고 구현하였다.
[Abstract]
In 2017, Korea has reached 1.3 million elderly people living alone. The government is promoting the basic care service for the elderly by using care workers to check the security of the elderly living alone. However, due to lack of service personnel and service usage rate of elderly care workers, it is difficult to manage. To improve these environmental constraints, this study attempted to construct a monitoring system for elderly people living alone by using sensors such as temperature, humidity, motion detection, and gas leak detection. The sensor periodically collects the current status data of the elderly and sends them to the server, creates a real time graph based on the data, and monitors it through the web. In the monitoring process, when the sensor is out of the range of the specified value, it sends a warning text message to the guardian to inform the current situation, and is designed and implemented so as to support the safety life of the elderly living alone.
색인어 : 독거노인, 무선센서, 원격의료 모니터링 시스템, 초기화면 설정
Key word : Elderly living alone, Wireless Sensors, Remote patients Monitoring System, Initial screen setting
http://dx.doi.org/10.9728/dcs.2017.18.8.1661
This is an Open Access article distributed under the terms of the Creative Commons Attribution Non-CommercialLicense(http://creativecommons .org/licenses/by-nc/3.0/) which permits unrestricted non-commercial use, distribution, and reproduction in any medium, provided the original work is properly cited.
Received 08 December 2017; Revised 26 December 2017 Accepted 28 December 2017
*Corresponding Author; Jung-sook Kim Tel: +82-02-3399-1782
E-mail: [email protected]
Ⅰ. Introduction
According to the resident population at the end of August, the population aged 65 and over was about 7.25 million, accounting for 14% of the total population and entering the aged society [1].
In particular, the number of elderly living alone has increased by about 10% in the last three years to 1.337 million in 2017 [2][3].
As the number of single households of the elderly increases, the government has been implementing elderly care services since 2007 to solve solitude death [4] or suicide problems of the elderly living alone. The elderly care service is operated by care workers who visit the elderly person's house once a week and confirm their status via the phone 2 or 3 times a week. The service target is elderly people aged 65 years old or more who receive basic pension, and the number of users is 220,000 persons which is only 27.8% of the elderly living alone. In addition, since 2008, by installing a fire, gas detector, and emergency pager in houses where the elderly live alone, if an emergency such as a fire occurs, the emergency alert service for the elderly living alone is provided through the 119 automatic notification. However, only 7.3% of the elderly living alone are receiving this service. There are also services provided by the telecommunication service companies. SKT is under consideration about the elderly person protection system for the elderly while conducting research on emergency alerting services for the elderly living alone as a public service. KT also develops and operates LED lights with smart IoT sensors. However, it is difficult to cope quickly because it is only a demonstration project of 80 households, and only when there is no movement for a long time, nurses, social workers or public health nurses are visiting their homes. LG U+
has deployed to a thousand households an IoT energy meter to inform the real‐time electricity usage, fare and electricity usage patterns, but the beneficiaries are less than 1%. Ribbon Silver Care, which is considered to be the most realistic service, offers only activity detection and emergency call function with high monthly fee of 27,000 won per month. Although a variety of services for monitoring the status of the elderly living alone have been studied, it is true that they have not been of much practical help.
In this study, the sensor periodically collects the temperature and humidity data and transmits it to the server, and the receiving server stores the received data in the DB. Based on this data, we designed and implemented a low cost and high quality service system that can monitor temperature and humidity, motion detection, and gas leakage through real time graph creation. Also, if the temperature and humidity are abnormal, the guardian can be alerted by text message to prepare for an emergency. Since the
collected data is provided via the web, the administrator can monitor the situation anytime and anywhere, and can check it on the smartphone because it employs the standard web technology.
Users can monitor the selected sensor in real‐time or can check the temperature, humidity and motion of the selected time in the desired time zone. Users can also check the gas leak graph. The details of when to send a warning message are designed to be used for various purposes by providing a setting environment which is determined by options before monitoring starts.
Ⅱ. Related research
Wireless sensor network technology forms an autonomous network by deploying sensor nodes with computing ability and wireless communication ability in application environment. It is a technology that wirelessly collects data acquired from sensor nodes and uses them for monitoring/control. The ultimate goal of wireless sensor network technology is to provide computing and wireless communication capabilities to all objects to enable an environment that enables communication between objects anytime, anywhere. Currently, various technologies are converging and evolving into IoT network technology. As above, as the wireless sensor network technology is the basis of the IoT network technology, and it can form a mutually intelligent autonomous network for sensing, information processing and exchange by inter‐object collaboration with no human intervention or minimal intervention, the wireless sensor routing technology is important [5].
2-1 Wireless sensor network [6]
Near field communication, WiFi, and 3G/4G/LTE are typical technologies for the Internet of things. And Unlike IP‐based protocols, in which devices send and receive information based on their Internet connection, communication between devices that do not use IP uses Bluetooth, ZigBee, 6LowPAN, 5G, or SDN, etc. In this way, a ultra connection network between objects is constructed by various communication methods according to device characteristics.
1) ZigBee
ZigBee is a wireless network technology developed by the
ZigBee Alliance for low‐speed transmission and short‐range
communication. It is a small‐sized, low‐power, low‐cost,
ubiquitous networking solution. And it is used in the near field
telecommunication market including intelligent home network,
and building, etc., and industrial automation, logistics, human
interface, telematics, environmental monitoring, and military. The ZigBee protocol consists of a physical layer, a media access control (MAC) layer, a network layer, and an application layer.
The physical and MAC layers of ZigBee are defined in the IEEE 802.15.4 standard, and the other protocol stacks are defined in the ZigBee specification. In the early version of IEEE 802.15.4, Europe supported 20kbps in the 868MHz band and 40kbps in the 915MHz in the US.
2) 6LoWPAN
A traditional sensor node structure that implements non‐IP network technology can be connected to the Internet through a sink node to share information. To do this, sensor nodes need to apply technologies such as 6LoWPAN. 6LoWPAN (IPv6 over low power WPAN) is a technology that connects IPv6 to existing IP network by installing IPv6 on low power WPAN using IEEE 802.15.43 as PHY/MAC. IPv6 technology has enabled various smart and sensor devices to connect to IP‐based networks without an intermediary such as a gateway. In wireless sensor networks, however, a limited packet size and limited power consumption require header compression and automatic address setting. For this, 6LoWPAN IETF working group has been created and related research on IPv6 and IEEE 802.15.4 is being carried out, and it will become a network‐based technology that can realize Internet of things in the future.
3) 5G
The future 5G, which is the realization of ultra connection communication in the future, as shown in Fig.1, embodies functions such as remote monitoring, which collects the status and environment information of objects in a network with large objects, remote control to remotely control facilities or devices, remote tracking in conjunction with location information of moving objects, and information exchange via a wireless network.
Through this, it is possible to manage plants, buildings and facilities such as connected vehicles service, energy saving, carbon emission regulation, and hazardous material leakage prevention, which are possible for autonomous driving and maintenance system of vehicles, or it is expected that a variety of Internet services will be visible in areas related to quality of life such as smart home service, water quality, air quality, noise, etc., which can automate housekeeping activities by controlling communication between devices in the home. The 5G's main requirements, which are being discussed by domestic 5G forums and global operators and manufacturers, are integrated wired/wireless All‐IT based 1,000 times increased capacity compared with 4G, and energy savings, providing the speed of
Gbps level per person anytime, anywhere, and the acceptance of large‐scale devices in the IoT age. The evolution of data rates triggered by the commercialization of 4G network is continuing in the 5G network, as well as ultra connection communication, ultra‐real‐time processing, virtualized network infrastructure and All‐IT evolution.
Fig.1. Concept diagram of 5G technology
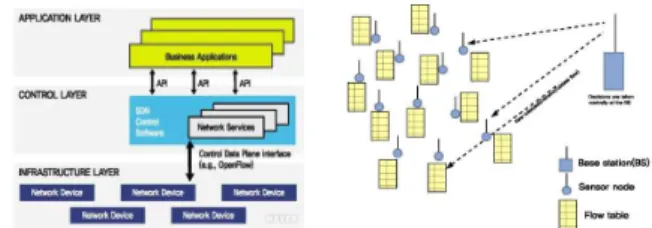
4) SDN (Software‐Defined Networking)
In the IoT age, network infrastructure also takes into account the factors of scalability and flexibility. The introduction of SDN and Network Functional Virtualization (NFV) technology in Fig.2, which provides optimal performance for individual services for building and utilizing IoT application services, is introduced in the IoT network. In addition to efficiently processing data due to sensor nodes and sensor amplification, existing network infrastructure supports a simple and flexible service‐oriented structure. New service introduction time will be shortened and efficiency improvement through virtualization and sharing of network resources will be expected to reduce network construction and operation cost. SDN is a next‐generation networking technology that facilitates network routing, control, and complex operation management through software programming. For this purpose, SDN separates the data plane and control plane of the network and provides a standardized interface between them. The network operator can control the communication functions in the data plane in various ways by programming the control plane according to various situations.
The intelligence of the network is centralized to the SDN
controller to manage the entire network, and the network is
considered as a single logical switch. Network administrators, for
example, do not have to manually manage the configuration information of thousands of lines distributed across thousands of devices. The network can be controlled by simply configuring the abstracted network as a program only. Along with network abstraction, SDN provides a set of APIs between the SDN control layer and the application layer. APIs can be used to implement common network services and all types of policy management such as routing, access control, traffic engineering, QoS management, and power control can be applied to meet business goals.
(a) SDN definition network structure (b) SDN wireless sensor network frame
Fig.2. SDN concept diagram
2-2 Digital medical and remote patients monitoring system
With the advancement of digital technology, patient medical data, which has been analyzed and interpreted by medical experts, is now able to diagnose and provide medical services by a new way of telemedicine. As digital technologies such as communications, sensors, batteries, cloud computing, and security have progressed exponentially, the amount and quality of medical services that medical staff can remotely provide to patients has dramatically improved.
In January 2016, the Ministry of Health and Welfare announced plans for a bio‐health work plan as the same frame of concept of "digital healthcare" and "telemedicine". However, digital healthcare is a broader concept than telemedicine, and telemedicine is likely to be seen as one of many areas of digital healthcare, as shown in Fig.3.
Fig.3. Structural diagram of health care field[7]
Telemedicine consists of telephone, text messaging, e‐mail, etc., in a remote form through telecommunication technology instead of receiving a medical examination at a hospital office.
Telemedicine, on the other hand, involves remote medical services and includes services to remotely monitor patients' health and disease status. For example, blood glucose, blood pressure, and electrocardiogram data measured at home by the patient are transmitted to the hospital and monitored, and this is called remote patients monitoring [6][7].
2-3 RaspberryPi Application Examples
If Arduino is a leader in Microcontrollers, RaspberryPi is an OS-based platform that does not fit into any kind of project development. However, thanks to the connectivity with peripherals and networks as a single PC, it is easy to create many application projects such as Table 1, which could not be done on the Microcontroller based board but only for a high cost[8].
Table 1. RaspberryPi Application Examples Division Application Area Benefit
GPIO Application
- LED Control/digital output - Digital motion detection - Analog temperature measurement - Indoor illumination measurement
- GPIO Pin Control Using Instruction
- Controlling memory checks with cell script - Web server can output memory usage
- Ability to check for circuit problems
Camera Application
- USB camera video - Raspberry pie camera - Burglar Alarm Production -Video streaming and motion detection
- Capture pictures and record videos
- Cell script enabled - Continuous processing at regular intervals using CRON
Substitute Playstation
- Raspbmc - CODER - Raspberry pi kiosk
- Available as a multimedia center - Homepage Web Server - Can produce Twitter kiosk
RaspberryPi Game - Minecraft - RaspberryPi game
- Game + Python programming interface provided
- Classic game +
emulation of other platforms
Ⅲ. Design and application devices of monitoring system
3-1 System Configuration Diagram
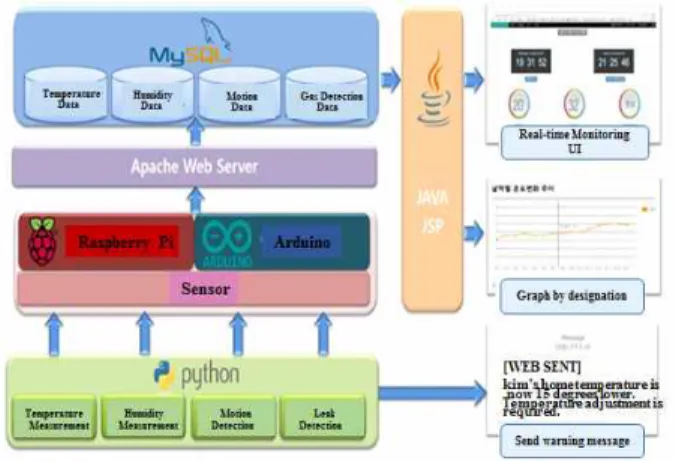
The system configuration diagram is shown in Fig.4. Through
the sensor, RaspberryPi and Arduino can periodically collect data
such as temperature, humidity, motion detection, and gas leak
detection[9][10]. The collected data is transferred to the server through the Python program. The server stores the data received from the sensor in the DB. Data collected at this time are data reception order and time, ID and temperature of data transmission sensor, humidity, motion detection, and gas leak detection data, etc. Based on the collected DB data, it shows periodically updated temperature and humidity graph to the user through JSP view page, and the web server detects abnormality and sends a warning message.
Fig.4. System configuration diagram
3-2 Equipment Used
1) Smart home with RaspberryPi 3
The IoT, which can interconnect new Internet‐enabled devices and produce new information and services, can be used in various fields such as home, office, and factory. There is an increasing tendency to implement a smart home that can monitor and control the home environment by connecting various sensors to Raspberry Pi, which offers low price but powerful functions. The implemented system acts not only as a sensor but also as a web node that can be directly connected to an external network. Smart home technology equipped with a smart device has a drawback in that it cannot provide an optimized service that reflects the needs of the user although the technology competition of global companies is fierce and various technologies are being developed.
Therefore, as DiY (Do‐It‐Yourself), which is a combination of inexpensive devices and users are equipped with the devices they want to use and programs themselves by using open source, has advantages of fun and cost saving for users, it is in the spotlight recently[11][12].
The RaspberryPi 3 used in this study has built‐in wireless LAN and Bluetooth functions, and improved CPU speed and power management at 1.2GHz[13]. Immediately upon purchase, it can
be applicable for devices such as IoT, Bluetooth headphones or speakers, Wi‐Fi gateway, and home cloud storage, etc. The Raspberry Pi3 reads the values of each sensor and stores the data in the database.
2) Vibration Module SW‐420
The vibration sensor used here is the SW‐420 shown in Fig. 5, which provides an accurate and sensitive Figure.at an inexpensive value. This vibration sensor can be used to adjust the vibration sensitivity using a potentiometer on the board. When the module does not sense vibration, the switch is closed and designed to accept no value. By setting the sensitivity when the drawer or gate is closed, the vibration detection time and the number of times of vibration are to be stored when the vibration is sensed each time it is moved.
Fig. 5 Vibration Sensor SW‐420
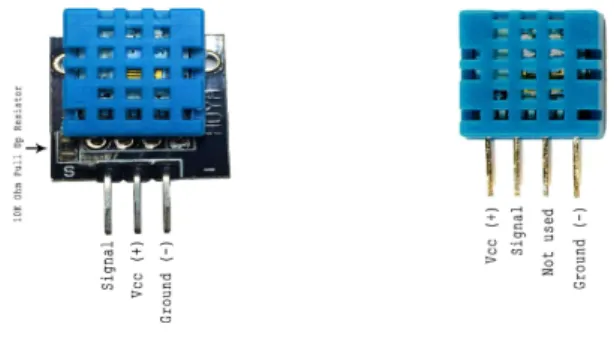
3) Temperature & Humidity Module DHT‐11
The temperature and humidity sensor is an HDT‐11 widely used as in Fig. 6, which ensures high reliability in temperature and humidity sensing by using an exclusive digital signaling method. The sensor also includes a resistive‐type humidity measurement, which provides a reasonable price ($1) for good quality, fast response, and anti‐interface capabilities with NTC temperature measurement and fast interfacing to 8‐bit Microcontrollers[14]. The required voltage is 3.3V~5.5V, the measurement range temperature is 0~50℃±2℃, and the error range is 20~90% RH±5% RH. The NTC thermistor is a temperature sensor that lowers the resistance value when the temperature rises, and there are two types. One is the NTC thermistor whose resistance varies with the external temperature, and the other is an NTC thermistor whose resistance changes by the heat generated by the current flowing in the circuit.
DHT11 measures the temperature of the outside by using the
electronic thermistor. The humidity sensor can determine the
change in humidity in the air by measuring the change in resistance between the two electrodes. On the surface of the humidity sensor, there is a thin plate with an electrode attached, which absorbs moisture in the air, and when the conductivity of the electrode changes due to the amount of water adhering to the surface, it is detected. The temperature sensor is a semiconductor ceramics sintered at a high temperature, and the temperature is measured by sensing a change in resistance value using a material whose resistance value changes with the temperature. The time and temperature/humidity values when the measured value comes into the normal value are stored in the DB.
Fig. 6. Temperature & Humidity Module DHT‐11
4) Gas Module MQ‐5
The gas module is suitable for detecting H2O, LPG, CH4, CO and alcohol with MQ‐5, a sensor useful for gas leakage detection in Fig.7. High sensitivity and fast response time enable fast measurement. Sensor sensitivity can be adjusted using a potentiometer[15].
Gas sensors usually provide values as analog signals.
However, GPIOs of Raspberry Pi can only read digital signals. To use the gas sensor with the Raspberry Pi, the values can be detected by using the Arduino to read the correct value in a short time or by using the analog‐digital signal converter on the Brad board. In this study, we worked with Arduino to read and drive the correct values. By connecting the Arduino to the USB port and setting the port by setting the baudrate, precise values can be received from the gas module.
Fig. 7. Gas Module MQ‐5
5) Auxiliary Device Arduino Uno
To read the value of MQ‐5 precisely, Arduino uno in Fig.8.
was used. Arduino uno is an ultra small board based on ATmega32P. It consists of 14 digital inputs/outputs and six analog input USB connection port power lines, and includes all that can drive ultra small controllers. When the USB is simply connected, the power will be turned on and simple operation can start [16]. Weighing only 25g, it is specialized to receive various analog and digital signals precisely, so it can collect information about gas constantly. If the data exceeding the normal value is detected, a signal will be sent to RaspberryPi to indicate that the gas is leaking.
Fig. 8. Auxiliary Device Arduino UnoThe system
Ⅳ. System implementation and Simulation
4-1 Development Environment
The RaspberryPi program, which collects and transmits sensor data such as temperature, humidity, motion detection, and gas leak detection, is written in Python on Rasbian Linux and collects data and transfers the data to the MySQL database in real time.
We used the HTTP protocol to show the graph to the user, and for
this, the web server used was Apache. The page used to retrieve
information from the DB was created using JSP. The page that the
user directly displays the graph is written in HTML and
JavaScript, and the graph is drawn using the Nwagon library. The
server uses Linux Crontap to check for abnormal conditions such
as temperature and humidity setting range, operation detection
timeout, and gas leakage status every 1 to 2 minutes, and if an
abnormal situation occurs, the Python program consisting of
CTM module sends status messaged. On the web page, we
implemented functions such as logging in to the Kakao account,
card payment system using the iMPORT API, and managing
inquiries using the Google Maps API.
4‐2 Initial screen setting
The user can see the initial setup screen shown in Fig.9, and the user can set the temperature, humidity normal range, normal change rate, and frequency of motion detection allowed in this page. A warning message is sent when temperature and humidity outside the allowable range are detected. As detection of sensor break can also be set and if there is no data to be received for a certain period of time, it can be regarded as disconnected and input. After finishing the setting, press the start button to start monitoring.
Fig.9. Initial setting screen
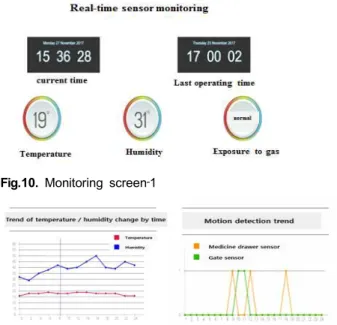
4‐3 Monitoring Screen
After completing the initial setup, monitoring can start as shown in Fig.10 and Fig.11 through the 'configuration' button.
The monitoring screen displays the current time, the last operating time of the motion detection sensor, temperature, humidity, and gas leakage. Since a graph indicating temperature and humidity is generated for each sensor, a graph indicating whether or not gas leakage is detected and a motion detection trend can be generated. The number of graphs can be adjusted through the top graph add/delete buttons, and the number of data output at one time on the sensor or screen displayed by each graph can be adjusted.
The monitoring graph is updated once every 3 seconds, and the place where the sensor actually collects data is marked on the graph so that the time interval between the actual received data can be visually recognized. This marker can be turned on/off by the user during monitoring. The pause button can allow to stop updating the graph and keep the current screen and resume.
Fig.10. Monitoring screen‐1
Fig.11. Monitoring screen‐2
4‐4 Interworking with Database
To show the temperature and humidity graph, the motion detection time, and the gas leak, information should be taken from the DB. Mybatis in Spring Framework is responsible for getting information from the DB. The data information is fetched by using a query divided by time, date, and month for each designation. The monitor.jsp page allows you to use ajax to read the information retrieved from the database whenever you need it.
Thanks to ajax, the user does not have to move the page to update the monitoring graph, and the service can be provided within a single page.
4‐5 Sending a message about a warning situation The warning messages are sent in five cases as in Table 2.
Table 2. Warning Message
Detection and warning of the rate of change will be helpful because the sudden change itself rather than the absolute value of temperature and humidity matters according to the environment.
Situation Message Contents
Situation1 When the sensor does not send data for a certain period of time Situation2 When the temperature and humidity rise or fall above the set
level
Situation3 When gas leakage is confirmed
Situation4 When the motion detection frequency is below the set level Situation5 When the increase/decrease of temperature and humidity
exceeds the allowable range,
The sensor checks the presence or absence of operation or temperature and humidity at every 3 seconds and accumulates it in a warning message queue. It checks the message accumulated in the queue once a minute by using Linux Crontab and sends it to the user by text message.
4‐6 Support of web pages dedicated to the mobile environment
This study designed web pages dynamically to support not only the pages operated in the browser environment of the desktop but also the mobile environment. Therefore, it is possible to monitor whether the temperature and humidity are detected remotely even in a situation where the PC cannot be used, such as outdoors or moving. When a warning message is sent from a web page for PC, the user can immediately check the graph on the Smartphone in the place where the message is received.
Ⅴ. Conclusion
This study designed and implemented a monitoring system for the elderly living alone using the Raspberry Pi sensor, which is inexpensive but has excellent performance. It is designed to be able to monitor the temperature, humidity, leakage, or motion detection remotely. It also includes a function to send a warning message to the guardian when dangerous situation data is detected. This study also added the function to know trends by day/month/year by using additionally collected data. Since the warning situation is considered not only the temperature and humidity but also the rate of change, it is possible to preemptively respond to the situation by enabling more precise and various detection of abnormal situation. This system can monitor with smart phones anytime and anywhere by providing web pages considering the mobile environment.
The application area of this study is beyond the monitoring system for the elderly living alone and it can be used in various areas related to temperature and humidity in the future. For example, it could be applied to cultivation of ginseng and storage of goods, which is an agricultural field sensitive to the temperature and humidity. In addition, it is expected to be useful not only for the elderly but also for those children who are sensitive to temperature and humidity and susceptible to cold because they require continuous monitoring and monitoring of motion detection. However, if the danger is recognized in a remote site, the system does not include the function of controlling the temperature and humidity leaks by oneself, so
future studies are to be conducted so that the system will be upgraded.
References