콩 재배 화산회토양에서 질소시비 수준 및 강우, 온도 환경 변화에 따른 아산화질소 배출 특성
양상호*·강호준·이신찬·오한준·김건엽1 제주특별자치도농업기술원, 1농촌진흥청 국립농업과학원
Influence of N Fertilization Level, Rainfall, and Temperature on the Emission of N
2O in the Jeju Black Volcanic Ash Soil with Soybean Cultivation
Sang-Ho Yang*, Ho-Jun Kang, Shin-Chan Lee, Han-Jun Oh, and Gun-Yeob Kim1 Jeju Special Self-governing Province Agricultural Research and Extension Services, Seogwipo 697-800, Korea
1National Academy of Agricultural Science, RDA, Suwon, 441-707, Korea
This study was conducted to investigate the characteristic factors which have been influenced on nitrous oxide (N2O) emissions related to the environment change of nitrogen application level, rainfall and temperature during the soybean cultivation at black volcanic ash soil from 2010 to 2011. During the soybean cultivation, the more amount of nitrogen fertilizer applied, N2O emissions amounts were released much. N2O emissions with the cultivation time were released much at the first and middle of cultivation with heavy rainfall, but it was released very low until the end of cultivation and drought season. N2O emissions mainly were influenced by the rainfall and soil water content. The correlation (r) with N2O emissions, soil water, soil temperature and soil EC in 2010 were very significant at 0.4591**, 0.6312** and 0.3691** respectively. In 2011, soil water was very significant at 0.4821**, but soil temperature and soil EC were not significant at 0.1646 and 0.1543 respectively. Also, NO3-N and soil nitrogen (NO3-N + NH4-N) were very significant at 0.6902** and 0.6277* respectively, but NH4-N was not significant at 0.1775. During the soybean cultivation, the average emissions factor of 2 years released by the nitrogen fertilizer application was presumed to be 0.0202 (N2O-N kg N-1 kg-1). This factor was higher about 2.8 and 2 times than the Japan’s (0.0073 N2O-N kg N-1 kg-1) value and 2006 IPCC guideline default value (0.0100 N2O-N kg N-1 kg-1) respectively.
Key words: Jeju black volcanic ash soil, soybean cultivation, N2O emissions
접수 : 2012. 3. 9 수리 : 2012. 6. 21
*연락저자 : Phone: +82647607332 E-mail: [email protected]
서 언
최근 농업분야에서도 온실가스 저감기술 개발 등 기후변 화에 효율적으로 대응하기 위하여 온실가스 배출량 평가에 대한 연구에 큰 관심이 되고 있다. 농업부문에서 배출되는 주요 온실가스는 메탄 (CH4)과 아산화질소 (N2O)이다. 농경 지 토양에서의 N2O는 주로 화학비료, 축산분뇨 및 질소 고 정작물 등의 질소공급원에 의해 배출된다 (GPG, 2000;
IPCC, 1996; Moiser et al., 1998).
농경지에 시용한 질소비료 절반은 무기태질소의 형태로 유실되고, 대기로 배출되는 N2O는 81%가 질소비료 시용에
의해 배출된다고 하였으며 (Iserman, 1994), Bouwman (1990) 은 약 70%가 토양에서 배출된다고 하였다. Minami (1997) 는 농경지에서 대기로 배출되는 N2O는 질소비료에 가장 큰 영향을 받는다고 하였고, Houghton and Skole (1990)은 토 양환경 변화가 대기 중 N2O 증가에 많은 영향을 미친다고 하였다. 농경지 토양에서의 N2O 배출은 온도, pH, 강우, 비 료 시용량, 경작방법, 토성, 산소농도, 식생, 경지이용 등 여러 요인에 의해 영향을 받는다 (Freney, 1997). 제주지역 의 화산회 토양은 약 70% 이상을 차지하며 미사질양토가 대 부분으로 유기물 (7~25%) 함량이 높아 가볍고 대공극이 많 아 물빠짐이 양호한 토양이다. 이러한 특성으로 인하여 화 산회 토양에서는 지하부로의 질소 용탈이 많아 아산화질소 발생이 육지부의 토양 (유기물 3%이하)에 비해 적어질 것으 로 생각된다. 특히, 비료 시용량은 N2O 배출에 가장 큰 영 향을 미치며, 농경지에 투입된 질소는 질소순환 과정을 통
Table 1. Chemical properties of soil used.
Year pH O.M. NO3-N NH4-N Avail. P2O5
Exch. Cation
K Ca Mg
(1:5) g kg-1 --- mg kg-1 --- --- cmolc kg-1 ---
2010 5.7 163.8 10.6 26.7 26.9 0.2 3.6 1.0
2011 5.7 142.6 23.6 29.5 39.8 0.4 3.1 0.8
*O.M. : organic mater, Avail. : available phosphate(P2O5), Exch. : exchangeable cation.
해 N2O로 직접 배출된다 (Smith et al., 1997). N2O 배출은 토양수분을 조절하여 줄일 수 있으며, 대기온도에 따른 토 양온도 변화에도 N2O 배출에 영향을 받는다고 하였다 (Frolking et al., 1998; Parton et al., 1996). N2O 배출량과 토양수분 함량과의 관계에서 토양공극에 대한 용적수분 함 량 비율이 70~90%에서 탈질이 가장 많이 일어나며, 90%
이상에서는 N2O 배출량이 급격히 감소한다고 하였다 (Lemke et al., 1998; Wagner-Riddle et al., 1997). 또한, 토양의 무기태 질소 가운데 NO3-N의 증가가 N2O 배출을 증가시킨 다고 하였다 (Hellebrand et al., 2008). 호기 조건의 건조 토양은 미생물에 의해 질산화작용이 촉진되고, 상대적으로 습한 토양에서는 탈질현상으로 N2O의 발생이 증가한다 (Davidson, 1991).
온실가스 배출량을 정확히 평가하기 위해서는 배출계수 가 필요하다. IPCC (Intergovernmental Panel on Climate Change)에서는 2006년 가이드라인에 0.0100 kg N2O-N N-1 kg-1를 default 값으로 제시하고 있다. 그러나 이 값은 각 국가의 토양이나 기후 조건 등을 모두 반영하지 못하기 때 문에 IPCC에서는 자국의 환경에 맞는 국가 배출계수를 개 발하여 정확한 온실가스 배출량을 산정하도록 권고하고 있다.
따라서 본 연구에서는 콩 재배 화산회 토양에서 질소시 비 수준 및 강우, 온도 환경 변화에 따른 N2O 배출량을 측 정하고 배출에 영향을 미치는 요인을 분석하여 온실가스 배 출량 산정에 필요한 기초 자료를 제공하고자 하였다.
재료 및 방법
본 시험은 토양의 수분, 온도, EC 및 무기태질소가 밭토 양 N2O 배출에 미치는 영향을 살펴보기 위하여 제주특별자 치도 서귀포시 강정동에 위치한 농업기술원 시험포장에서 2년간 (2010~2011년) 수행하였다.
시험 토양은 흑색 화산회 토양인 미사질양토로서 이화학 적 특성은 Table 1과 같았다.
콩(신화)은 6월 15일 (’10)과 6월 9일 (’11)에 비료를 시비 하고 관리기로 경운한 후 재식거리를 60 cm (휴폭) × 10 cm(파폭)로 하여 5 cm 깊이로 2립씩 줄 파종 하였고, 수확 은 10월 18일 (’10)과 10월 10일 (’11)에 하였다. 시험구 면적 은 20 m2로 하여 시험구 처리를 무비구, 표준시비구, 표준
시비 2배구의 3처리 단구제로 하였다. 시비는 제주지역 주 요작물 표준재배법의 표준시비량을 기준으로 하여 3요소를 무비구는 N-P2O5-K2O : 0-0-0 kg ha-1, 표준시비구는 N-P2O5-K2O : 80-120-50 kg ha-1, 표준시비 2배구는 N-P2O5-K2O : 160-240-100 kg ha-1을 시용하였다. 질소 는 요소를 2회 분시하였고, 추비는 8월 2일 (’10)과 7월 22 일 (’11)에 1회 하였다. 인산은 용성인비, 칼리는 염화칼리로 전량 기비하였다.
강우량은 농업기술원 야외에 설치된 자동기상측정장비 (CR1000, Campbell)에서 측정되는 일별 자료를 이용하였 다. 토양의 화학성은 파종에서 부터 수확기까지 15일 간격 으로 토양 시료를 채취하여 풍건 후 2 mm 체를 통과시켜 농촌진흥청 토양화학분석법 (NIAST, 2000)에 준하여 분석 하였다. pH (1:5)는 초자전극법, 유기물은 Turin법, 유효인 산은 Lancaster법, 치환성 양이온은 1N NH4OAC (pH 7.0) 용액으로 침출하여 유도결합플라즈마방출분광기 (Optima 7300DV, Perkin Elmer)로 분석하였다. NO3-N는 증류수로 침출하여 이온크로마토그래피 (850 professional, Metrohm), NH4-N는 2 mol KCl로 침출하여 자외선/가시선 분광광도계 (Cary 100, Varian)로 분석하였다. 토양의 수분, 온도, EC 측정 은 유전율식센서 (WT1000B, Mirae Sensor)를 N2O 포집 챔버 내에 표면에서 직각으로 꼽고 (토심 0~10 cm, 평균 5 cm) 데이터로거 (WP700, Mirae Sensor)를 이용하여 30분 간격 으로 자동 측정하였다. N2O 포집 및 측정은 포집 챔버와 비 분산적외선 (Non Dispersive Infrared) 방식인 Gas Filter Corrrelation N2O Analyzer (320EU, Teledyne)를 연동시켜 자동화 하여 3일에 1회 오전 10:00~11:30 사이에 시험구 처리별로 30분 간격으로 포집 및 측정 되도록 하였다. N2O 포집은 비정체형, 밀폐형태인 순환형 상자법 (Denmead, 1979)을 이용하였다. 지름이 0.45 m, 높이가 0.35 m인 아크릴 소재로 제작된 자동챔버를 시험포장에 설치하고 외부와의 공기를 차단하여 밀폐상태로 포집되도록 하였다. 챔버에서 포집되는 N2O를 880 ml min-1의 흐름 속도로 측정기에 순 환되도록 하였고, 챔버 내 한가운데에 온도 보상선 (Thermocouple) 을 설치하여 측정기와 연결되도록 하였다.
측정 시작 후 챔버를 오픈하여 6분 후의 초기 N2O 농도와 챔버 내 온도를 측정한 후 챔버를 밀폐시켜 24분 후의 후기 N2O 농도와 챔버 내 온도를 측정되도록 하였다. N2O 배출
2010
0 6 12 18 24 30
16 1 10 19 1 10 19 1 10 19 1 10 19 1 10 19 1 10 1925
Jun. Jul. Aug. Sept. Oct. Nov. Dec.
Day / Month
Daily N2O emission, mg m-2 day-1 N 0 kg ha-1
N 80 kg ha-1 N 160 kg ha-1
Additional fertilizer ha- 1
ha- 1 ha- 1 N 0 kg ha-1 N 80 kg ha-1 N 160 kg ha-1
2011
0 7 14 21 28 35
10 19 1 10 19 1 10 19 1 10 19 1 10 19 1 10 19 1 10 19
Jun. Jul. Aug. Sept. Oct. Nov. Dec.
Day / Month Daily N2O emission mg m-2 day-1
N 0 kg ha-1 N 80 kg ha-1 N 160 kg ha-1
Adiitional fertilizer ha- 1
ha- 1 ha- 1 N 0 kg ha-1 N 80 kg ha-1 N 160 kg ha-1
Fig. 1. Changes of N2O emissions to the amount of nitrogen fertilizer applied in the soybean cultivation field.
Table 2. Accumulated emission amount of N2O for the soybean cultivation period in the field.
Year Nitrogen application amount (N kg ha-1)
0 80 160
--- kg N2O ha-1 year-1 ---
2010 0.266 3.511 7.007
2011 1.148 3.115 6.474
Average 0.707 3.313 6.741
량은 ’10년도에는 6월 16일~12월 25일, ’11년도에는 6월 10 일~12월 28일 까지 측정하였다.
N2O의 단위시간당 배출량은 다음 식에 따라 계산하였다.
F = ρ ․ 273 ․ (273+(처음온도+나중온도) ․ 2-1)-1․ H․ ∆C h-1 1000-1
F : 단위시간당 배출량 (mg m-2 hr-1) ρ : 가스밀도 (mg m-3)
N2O의 ρ값 (T=273 K)은 다음과 같다.
ρN2O = 1.96, ρN2O-N = 1.25
H : 상자내 수면으로(또는 토양표면)부터 상자 위쪽 끝부분까지의 높이
∆C : 시료 채취 전후의 농도 차(ppb) h : 시료 채취 시간
N2O의 배출계수(Emission factor)는 다음 식에 따라 계산 하였다.
EF (kg N2O-N / N kg) = ((누적배출량/100)×0.9×(28/44))/N
누적배출량 : 연간 N2O 누적배출량 (kg N2O ha-1 year-1) N2O-N 환산계수 : 28/44 (N2/N2O)
N : 질소시비량 (kg N ha-1)
화학비료로 공급된 질소량 : 시비 N × 0.9
N2O 배출에 대한 상관분석은 SAS를 이용하여 분석하였다.
결과 및 고찰
콩 재배기간 동안 질소시비량에 따른 N2O 배출 변화 및 연간 누적 배출량은 Fig. 1과 Tabe 2와 같다. ’10년과 ’11년 도의 N2O 연간 누적 배출량은 무비구 0 kg ha-1는 0.266과
2010
0 30 60 90 120 150
20 1 10 20 1 10 20 1 10 20 1 10 20 1 10 20 1 10 2026
Jun. Jul. Aug. Sept. Oct. Nov. Dec.
Day / Month
Rainfall, mm
0 6 12 18 24 30
N2O, mg m-2 day-1
Rainfall N2O emission Additional fertilizer
N2O
2011
0 30 60 90 120 150
10 20 1 10 20 1 10 20 1 10 20 1 10 20 1 10 20 1 10 20
Jun. Jul. Aug. Sept. Oct. Nov. Dec.
Day / Month
Rainfall, mm
0 7 14 21 28 35
N2O, mg m-2 day-1
Rainfall N2O emissionN2O Additional fertilizer
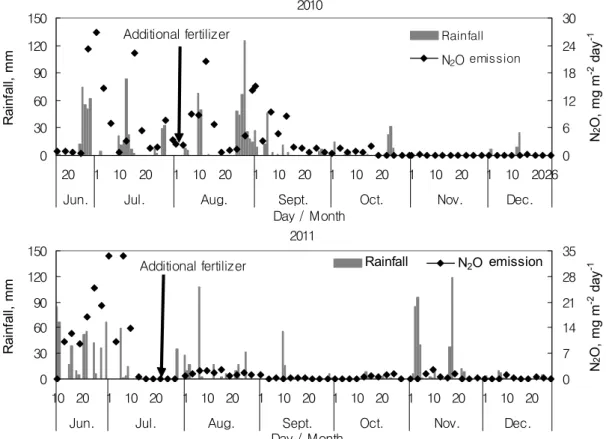
Fig. 2. Changes of N2O emissions as affected by rainfall in the soybean cultivation field.
1.148 kg N2O ha-1 year-1, 표준시비구 80 kg ha-1는 3.511과 3.115 kg N2O ha-1 year-1, 표준시비 2배구 160 kg ha-1는 7.007과 6.474 kg N2O ha-1 year-1로 질소시비량이 많을수 록 높았다. 토양 중 질소 시비량의 증가에 따라 N2O 배출량 도 동시에 증가하며, 토양 중의 무기태 질소인 NO3-N의 증 가가 N2O 배출을 증가시킨다고 하였다 (Hellebrand et al., 2008). 콩 재배 기간 동안 N2O는 ’10년도의 경우 6월 하순부 터 9월 상순, ’11년도의 경우에는 6월 중순부터 7월 상순에 대부분 배출되는 것으로 나타났다. N2O 배출량은 고추 재배 기간 (6~8월) 중 토양수분, 토양온도의 변화와 유사한 양 상을 보였고, 몬순기후의 영향으로 강우량이 집중되는 기간 으로 대기온도와 토양수분의 증가로 모든 처리구에서 N2O 배출량이 높았다고 하였다 (Kim et al., 2008). 본 연구에서 도 강우량이 집중되는 6월 중순부터 9월 상순에 N2O 배출 량이 높았다. 이는 강우량이 집중되는 기간에 토양온도와 토양수분이 증가함에 따라 질소비료의 탈질 현상이 활발히 일어나기 때문에 N2O 발생이 증가하는 것으로 생각된다.
자연 강우에 따른 N2O 배출량의 변화는 Fig. 2와 같다.
콩 재배기간 동안 강우는 여름철인 6월 중순부터 9월 상순 에 집중되었으나, 가을과 겨울철인 9월 중순~12월에는 강 우가 적거나 한발 현상이 나타났다. 콩 재배기간 동안 N2O 배출 양상은 강우량 패턴과 비슷한 경향을 보였다. N2O 배 출량은 재배 초기와 중기에는 강우가 많은 시기로서 ’10년 도에는 6월 중순부터 9월 상순, ’11년도에는 6월 중순부터 7
월 상순에 많았다. 재배 말기에는 강우가 적고 한발 시기로 서 N2O 배출량이 매우 적거나 거의 없는 경향을 보였다.
Davidson (1991)은 호기 조건의 건조 토양은 미생물에 의해 질산화 작용이 촉진되고, 상대적으로 습한 토양에서는 탈질 현상으로 N2O 발생이 증가한다고 하였다. 본 연구에서도 강 우량이 많고 토양이 습한 시기에 N2O 배출이 많은 것으로 나타났다. 연도별 N2O 배출 양상이 다소 다르게 나타나는 것은 재배 시기와 강우 패턴에 따라 토양수분상태가 다르기 때문인 것으로 생각된다. 또한, N2O 포집 및 측정은 강우일 을 고려하지 않고 일정 주기 (3일 간격)로 하였으므로 일 강 우 패턴을 모두 반영하지는 못했기 때문인 것으로 생각된다.
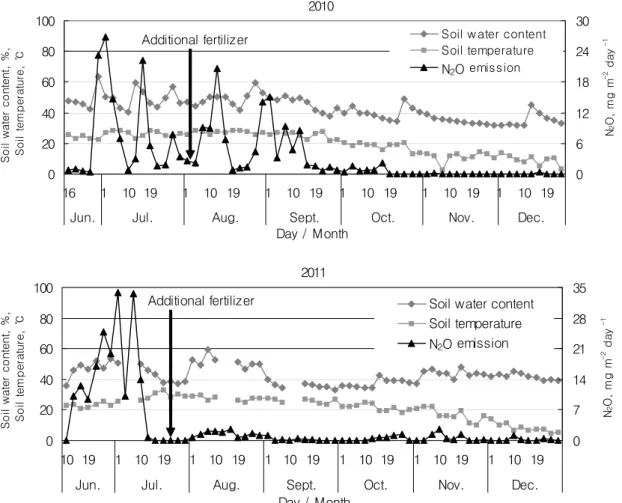
토양수분, 토양온도에 따른 N2O 배출량의 변화는 Fig. 3 과 같다. 콩 재배기간 동안 토양수분함량 범위는 ’10년 31.
5~63.4%, ’11년 33.0~59.2%, 토양온도 범위는 ’10년 2.
5~28.8℃, ’11년 4.7~33.0℃로 나타났다. N2O 배출 양상 은 토양수분함량 변화와 대체로 유사한 경향이었다. 그러나 토양온도 변화와는 ’10년도에는 대체로 유사한 경향을 보였 으나, ’11년도에는 유사한 경향을 보이지는 않았다. N2O 배 출은 토양수분함량이 건조 시작 단계인 40% (100 kPa) 이상 에서는 증가하였으나, 그 이하에서는 매우 적거나 감소하는 경향을 보였다. Kim et al. (2010)은 토양수분 (Stevens et al., 1997; Arnone and Bohlen, 1998; Hou et al., 2000)과 토양온도 (Gödde and Conrad, 1999)의 변화에 따라 N2O 배 출량의 양상이 비슷하다는 결과와 일치하였다. 본 연구에서
2010
0 20 40 60 80 100
16 1 10 19 1 10 19 1 10 19 1 10 19 1 10 19 1 10 19
Jun. Jul. Aug. Sept. Oct. Nov. Dec.
Day / Month Soil water content, %, Soil temperature, ℃
0 6 12 18 24 30
N2O, mg m-2 day-1
Soil w ater content Soil temperature N2O emission Additional fertilizer
N2O
2011
0 20 40 60 80 100
10 19 1 10 19 1 10 19 1 10 19 1 10 19 1 10 19 1 10 19
Jun. Jul. Aug. Sept. Oct. Nov. Dec.
Day / Month Soil water content, %, Soil temperature, ℃
0 7 14 21 28 35
N2O, mg m-2 day-1
Soil water content Soil temperature N2O emission Additional fertilizer
N2O
Fig. 3. Changes of N2O emissions with different soil water contents and soil temperature in the soybean cultivation field.
는 N2O 배출 양상은 토양수분 변화와는 일치하는 경향을 보 였으나, 토양온도 변화와는 반드시 일치하지는 않았다.
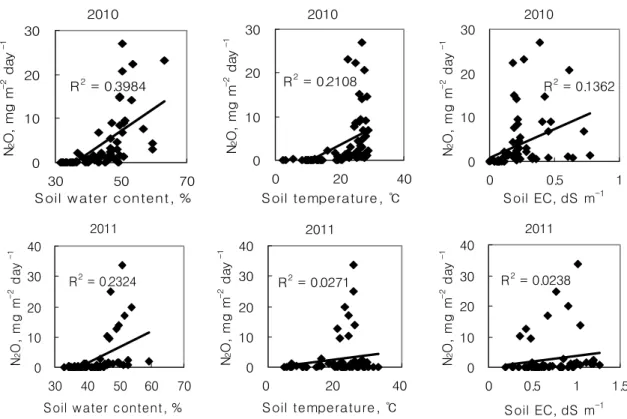
N2O 배출량과 토양수분, 토양온도 및 토양 EC와의 상관 관계는 Fig. 4와 같으며, 상관 (r)에 대한 유의성을 분석한 결과 (Table 3), ’10년도에는 각각 0.6312**, 0.4591**, 0.3691**
로 모두 고도로 유의성이 있었다. ’11년도에는 각각 0.4821**, 0.1646, 0.1543으로 토양수분과는 고도로 유의성이 있었으 나, 토양온도와 토양 EC와는 유의성은 없었다. Kim et al.
(2010)은 토양온도, 토양수분, 무기태질소가 N2O 배출량과 의 상관관계에서 고도로 유의하여 N2O 배출에 가장 큰 영향 을 주는 것으로 나타났다고 하였다. Arone and Bohlen (1998)은 N2O 배출량과 토양수분 함량과는 정의상관 관계가 있다고 하였으며, Dobbie et al. (1999)은 기후 차이에 관계 없이 N2O 배출량은 토양수분과 밀접한 관계가 있다고 하였 다. 본 연구에서는 토양수분이 ’10년과 ’11년 모두 N2O 배출 량과 유의성이 인정되어 N2O 배출에 가장 큰 영향을 미치는 것으로 나타났다.
2011년도 N2O 배출량과 토양 질소와의 상관관계는 Fig. 5 와 같으며, 상관 (r)에 대한 유의성을 분석한 결과(Table 4), N2O 배출량은 NO3-N과 토양 질소 (NO3-N + NH4-N)와는
각각 0.6902**와 0.6277*로 유의성이 인정되었으나, NH4-N 과는 0.1775로 유의성은 인정되지 않았다. 토양 중 질소 시 비량의 증가에 따라 토양 중 N2O 배출량도 동시에 증가하 며, 토양 중 무기태 질소인 NH4+
에 의해 N2O 배출이 가장 크다고 하였다 (Månsson and Falkengren-Grerup, 2003;
Xu et al., 2004). 또한, 토양 중의 무기태 질소인 NO3-N의 상승이 N2O 배출을 증가시킨다고 하였다 (Hellebrand et al., 2008). 호기 조건의 건조 토양은 미생물에 의해 질산화작용 이 촉진되고, 상대적으로 습한 토양에서는 탈질현상으로 N2O의 발생이 증가한다 (Davidson, 1991). 본 연구에서는 N2O 배출량은 대체로 토양 중의 질소함량이 많을수록 높았 으며, 특히 토양 질소 중 NO3-N과 고도로 유의하여 N2O 배 출에 가장 큰 영향을 미치는 것으로 나타났다. 이는 강우량 이 집중되는 기간 (6월 중순부터 9월 상순)에 토양온도와 토 양수분이 증가함에 따라 질소비료의 탈질 현상이 활발히 일 어나기 때문에 N2O 발생이 증가하는 것으로 생각된다.
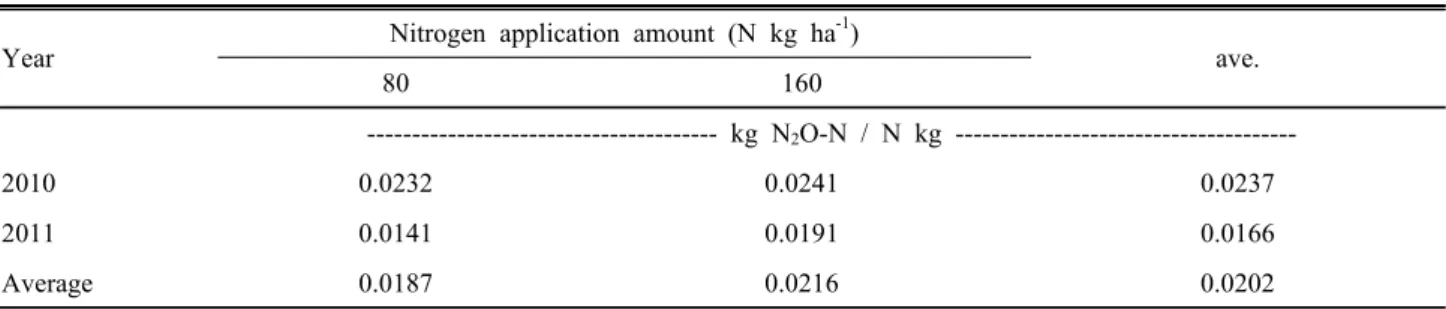
콩 재배기간 동안 질소시비량에 대한 배출계수는 Table 5 와 같다. 질소 표준시비구와 표준시비 2배구에 대한 배출계 수는 ’10년도에는 각각 0.0232와 0.0241 N2O-N kg / N kg,
’11년도에는 각각 0.0141과 0.0191 (N2O-N kg N-1 kg-1)으로
2010
R2 = 0.3984
0 10 20 30
30 50 70
Soil w ater content, % N2O, mg m-2 day-1
2010
R2 = 0.2108
0 10 20 30
0 20 40
Soil temperature, ℃ N2O, mg m-2 day-1
2010
R2 = 0.1362
0 10 20 30
0 0.5 1
Soil EC, dS m-1 N2O, mg m-2 day-1
2011
R2 = 0.2324
0 10 20 30 40
30 40 50 60 70 Soil water content, % N2O, mg m-2 day-1
2011
R2 = 0.0271
0 10 20 30 40
0 20 40
Soil temperature, ℃ N2O, mg m-2 day-1
2011
R2 = 0.0238
0 10 20 30 40
0 0.5 1 1.5
Soil EC, dS m-1 N2O, mg m-2 day-1
Fig. 4. Correlation of N2O emissions among soil water contents, soil temperature and soil EC in the soybean cultivation field.
Table 3. Correlation coefficient (r) of N2O emissions among soil water contents, soil temperature and soil EC in the soybean cultivation field.
Year Soil water contents Soil temperature Soil EC
2010 0.6312** 0.4591** 0.3691**
2011 0.4821** 0.1646 0.1543
*p<0.05, **p<0.01.
NO3-N
R2 = 0.4764
0 10 20 30
0 25 50 75 100
mg kg-1 N2O, mg m-2 day-1
NH4-N
R2 = 0.0315
0 10 20 30
0 20 40
mg kg-1 N2O, mg m-2 day-1
NO3-N + NH4-N
R2 = 0.394
0 10 20 30
0 30 60 90 120
mg kg-1 N2O, mg m-2 day-1
Fig. 5. Correlation of N2O emissions with soil nitrogen in the soybean cultivation field (2011). Soil was collected to 15 days interval from seeding to harvester.
Table 4. Correlation coefficient (r) of N2O emissions with soil nitrogen in the soybean cultivation field (2011).
Year NO3-N NH4-N NO3-N + NH4-N
2011 0.6902** 0.1775 0.6277*
*p<0.05, **p<0.01.
Table 5. Emission factor of N2O with different nitrogen application rates with the soybean cultivation.
Year Nitrogen application amount (N kg ha-1)
80 160 ave.
--- kg N2O-N / N kg ---
2010 0.0232 0.0241 0.0237
2011 0.0141 0.0191 0.0166
Average 0.0187 0.0216 0.0202
산출되었다. ’10년과 ’11년 2개년 평균 배출계수는 0.0202 (N2O-N kg N-1 kg-1)으로 일본의 0.0073 (N2O-N kg N-1 kg-1)보다 약 2.8배, IPCC의 기본계수 0.0100 (N2O-N kg N-1 kg-1)보다 2배 더 높았다 (IPCC, 2006). 이는 콩 파종일 인 6월 상~중순이 여름 장마기로서 재배 초기 2~3개월은 강우량이 많아 고온 다습하고 토양수분함량이 높아 배출계 수가 높은 것으로 생각된다.
이상과 같이 제주지역 화산회 토양에서 콩 재배 기간동 안 질소 시비량에 따른 N2O 배출양상 및 배출량은 재배 초 기와 중기에 토양수분이 많고 적음에 따라 크게 달라지는 것으로 나타났다. 그러므로 농경지에서 발생하는 온실가스 를 줄이기 위해서는 N2O 배출에 제일 크게 영향을 미치는 요인인 토양수분을 적절히 관리하거나, N2O 배출에 직접적 으로 관련이 있는 질소시비량을 토양검정에 의한 추천시비 를 통하여 적절히 조절함으로써 가능할 것으로 생각된다.
요 약
본 연구는 콩 재배 화산회 토양에서 질소시비 수준 및 강 우, 온도 환경 변화에 따른 N2O 배출량을 측정하고 배출에 영향을 미치는 요인 특성을 구명하기 위하여 제주특별자치도 농업기술원 시험포장에서 2년간 (2010~2011년) 수행되었다.
콩 재배기간 동안 N2O 배출량은 질소시비량이 많을수록 많았다. 재배시기별 N2O 배출량은 강우량이 많은 재배 초기 와 중기에 많았으나, 강우가 적고 한발 시기인 재배 말기에 는 매우 적거나 거의 없는 경향을 보였다. N2O 배출 양상은 강우량 및 토양수분함량 변화와 대체로 유사한 경향을 보였 다. N2O 배출량과 상관관계(r)를 분석한 결과, ’10년도에는 토양수분, 토양온도 및 토양 EC는 각각 0.6312**, 0.4591**, 0.3691**로 모두 고도로 유의성이 인정되었다. 그러나 ’11년 도의 경우는 토양수분과는 0.4821**로 고도로 유의성이 인 정되었으나, 토양온도와 토양 EC와는 각각 0.1646, 0.1543 로 유의성이 인정되지 않았다. NO3-N과 토양 질소 (NO3-N + NH4-N)와는 각각 0.6902**, 0.6277*로 유의성이 인정되 었으나, NH4-N과는 0.1775로 유의성은 인정되지 않았다.
질소 시비량에 따른 2년 동안의 N2O 배출량을 배출계수로
환산한 값은 0.0202 (N2O-N kg N-1 kg-1)로, 일본의 배출계 수인 0.0073 N2O-N kg N-1 kg-1보다는 약 2.8배, 2006 IPCC 가이드라인의 기본계수인 0.0100 N2O-N kg N-1 kg-1 보다는 약 2배 정도 높은 것으로 분석되었다.
사 사
본 연구는 농촌진흥청의 공동연구사업 (과제번호 : PJ006783062012)에서 연구비를 지원 받았습니다.
인 용 문 헌
Arone, J.A. and P.J. Bohlen. 1998. Stimulated N2O flux from intact grassland monoliths after two growing seasons under elevated atmospheric CO2. Oecologia. 116:331-335.
Bouwman, A.F. 1990. Exchange of greenhouse gases between terrestrial ecosystems and the atmosphere. p.
61-127. In; A.F. Bouwman (ed.) Soils and the greenhouse affect. John Wiley and Sons. New York.
Davidson, E.A. 1991. Fluxes of nixes of nitrous oxide and nitric oxide from terrestrial ecosystems. In: Microbial Production and Consumption of Greenhouse Gases:
Methane, Nitrous Oxide and Halomethanes (eds Rogers JE, Whitman WB), American Soc. of Microbiol., Washington, D.C. 219-235.
Denmead, O.T. 1979. Chamber systems for measuring nitrous oxide emission from soils in the field. Soil Soc. of America J. 43:89-95.
Dobbie, K.E., I.P. Mctagart, and K.A. Smith. 1999. Nitrous oxide emissions from intensive agricultural systems: variations between crop and seasons; key driving variables; and mean emission factors. J. Geophys. Rcs. 104:26891-26899.
Freney, J.R. 1997. Emission of nitrous oxide from soils used for agriculiture. Nutrient Cycling in Agroecosystems.
49:1-6.
Frolking, S.E., A.R. Mosier, and D.S. Ojima. 1998. Com- parison of N2O emissions from soils at three temperate agricultural sites: simulations of year-round measurements by four models. Nutrient Cycling in Agroecosystems.
52:77-105.
Gödde, M. and R. Conrad. 1999. Immediate and adapta- tional temperature effects on nitric oxide production and nitrous oxide release from nitrification and denitrification in tow soils. Biol. Fertil. Soils. 30:33-40.
Hellebrand, H.J., V. Scholz, and J. Kern. 2008. Fertilizer induced nitrous oxide emissions during energy crop culti- vation on loamy sand soils. Atmospheric Environment.
42:8403-8411.
Hou, A., H. Akiyama, Y. Nakajima, S. Sudo, and H. Tsuruta.
2000. Effects of urea form and soil moisture on N2O emissions from Japanese Andosols. Chemosphere - Global Change Science. 2:321-327.
Houghton, R.A. and D.L. Skole. 1990. Change in the global carbon cycle between 1700 and 1985. In: B.L. Turner. (ed.) The earth transformed by human action. Cambridge University Press.
IPCC. 1996. IPCC guideline for national greenhouse gas inventories.
IPCC. 2000. Good Practice Guideline and uncertainty management in national greenhouse gas inventories.
IPCC. 2006. IPCC guideline for national greenhouse gas inventories.
Iserman, K. 1994. Agriculture’s share in the emissions of trace gases affecting the climate and some cause oriented proposals for reducing this share. Environ. 83:95-111.
Kim, G.Y., B.H. Song, K.A. Roh, S.Y. Hong, B.G. Ko, K.M.
Shim, and K.H. So. 2008b. Evaluation of green house gases emissions according to changes of soil water content, Soil Temperature and Mineral N with Different Soil Texture in Pepper Cultivation. J. Soil Sci. Fert. Vol. 41(6):399-407 Kim, G.Y., K.H. So, H.C. Jeong, K.M. Shim, S.B. Lee, and
D.B. Lee. 2010. Evaluation of N2O emissions with changes of soil temperature, soil water content and mineral N in red pepper and soybean field. Korean J. Soil Sci. Fert. Vol.
43(6):880-885.
Lemke, R.L., R.C. Izaurralde, S.S. Malhi, M.A. Arshad, and M. Nyborg. 1998. Nitrous oxide emissions from agricultural
soils of the Boreal and Parkland regions of Alberta. Soil Sci. Soc. Am. J. 62:1096-1102.
Månsson, K.F, and U. Falkengren-Grerup. 2003. The effect of nitrogen deposition on nitrification, carbon and nitrogen mineralisation and litter C:N ratios in oak (Quercus robur L.) forests. Forest ecology and management. 179:455-467.
Minami, K. 1997. Mitigation of nitrous oxide emissions from fertilized soils. In: Proceedings if IGAC Symposium, Nagoya, Japan.
Moiser, A., C. Kroeze, C. Nevision, O. Oenema, S.
Seitzinger, and O. van Cleemput. 1998. Closing the global N2O budget: nitro oxide emissionf through the agricultural nitrogen cycle. Nutrient Cycling in Agroecosystems 52:225- 248.
NIAST. 2000. Methods of soil chemical analysis. National Institute of Agricultural Science and Technology, RDA, Suwon, Korea.
Parton, W.J., A.R. Mosier, D.O. Ojima, D.W. Valentine, D.S. Schimel, K. Weier, and A.E. Kulmala. 1996.
Generalized model for N2 and N2O production from nitrification and denitrification. Global Biochem. Cycles.
10:401-412.
Smith, K.A., I.P. McTaggart, and H. Tsuruta. 1997.
Emissions of N2O and NO associated with nitrogen fertilization in intensive agriculture and the potential for mitigation. Soil Use and Management. 13:296-304.
Stevens, R.J., R.J. Laughlin, L.C. Burns, J.R.M. Arah, and R,C, Hood. 1997. Measuring the contributions of nitrifi- cation and dentrification to the flux of nitrous oxide from soil. Soil. Biol. Biochem. 29:139-151.
Wagner-Riddle, C., G.W. Thurtell, G.E. Kidd, E.G.
Beauchamp, and R. Sweetman. 1997. Estimates of nitrous oxide emissions from agricultural fields over 28 months.
Can. J. Soil Sci. 77:135-144.
Xu, Z., H. Ouyang, G. Cao, Z. Pei, and C. Zhou. 2004.
Nitrogen deposition and carbon sequestration in alpine meadows. Biogeochemistry. 71:353-369.