ISSN 1225-1534 (Print) http://dx.doi.org/10.5303/PKAS.2012.27.4.339 Publications of the Korean Astronomical Society
27: 339 ∼ 341, 2012 September
° 2012. The Korean Astronomical Society. All Rights Reserved. c
RADIO EMISSION FROM AKARI GALAXIES
A. Pepiak
1, A. Solarz
2, A. Pollo
1,3, T. T. Takeuchi
2, W. Jurusik
1, and AKARI Team
1
Astronomical Observatory of the Jagiellonian University, Krak´ow, Poland
2
Department of Particle and Astrophysical Science, Nagoya University, Japan
3
National Centre for Nuclear Research, Warszawa, Poland E-mail: [email protected]
(Received July 08, 2012; Accepted August 15, 2012)
ABSTRACT
It is a long known fact that there exists a tight correlation between far-infrared and radio emission both for galaxies hosting active galactic nuclei and for star forming galaxies. We probe the radio - infrared correlation for a sample of extragalactic sources constructed by the cross-correlation of the AKARI/IRC All-Sky Survey Point Source Catalogue, the AKARI/FIS All-Sky Survey Bright Source Catalogue, and the NRAO VLA Sky Survey. Additionally, all objects of our sample were identified as galaxies in NED and SIMBAD databases, and a part of them is known to host active galactic nuclei (AGNs). After remeasuring all the fluxes, in order to avoid small aperture effects, we compare the ratio of radio to infrared emission from different types of extragalactic sources, and discuss the FIR/radio correlation as seen by AKARI and make a comparison to the previous results obtained thanks to IRAS.
Key words: infrared; radio; galaxies; FRC
1. INTRODUCTION
The radio and far-infrared (FIR) luminosities of galax- ies are approximately linearly correlated (e.g., Helou et al., 1985; Mauch & Sadler, 2007; Mori´c et al., 2010).
The far-infrared – radio correlation (FRC) is one of the most universal empirical correlations known among the global parameters of observed galaxies. It spans a wide range of galaxy types and seems to be valid both for the local and the distant universe. Presently FRC is believed to be driven mostly by star formation.
However, the infrared and radio emission mechanisms in star forming galaxies involve very different physical processes and timescales. Moreover, the correlation is also observed for AGN-hosting galaxies. Hence, it is not yet established if the FRC is related only to star formation activity, or maybe some other processes are involved.
This paper presents some preliminary results of studies of the FRC for nearby galaxies (z ∼ < 0.2) based on far-infrared data from the AKARI All-Sky Survey
and radio data from the NRAO VLA Sky Survey.
2. SAMPLE SELECTION
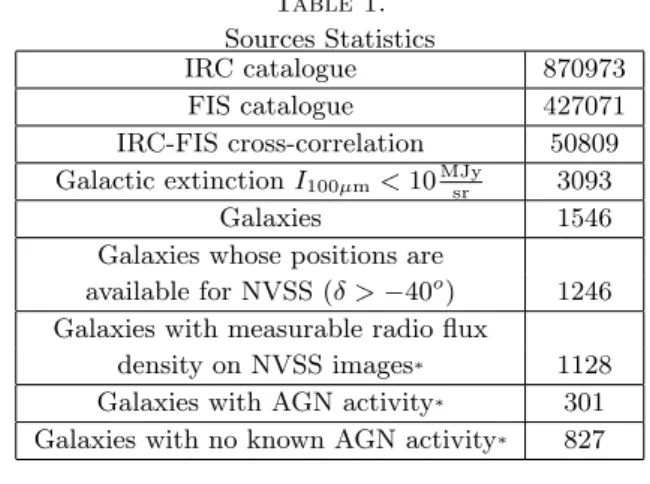
The galaxy sample (Table 1) selection was made through a multi-step proceedure. The particular steps are described below.
1. Cross-correlation of two AKARI all-sky cata- logues: AKARI IRC All-Sky Survey Point Source Catalogue (mid-infrared bands: 9 and 18 µm) and AKARI FIS All-Sky Survey Bright Source Catalogue (FIR bands: 65, 90, 140, and 160 µm) with search radius of 15
00;
2. Constraints for extinction: maps of the Galac- tic cirrus emission at 100 µm were used to reject sources from the Galactic plane and Magellanic Clouds (low 100 µm emissivity:
I
100µm< 10
MJysr);
http://pkas.kas.org 339
340 PEPIAK ET AL.
Table 1.
Sources Statistics
IRC catalogue 870973
FIS catalogue 427071
IRC-FIS cross-correlation 50809 Galactic extinction I
100µm< 10
MJysr3093
Galaxies 1546
Galaxies whose positions are
available for NVSS (δ > −40
o) 1246 Galaxies with measurable radio flux
density on NVSS images
*1128 Galaxies with AGN activity
*301 Galaxies with no known AGN activity
*827
∗ - with redshift information available Table 2.
q Parameter
Mean Dispersion Whole sample < q >= 2.23 0.44
AGNs < q
AGN>= 2.04 0.65
’Normal’ galaxies < q
SF>= 2.30 0.31
3. Identification and selection of galaxies: informa- tion from NED and SIMBAD databases and op- tical images from Digital Sky Survey (DSS) were used to select the sample of galaxies;
4. Radio fluxes measurements: 1.4 GHz NRAO VLA Sky Survey (NVSS) continuum total inten- sity images were used to carry out measurements of radio fluxes at the level of 3σ brightness fluc- tuations of the images (σ ∼ 45 mJy);
5. Additionally: ancillary information was collected (types, morphology, redshifts and photometry in various wavelengths).
3. PRELIMINARY RESULTS
Our results based on AKARI FIS WIDE-L band (cen- tered at 90 µm) and NVSS data are shown in Fig. 1.
The FRC can be quantified by its slope:
q =log
³
SF IRSrad