https://kshpa.jams.or.kr/co/main/jmMain.kci 217
보건행정학회지 2021;31(2):217-224 | ISSN 1225-4266Health Policy and Management Vol.31 No.2, 217-224
https://doi.org/10.4332/KJHPA.2021.31.2.217
DATA OBSERVATION
서 론
우리나라는 국민의 건강을 위한 다양한 보건의료정책을 실행하고 있다. 그러나 초고령화, 저출산, 저성장, 기술 발전 등 급격한 변화 및 수요 증가와 더불어 코로나19로 인해 앞으로의 상황을 예측하기가 더 욱 어려운 실정이다. 특히 한국뿐 아니라 전 세계 국가들의 현 보건의 료체계 지속 가능성에 대해 다양한 문제가 제기되었고, 포스트 코로 나19 시대에 맞는 변화의 필요성이 커지게 되었다[1,2]. 이와 같은 변 화의 흐름은 정책 창문(political window)이 열리는 기회를 불러올 수 있다. 정책 창문이 열렸을 때 정책문제의 정책화를 위해서는 문제를 정의하고 대안이 준비되어 있어야 한다[3]. 하지만 단기적 및 중장기 적으로 개선이 필요한 보건의료분야 문제와 이슈는 매우 다양하고 많
기 때문에, 한정된 자원으로 모든 문제를 해결하고 보건의료체계의 지속 가능성을 강화하기에는 현실적으로 제약이 따르기 마련이다.
따라서 자원의 효율적 배분과 분배의 형평성을 고려한 우선순위 결정 은 불가피하다.
보건의료문제를 정의하고 정책적 우선순위 결정을 위해서는 먼저 현재 상태에 대한 진단이 이뤄져야 한다. 우리나라 상태를 진단하는 방법 중 하나는 다른 국가들과의 비교를 통해 한국 보건의료문제들의 크기를 측정하고 위치를 파악하는 것이다. 따라서 이 연구에서는 보 건의료정책 모형의 보건의료 수요, 공급, 의료 접근도, 의료 질, 의료 비 총 5개 보건의료영역에 대한 정책문제를 살펴보고자 한다[3].
Position value for relative comparison (PARC) 지표를 통해 경제협력개 발기구(Organization for Economic Cooperation and Development, OECD) 국가들과 비교 진단하고, 추이를 파악하여 보건의료정책 수
2018년 한국 보건의료의 상대적 위치와 추이:
경제협력개발기구 국가와 비교
윤흰뫼1,2·이현지 ,2·박은철2,3
1연세대학교 대학원 보건학과, 2연세대학교 보건정책 및 관리연구소, 3연세대학교 의과대학 예방의학교실
Position Value for Relative Comparison of Healthcare Status of Korea in 2018
Hin Moi Youn
1,2, Hyeon Ji Lee
1,2, Eun-Cheol Park
2,31Department of Public Health, Yonsei University Graduate School; 2Institute of Health Services Research, Yonsei University; 3Department of Preventive Medicine, Yonsei University College of Medicine, Seoul, Korea
The objective of this study is to investigate the healthcare status of South Korea and other member countries of the Organization for Economic Cooperation and Development (OECD) using OECD health statistics 2020. We employed the position value for relative comparison index to measure the healthcare status in five following components: demand, supply, accessibility, quality, and cost. The Mann-Kendall test was used to analyze for increasing or decreasing trend of the position value for relative comparison values from 2000 to the recent year. Results showed that Korea was positioned above than the OECD median values in most of components, but lower than the median values in certain indices including healthcare employment, primary care, and mental health care. This study sheds some light on healthcare issues to be improved and the policy-makes can take into account for prior setting process.
Keywords: Healthcare systems; Health policy; Priority setting in public health; Position value for relative comparison; Health statistics; Organization for Economic Cooperation and Development
Correspondence to: Eun-Cheol Park
Department of Preventive Medicine and Institute of Health Services Research, Yonsei University College of Medicine, 50-1 Yonsei-ro, Seodaemun-gu, Seoul 03722, Korea
Tel: +82-2-2228-1862, Fax: +82-2-392-8133, E-mail: [email protected]
Received: February 1, 2021, Revised: March 11, 2021, Accepted after revision: March 18, 2021
© Korean Academy of Health Policy and Management
◯
㏄This is an open-access article distributed under the terms of the Creative Commons Attribution Non-Commercial License (http://creativecommons.org/licenses/by-nc/4.0) which permits unrestricted non-commercial use,
distribution, and reproduction in any medium, provided the original work is properly cited.
Youn HM et al ∙ Position Value for Relative Comparison of Healthcare Status of Korea in 2018: Comparison with the OECD
립을 위한 자료를 제공하고자 한다[4].
방 법
1. 자료원 및 보건의료 지표
이 연구에서는 OECD가 가장 최근에 업데이트한 “보건통계(health statistics) 2020”을 사용하였다. OECD 보건통계는 건강수준, 건강위 험요인, 보건의료자원, 보건의료이용 등 다양한 항목으로 구성되어 있으며, 국가의 보건의료수준 및 제도현황을 잘 보여준다[5]. OECD 국가들과 보건의료문제의 위치를 비교 진단하기 위해 수요(건강수 준, 건강결정요인), 공급(인력, 시설, 장비), 접근성(예방, 검진, 의료이 용), 보건의료 질(일차의료, 급성기 진료, 암 치료, 정신보건 진료, 환 자안전, 환자경험), 보건의료비용(1인당 의료비, 국내총생산[gross domestic product, GDP] 대비 경상의료비)에 대해 세부지표를 선정 하여 분석하였다. 각 지표는 2000년부터 2018년까지 자료를 활용하 였다(Tables 1, 2).
2. 보건의료수준 진단도구
우리나라의 보건의료수준을 진단하기 위해 PARC을 사용하였다 [6-9]. PARC는 다른 국가들과 비교하여 우리나라의 상대적 위치를 파악할 수 있는 객관화된 지표이다. PARC 값은 -1부터 1 사이이며, OECD 국가들과 비교하여 가장 좋으면(많으면) 1, 평균이면 0, 가장 나쁘면(적으면) -1에 위치한다. 즉 -1에 가까울수록 우리나라의 보건 의료수준이 OECD 국가들의 중앙값보다 낮은 상태이고, 반면 1에 가 까울수록 중앙값보다 높은 상태임을 의미한다. PARC는 사망률, 흡연 율 등 뚜렷하게 지표가 작을수록 좋은 경우와 그 외에 지표가 클수록 좋은 경우, OECD 국가 중앙값보다 우리나라 값이 높은 경우와 낮은 경우에 따라 다음과 같이 계산 공식의 구분이 있다.
- 지표가 높을수록 좋은 경우,
OECD 국가 중앙값보다 우리나라의 값이 높은 경우
P ARC
K or ea
V alue
V alue
V alue
V alue
OECD 국가 중앙값보다 우리나라의 값이 낮은 경우
- 지표가 낮을수록 좋은 경우,
OECD 국가 중앙값보다 우리나라의 값이 높은 경우
P ARC
K or ea
V alue
V alue
V alue
V alue
OECD 국가 중앙값보다 우리나라의 값이 낮은 경우
P ARC
K or ea
V alue
V alue
V alue
V alue
3. 통계 분석
2000년부터 2018년(또는 가장 최근)까지 산출된 PARC의 경향을 분석하기 위해 시계열자료의 경향성 분석방법인 Mann-Kendall 검정 을 시행하였다[10]. Mann-Kendall 검정은 관측치들 간의 상관 측정 치를 통해 상향 또는 하향의 단조적 추세를 측정하는 방법으로, 추세 의 방향과 크기는 Kendall’s Tau-b 상관계수로 제시하였다. 분석은 SAS ver. 9.4 (SAS Institute Inc., Cary, NC, USA)를 사용하였다.
결 과
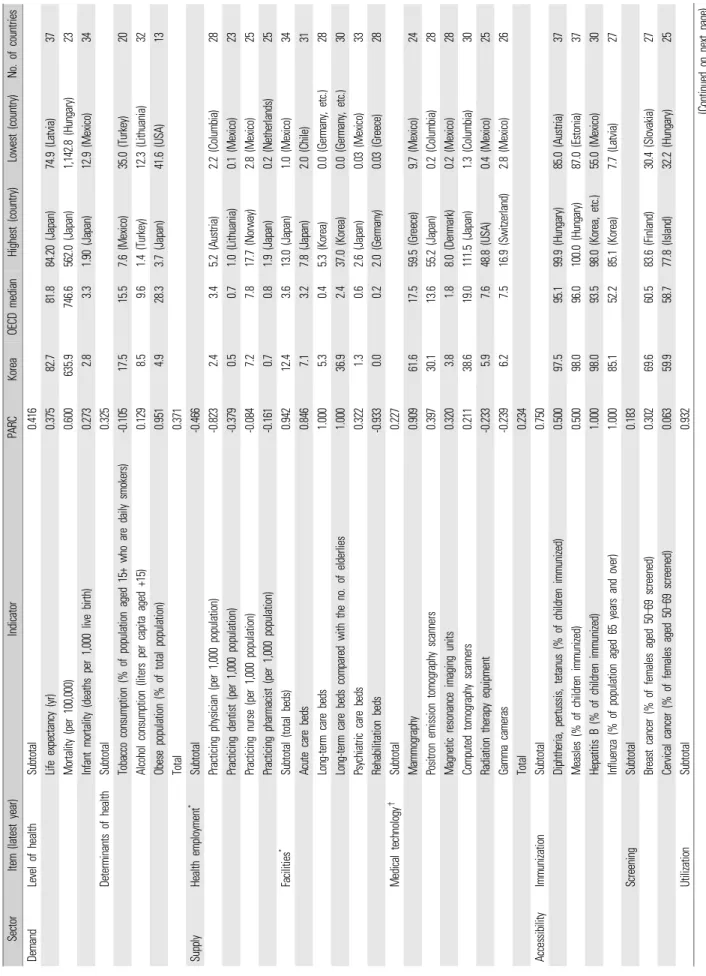
Table 1은 우리나라 현재 보건의료수준을 PARC를 통해 OECD 국 가들과 비교한 결과이다. 우리나라 현재 수준을 비교해보았을 때 보 건의료 수요, 공급, 접근성, 질에 대한 위치는 OECD 국가들의 중앙값 보다 높고, 의료비는 OECD 중앙값보다 낮다. 5개의 보건의료 영역별 로 살펴보면, 건강수준과 건강결정요인의 PARC 값은 각각 0.416과 0.325로 양호한 수준이다. 그러나 유일하게 흡연율이 -0.105로 안 좋 은 상태이다. 공급 부문에서 인력의 위치도는 -0.466으로 낮았고, 의 사, 치과의사, 간호사, 약사 중, 특히 인구 1,000명당 의사 수가 -0.823 으로 가장 나았다. 그러나 병상 수는 0.942로 매우 높았고, 의료장비도 0.227로 양호한 수준이다. 접근도 부문에서 예방접종률과 외래방문 횟수 및 입원일수는 OECD 국가들보다 상당히 높은 수준에 위치하 고, 유방암과 자궁경부암 검진도 0.183로 OECD 중앙값보다 높지만 차이의 크기는 작다. OECD 국가들과 비교할 때 우리나라 보건의료 질에 대한 종합적인 위치도는 높지만(0.192), 일차의료(-0.237)와 정 신건강(-0.478)의 위치도는 낮았다. OECD 국가들 중 한국의 의료비
217-224
219
Se ct or Item ( lat es t y ear ) In di ca to r PARC Kor ea O EC D m edi an Hi gh est ( co unt ry ) Lo w est ( co un tr y) N o. of co unt ries Dem and Le ve l of heal th Subt ot al 0. 416 Li fe ex pec ta ncy ( yr ) 0. 375 82 .7 81. 8 84. 20 ( Jap an) 74. 9 ( Lat vi a) 37 M or tal ity ( per 1 00, 00 0) 0. 600 63 5. 9 746. 6 562. 0 ( Jap an) 1, 142. 8 ( H unga ry ) 23 In fa nt m or tal ity ( deat hs per 1, 000 l iv e bi rt h) 0. 273 2. 8 3. 3 1. 90 ( Japa n) 12. 9 ( M exi co) 34 Det er m in an ts of heal th Subt ot al 0. 325 Tob acc o co ns um pt io n ( % of pop ul at io n age d 15 + w ho ar e dai ly s m ok er s) -0 .105 17 .5 15. 5 7. 6 ( M ex ic o) 35. 0 ( Tur ke y) 20 Al co hol c ons um pt ion ( lit er s per c api ta age d +1 5) 0. 129 8. 5 9. 6 1. 4 ( Tu rk ey) 12. 3 ( Li thu ani a) 32 O bes e po pul at io n ( % of t ot al pop ul at ion) 0. 951 4. 9 28. 3 3. 7 ( Ja pan) 41. 6 ( U SA ) 13 Tot al 0. 371 Suppl y Heal th em pl oy m ent
*Subt ot al -0 .466 Pr ac tic ing p hys ic ia n ( per 1, 000 pop ul at ion) -0 .823 2. 4 3. 4 5. 2 ( A us tr ia) 2. 2 ( Col um bi a) 28 Pr ac tic ing d ent is t ( per 1, 00 0 po pul at io n) -0 .379 0. 5 0. 7 1. 0 ( Li thua ni a) 0. 1 ( M ex ic o) 23 Pr ac tic ing n ur se ( per 1, 00 0 po pul at io n) -0 .084 7. 2 7. 8 17. 7 ( N or w ay) 2. 8 ( M ex ic o) 25 Pr ac tic ing p har m aci st ( per 1, 00 0 po pul at io n) -0 .161 0. 7 0. 8 1. 9 ( Ja pan) 0. 2 ( N et he rland s) 25 Fa ci lit ie s
*Subt ot al ( tot al be ds) 0. 942 12 .4 3. 6 13. 0 ( Japa n) 1. 0 ( M ex ic o) 34 A cut e c ar e beds 0. 846 7. 1 3. 2 7. 8 ( Ja pan) 2. 0 ( Chi le ) 31 Lo ng- te rm ca re b eds 1. 000 5. 3 0. 4 5. 3 ( Kor ea) 0. 0 ( G er m any, et c. ) 28 Lo ng- te rm ca re b eds c om pa red w ith t he no. of el der lies 1. 000 36 .9 2. 4 37. 0 ( Ko rea) 0. 0 ( G er m any, et c. ) 30 Psy ch ia tr ic c ar e be ds 0. 322 1. 3 0. 6 2. 6 ( Ja pan) 0. 03 ( M exi co) 33 Reh abi lit at ion b eds -0 .933 0. 0 0. 2 2. 0 ( G er m any) 0. 03 ( G re ec e) 28 M edi cal t ec hn ol ogy
†Subt ot al 0. 227 M am m og rap hy 0. 909 61 .6 17. 5 59. 5 ( G re ec e) 9. 7 ( M ex ic o) 24 Pos itr on em is si on t om ogr aphy s ca nne rs 0. 397 30 .1 13. 6 55. 2 ( Japa n) 0. 2 ( Col um bi a) 28 M agn et ic r eso nan ce i m agi ng u ni ts 0. 320 3. 8 1. 8 8. 0 ( D enm ar k) 0. 2 ( M ex ic o) 28 Com put ed t om ogr aphy s ca nne rs 0. 211 38 .6 19. 0 111. 5 ( Jap an) 1. 3 ( Col um bi a) 30 Radi at ion t her ap y equi pm ent -0 .233 5. 9 7. 6 48. 8 ( U SA ) 0. 4 ( M ex ic o) 25 G am m a c am er as -0. 239 6. 2 7. 5 16. 9 ( Sw itz er land) 2. 8 ( M ex ic o) 26 Tot al 0. 234 Ac ce ss ib ili ty Im m uni za tion Subt ot al 0. 750 Di pht her ia , p er tuss is, t et anus ( % of chi ld ren i m m uni zed) 0. 500 97 .5 95. 1 99. 9 ( H un gar y) 85. 0 ( A us tr ia) 37 M eas le s ( % of chi ld ren i m m uni zed) 0. 500 98 .0 96. 0 100. 0 ( H unga ry ) 87. 0 ( Est oni a) 37 H epat iti s B ( % of chi ld ren i m m uni zed) 1. 000 98 .0 93. 5 98. 0 ( Ko rea, et c. ) 55. 0 ( M exi co) 30 In flue nz a ( % of pop ul at io n age d 65 ye ar s an d ov er ) 1. 000 85 .1 52. 2 85. 1 ( Ko rea) 7. 7 ( Lat vi a) 27 Sc reeni ng Subt ot al 0. 183 Br ea st ca nc er ( % of f em al es age d 50 –69 sc re ene d) 0. 302 69 .6 60. 5 83. 6 ( Fi nl and) 30. 4 ( Sl ov ak ia) 27 Cer vi cal c an ce r ( % of f em al es a ged 50 –69 s cr ee ned) 0. 063 59 .9 58. 7 77. 8 ( Is la nd) 32. 2 ( H un gar y) 25 Ut ili za tio n Subt ot al 0. 932 (C ont inue d on n ext pa ge)
Tab le 1 . PARC f o r e ac h i n d ica to r i n 20 18 o r ne ar es t y ea r
Item ( lat es t y ear ) In di ca to r PARC Kor ea O EC D m edi an Hi gh est ( co unt ry ) Lo w est ( co un tr y) N o. of co unt ries O ut pa tient vi si ts ( no. p er c api ta ) 1. 000 16 .7 6. 7 16. 9 ( Ko rea) 2. 7 ( Sw ed en) 24 N o. of day s of a dm is si on ( per c api ta ) 0. 864 3. 3 1. 2 3. 6 ( Ja pan) 0. 2 ( M ex ic o) 29 Tot al 0. 622 re Pr im ar y c ar e
‡Subt ot al -0 .237 A st hm a hos pi ta l adm is si on -0 .803 81 .0 32. 8 7. 6 ( M ex ic o) 93. 1 ( Lat vi a) 24 Chr oni c o bst ru ct iv e p ul m onar y di se as e hos pi ta l adm is si on -0 .055 18 2. 1 173. 2 54. 4 ( Ital y) 335. 9 ( Tur ke y) 24 Con ges tiv e hear t f ai lu re h os pi tal adm is si on 0. 815 87 .9 224. 3 57. 0 ( M exi co) 502. 6 ( Li th uani a) 21 H ype rt ensi on hos pi ta l adm is si on -0 .169 91 .1 50. 5 10. 5 ( Sp ai n) 290. 2 ( Sl ova ki a) 21 Di abe te s hos pi ta l adm is si on -0 .976 24 5. 2 112. 9 43. 4 ( Ital y) 248. 5 ( M ex ic o) 24 Ac ut e ca re
§Subt ot al 0. 295 A cut e m yoc ar di al i nf ar ct io n -0 .414 9. 6 6. 7 2. 3 ( Ic el and) 27. 5 ( M exi co) 26 St ro ke 0. 732 H em or rhagi c s tr oke 0. 503 16 .9 24. 8 9. 3 ( Ic el and) 39. 2 ( Lat vi a) 25 Is chem ic st ro ke 0. 961 3. 2 8. 2 3. 0 ( Ja pan) 21. 1 ( M exi co) 24 Canc er c ar e
∥Subt ot al 0. 618 Br ea st ca nc er 0. 122 86 .6 86. 1 90. 2 ( U SA ) 72. 1 ( Li thu ani a) 33 Ce rvi ca l ca nc er 0. 808 77 .3 65. 5 80. 1 ( Ic el and) 49. 4 ( Lat vi a) 33 Col on c an ce r 1. 000 71 .8 63. 7 71. 8 ( Ko rea) 34. 5 ( Chi le ) 33 Rec tal c anc er 1. 000 71 .1 62. 5 71. 1 ( Ko rea) 32. 7 ( Chi le ) 33 M ent al heal th c ar e
¶Subt ot al -0 .478 Sc hi zophr eni a -0 .179 4. 4 3. 9 2. 0 ( Li thua ni a) 6. 7 ( N or w ay ) 10 Bi pol ar di so rder -0 .778 4. 2 2. 8 1. 3 ( Chi le ) 4. 6 ( N or w ay ) 11 Pa tie nt sa fety Subt ot al 0. 764 Seps is p ost ab dom inal s ur ger y ( per 10 0, 000) 0. 764 53 0. 1 1, 918. 7 100. 6 ( Pol an d) 4, 585. 1 ( Ire land) 15 Pa tient ex per ienc e Subt ot al 0. 187 Sat is fac tio n t ow ar ds c ons ul ta tion t im e ( % ) -0. 090 78 .7 82. 4 95. 5 ( Lux em bour g) 41. 7 ( Japa n) 18 U nder st andi ng of doc to r's des cr ip tio ns -0 .383 85 .7 89. 9 97. 5 ( Lux em bour g) 79. 0 ( Pol and) 19 Pos si bi lit y of q ues tioni ng doc to r d ur ing co ns ul ta tio n -0 .313 82 .0 88. 4 95. 4 ( N et he rlan ds) 67. 9 ( Pol and) 19 Par tic ipat ion i n d eci si on- m aki ng r egar di ng t rea tm en t -0 .085 82 .1 84. 1 95. 6 ( Lux em bour g) 61. 5 ( Pol and) 19 A band onm en t of vi si t du e t o m edi ca l ex pens es ( % ) 1. 000 2. 8 8. 2 2. 8 ( Kor ea) 21. 8 ( U SA ) 14 A band onm en t of ex am inat ion d ue t o m edi ca l ex pe ns es ( % ) 0. 178 5. 6 6. 6 0. 8 ( Pol and) 19. 5 ( U SA ) 13 A band onm en t of m edi ci ne d ue t o m edi ca l ex pe ns es ( % ) 1. 000 1. 9 6. 5 1. 9 ( Kor ea) 18. 1 ( U SA ) 15 Tot al 0. 192 Ex pens es M edi ca l ex pe ns es per ca pi ta ( U S$ pur ch asi ng pow er p ar ity ) -0. 269 3, 38 4 4, 204 11, 07 2 ( U SA) 1, 154 ( M ex ic o) 37 GDP Shar e of gr os s dom est ic pr od uct ( % ) -0 .207 8. 0 9. 0 17. 0 ( U SA ) 4. 4 ( Tu rk ey) 37 Tot al -0 .228 va lu e f or rel at ive com pari so n; O ECD , O rg ani zat io n f or E con om ic C oo perat ion an d D evel opm en t; G D P , gross dom est ic produ ct . ul at ions ( he ad cou nt s) .
†Indi cat es num ber.
‡Per 100, 000, o lder t han 15 ye ar s ol d.
§Th ir ty -day m ort al ity af te r adm issi on t o ho sp ital f or sp eci fic di se ase , 45 years ol d and over, per 100 pat ient s.
∥Fi ve year r el at iv e su rv iv al f or ol de r t ha n 15 years ol d.
¶Excessi ve m or tal ity f or pat ie nt s di agnosed w ith spec ifi c di sease, 15 t o 74 years ol d.
n ti n u ed
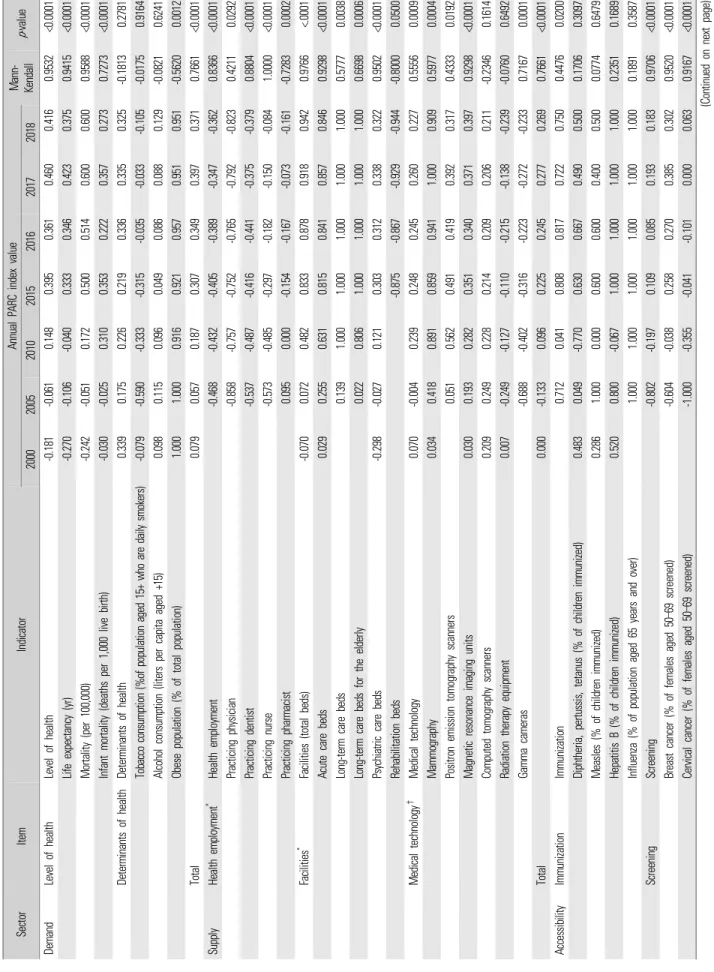
217-224
221
Se ct or Ite m In di ca to r Annu al PARC i ndex val ue Ma nn - Ke ndal l p- val ue 2000 200 5 20 10 2015 201 6 20 17 2018 Dem and Le ve l of heal th Le ve l of heal th -0 .1 81 -0 .061 0. 14 8 0. 395 0. 361 0. 46 0 0. 416 0. 9532 <0 .000 1 Li fe ex pe cta nc y ( yr) -0 .2 70 -0 .106 -0 .0 40 0. 33 3 0. 346 0. 42 3 0. 37 5 0. 9415 <0 .000 1 M or tal ity ( per 10 0, 000) -0 .2 42 -0 .051 0. 17 2 0. 500 0. 514 0. 60 0 0. 600 0. 9588 <0 .000 1 In fa nt m or tal ity ( deat hs p er 1, 000 l iv e bi rt h) -0 .0 30 -0 .025 0. 31 0 0. 35 3 0. 222 0. 35 7 0. 27 3 0. 7273 <0 .000 1 Det er m in an ts of heal th Det er m in ant s of heal th 0. 33 9 0. 175 0. 22 6 0. 219 0. 336 0. 33 5 0. 325 -0 .1 813 0. 278 1 Tob acco con su m pt io n (% of p opu la tio n age d 15+ w ho a re da ily sm oke rs) -0 .0 79 -0 .590 -0 .3 33 -0 .3 15 -0 .035 -0 .0 33 -0 .1 05 -0 .0 175 0. 916 4 Al co hol c ons um pt ion ( lit er s per c api ta a ged +15) 0. 09 8 0. 115 0. 09 6 0. 049 0. 086 0. 08 8 0. 129 -0 .0 821 0. 624 1 Ob es e pop ul at io n ( % of t ot al p opul at ion) 1. 00 0 1. 000 0. 91 6 0. 92 1 0. 957 0. 95 1 0. 95 1 -0 .5 620 0. 001 2 To ta l 0. 07 9 0. 057 0. 18 7 0. 307 0. 349 0. 39 7 0. 371 0. 7661 <0 .000 1 Suppl y Heal th em pl oy m ent
*He al th em pl oy m ent -0 .468 -0 .4 32 -0 .4 05 -0 .389 -0 .3 47 -0 .3 62 0. 8366 <0 .000 1 Pr ac tici ng ph ys ic ia n -0. 858 -0 .7 57 -0 .7 52 -0 .765 -0 .7 92 -0 .8 23 0. 4211 0. 029 2 Pr ac tici ng de nt is t -0 .537 -0 .4 87 -0 .4 16 -0 .441 -0 .3 75 -0 .3 79 0. 8804 <0 .000 1 Pr ac tici ng nu rs e -0. 573 -0 .4 85 -0 .2 97 -0 .182 -0 .1 50 -0 .0 84 1. 0000 <0 .000 1 Pr ac tici ng ph ar m aci st 0. 095 0. 00 0 -0 .1 54 -0 .167 -0 .0 73 -0 .1 61 -0 .7 283 0. 000 2 Fa ci lit ie s
*Fa ci lit ies ( to tal bed s) -0 .0 70 0. 072 0. 48 2 0. 833 0. 878 0. 91 8 0. 942 0. 9766 <. 000 1 Ac ut e c ar e b eds 0. 02 9 0. 255 0. 63 1 0. 81 5 0. 841 0. 85 7 0. 84 6 0. 9298 <0 .000 1 Lo ng- te rm c ar e be ds 0. 139 1. 00 0 1. 000 1. 000 1. 00 0 1. 000 0. 5777 0. 003 8 Lo ng- te rm c ar e be ds f or t he el der ly 0. 022 0. 80 6 1. 00 0 1. 000 1. 00 0 1. 00 0 0. 6698 0. 000 6 Ps yc hi at ric c ar e bed s -0. 29 8 -0. 027 0. 12 1 0. 303 0. 312 0. 33 8 0. 322 0. 9502 <0 .000 1 Reha bi lit at ion be ds -0 .8 75 -0 .867 -0 .9 29 -0 .9 44 -0 .8 000 0. 050 0 M edi cal t ec hn ol ogy
†M edi ca l t ec hnol ogy 0. 07 0 -0. 004 0. 23 9 0. 248 0. 245 0. 26 0 0. 227 0. 5556 0. 000 9 M am m ogr ap hy 0. 03 4 0. 418 0. 89 1 0. 85 9 0. 941 1. 00 0 0. 90 9 0. 5977 0. 000 4 Po si tr on em is si on t om ogr aphy sc anner s 0. 051 0. 56 2 0. 491 0. 419 0. 39 2 0. 317 0. 4333 0. 019 2 M agn et ic r es onanc e i m ag ing uni ts 0. 03 0 0. 193 0. 28 2 0. 35 1 0. 340 0. 37 1 0. 39 7 0. 9298 <0 .000 1 Co m pu ted t om ogr aphy sc anner s 0. 209 0. 249 0. 22 8 0. 214 0. 209 0. 20 6 0. 211 -0 .2 346 0. 161 4 Radi at io n t her ap y e qui pm en t 0. 00 7 -0 .249 -0 .1 27 -0 .1 10 -0 .215 -0 .1 38 -0 .2 39 -0 .0 760 0. 649 2 Gam m a c am er as -0. 688 -0 .4 02 -0 .3 16 -0 .223 -0 .2 72 -0 .2 33 0. 7167 0. 000 1 To ta l 0. 00 0 -0 .133 0. 09 6 0. 22 5 0. 245 0. 27 7 0. 26 9 0. 7661 <0 .000 1 Ac ce ss ib ili ty Im m uni za tion Im m uni za tion 0. 712 0. 04 1 0. 808 0. 817 0. 72 2 0. 750 0. 4476 0. 020 0 Di pht her ia , pe rt uss is , t et anus ( % of c hi ld ren i m m uni ze d) 0. 48 3 0. 049 -0 .7 70 0. 63 0 0. 667 0. 49 0 0. 50 0 0. 1706 0. 309 7 M eas le s ( % of c hi ld ren i m m uni ze d) 0. 28 6 1. 000 0. 00 0 0. 600 0. 600 0. 40 0 0. 500 0. 0774 0. 647 9 He pat iti s B ( % of c hi ld ren i m m uni ze d) 0. 52 0 0. 800 -0 .0 67 1. 00 0 1. 000 1. 00 0 1. 00 0 0. 2351 0. 168 9 In fluenz a ( % of p opul at ion a ged 65 y ear s and ov er ) 1. 000 1. 00 0 1. 000 1. 000 1. 00 0 1. 000 0. 1891 0. 358 7 Sc reeni ng Sc reeni ng -0 .802 -0 .1 97 0. 10 9 0. 085 0. 19 3 0. 18 3 0. 9706 <0 .000 1 Br ea st c anc er ( % of f em al es a ged 50 –69 s cr eene d) -0 .604 -0 .0 38 0. 25 8 0. 270 0. 38 5 0. 302 0. 9520 <0 .000 1 Ce rv ic al c anc er ( % of f em al es ag ed 5 0– 69 s cr ee ned) -1 .000 -0 .3 55 -0 .0 41 -0 .101 0. 00 0 0. 06 3 0. 9167 <0 .000 1 (C ont inue d on n ext pa ge)
Tab le 2 . PARC f o r e ac h i n d ica to r i n 20 18 o r ne ar es t y ea r
Ite m In di ca to r Annu al PARC i ndex val ue Ma nn - Ke ndal l p- val ue 2000 200 5 20 10 2015 201 6 20 17 2018 Ut ili za tio n U til iz at ion 0. 07 6 0. 392 0. 68 1 0. 865 0. 878 0. 90 3 0. 932 0. 9883 <0 .000 1 Out pat ient v isi ts ( no. pe r c api ta ) 0. 41 2 0. 752 1. 00 0 1. 00 0 1. 000 1. 00 0 1. 00 0 0. 6743 0. 000 1 No. of d ay s o f ad m is si on ( pe r c api ta ) -0. 25 9 0. 032 0. 36 3 0. 730 0. 756 0. 80 6 0. 864 0. 9649 <0 .000 1 To ta l 0. 07 6 0. 101 0. 17 5 0. 59 4 0. 593 0. 60 6 0. 62 2 0. 8012 <0 .000 1 e Pr im ar y ca re
‡Pri m ar y ca re -0 .2 57 -0 .2 70 -0 .235 -0 .2 37 0. 4667 0. 060 3 As th m a hos pi ta l a dm iss io n -0 .4 48 -0 .9 51 -0 .862 -0 .8 03 -0 .1 111 0. 654 7 Ch ro ni c ob st ru ct iv e pul m onar y di se as e hos pi ta l a dm iss io n -0. 14 8 -0. 13 0 -0. 011 -0 .0 55 0. 4667 0. 060 3 Cong es tive h ear t f ai lur e ho spi tal adm is si on 0. 70 6 0. 80 7 0. 820 0. 81 5 0. 2889 0. 244 9 Hy per te nsi on hos pi ta l a dm iss io n -0. 43 1 -0. 21 2 -0. 197 -0 .1 69 0. 9556 0. 000 1 Di abet es hos pi ta l a dm iss io n -0 .9 65 -0 .8 61 -0 .925 -0 .9 76 0. 2889 0. 244 9 Ac ut e ca re
§Ac ut e c ar e 0. 29 3 0. 296 0. 286 0. 29 5 0. 0899 0. 719 4 Ac ut e m yoc ar di al i nf ar ct ion -0 .1 34 -0 .0 78 -0 .186 -0 .1 41 0. 2000 0. 420 8 Strok e 0. 72 0 0. 671 0. 758 0. 73 2 0. 2000 0. 420 8 Hem or rhagi c st ro ke 0. 45 9 0. 41 2 0. 525 0. 58 8 0. 1556 0. 531 2 Is chem ic s tr ok e 0. 92 1 0. 922 1. 000 0. 96 5 0. 3596 0. 150 8 Canc er c ar e
∥Canc er c ar e 0. 16 6 0. 285 0. 68 6 0. 607 0. 62 2 0. 6667 0. 000 3 Br ea st c anc er -0 .2 61 -0 .312 0. 05 7 0. 295 0. 36 2 0. 6667 0. 000 3 Ce rv ic al c anc er 1. 00 0 0. 934 1. 00 0 0. 806 0. 80 6 -0 .5 455 0. 005 8 Co lon c anc er -0 .2 43 0. 233 1. 00 0 0. 989 1. 00 0 0. 7782 <0 .000 1 M ent al heal th c ar e
¶M ent al heal th c ar e -0 .6 28 -0 .3 04 -0 .676 -0 .4 78 0. 1556 0. 531 2 Sc hi zo phr eni a -0. 25 6 -0. 04 8 -0. 351 -0 .1 79 0. 1556 0. 531 2 Bi po la r d iso rde r -1 .0 00 -0 .5 60 -1 .000 -0 .7 78 0. 1633 0. 541 7 Pa tient s af et y Pa tien t s af et y 1. 00 0 0. 920 0. 824 0. 76 4 -0. 8498 0. 002 7 Seps is po st abd om inal s ur ger y ( pe r 100, 000) 1. 00 0 0. 92 0 0. 824 0. 76 4 -0 .8 498 0. 002 7 Pa tient ex per ienc e Pat ie nt ex pe rienc e 0. 187 - - Sa tis fac tion t ow ar ds c ons ul ta tion t im e ( % ) -0 .090 - - Un der st andi ng of d oc tor 's des cr ip tion s -0 .383 - - Po ss ib ili ty o f qu es tioni ng doc to r du ring c ons ul ta tio n -0 .313 - - Pa rt ic ipat io n i n de ci si on -m ak in g r egar di ng t reat m ent -0 .085 - - Ab and onm en t of vi si t due t o m edi ca l e xp ens es ( % ) 1. 000 - - Ab and onm en t of ex am inat io n du e t o m edi ca l ex pen se s ( % ) 0. 178 - - Ab and onm en t of m edi ci ne du e t o m edi ca l ex pen se s ( % ) 1. 000 - - To ta l 0. 16 6 0. 285 0. 21 9 0. 161 0. 166 0. 19 3 -0. 2811 0. 103 4 M edi ca l ex pen se s p er c api ta ( U S$ p ur cha si ng pow er pa rit y) -0 .7 91 -0 .712 -0 .5 48 -0 .4 15 -0 .411 -0 .3 74 -0 .3 26 0. 9267 <0 .000 1 Shar e of g ros s dom es tic pr odu ct ( % ) -1. 00 0 -1. 000 -0 .7 76 -0 .4 67 -0 .411 -0 .3 88 -0 .2 96 0. 9306 <0 .000 1 To ta l -0 .8 96 -0 .856 -0 .6 62 -0 .4 41 -0 .411 -0 .3 81 -0 .3 11 0. 9736 <0 .000 1 va lu e f or rel at ive com pari so n. at ions ( he ad c ount s) .
†In di cat es num ber.
‡P er 100, 000, o lder t han 15 ye ar s ol d.
§Th ir ty -day m ort al ity af te r ad m issi on t o ho spi ta l f or sp eci fic di sease, 45 years o ld and over, per 100 pat ient s.
∥Fi ve year rel at ive s ur vi va l f or ol de r t ha n 15 years ol d.
¶Excessi ve m or tal ity f or pat ie nt s di agnosed w ith spec ifi c di sease, 15 t o 74 years ol d.
n ti n u ed
https://kshpa.jams.or.kr/co/main/jmMain.kci 223 2018 한국의 보건의료의 상대적 위치와 추이: OECD 국가와 비교 ∙ 윤흰뫼 외
보건행정학회지 2021;31(2):217-224
Kendall’s Tau-b 상관계수를 보면, 건강수준은 상승 추세, 건강 위험요 인은 감소 추세이며, 종합적으로 수요 전체는 증가하고 있다(0.7661).
인력 수준은 계속해서 OECD 중앙값 대비 낮은 수준이지만 점차 증 가하고 있는 모습이다. 그 외 병상 수, 의료장비는 꾸준히 증가하여 종 합적으로 공급 전체는 증가하고 있다(0.7661). 접근도 부문의 모든 지 표는 꾸준히 증가하고 있는 추세였다. 의료 질과 관련하여 일차의료 (0.4667) 지표는 계속하여 OECD 중앙값보다 낮았지만 조금씩 높아 지는 경향을 보였고, 환자 경험(-0.8498)을 제외한 다른 지표들의 PARC 값이 점차 증가하였다. 의료의 질의 종합적인 추세는 감소하였 다(-0.2811). 의료비는 OECD 중앙값 대비 낮지만 점차 증가하고 있 다(0.9736).
고 찰
우리나라의 보건의료수준 현황을 진단하기 위해 PARC를 이용하 여 OECD 국가들과 위치를 비교하고, 2000년부터 현재까지 추이를 살펴보았다. 분석결과 2018년도 한국 보건의료 수요, 공급, 접근도, 질 부문은 OECD 국가들의 중앙값 대비 높은 수준이었고, 의료비는 낮 았다. 이 결과는 2014, 2015, 2016, 2017년의 선행연구들과 유사하였 다[6-9].
기대여명, 사망률, 영아사망률로 살펴 본 한국의 건강수준은 1960 년대 이후 경제성장과 더불어 사망률이 감소하면서 OECD 국가 중 기대수명이 가장 빠르게 증가하여 현재 매우 양호한 위치에 있다[11].
그러나 주관적 건강상태, 자살 사망률은 OECD 국가들 중 나쁜 편으 로 나타나 삶의 질 개선을 위한 노력이 필요하다[5]. 건강결정요인 중 비만율은 여전히 다른 국가들에 비해 매우 좋은 수준이지만, 국내 비 만인구 비중이 점차 증가하면서 상대적 위치도는 조금씩 낮아지고 있 다[12]. 종합적으로 기대여명의 증가와 건강한 삶의 질에 대한 욕구 증대, 그리고 비만을 포함한 건강위험요인으로 인한 질병구조의 변 화 등으로 인해 앞으로 우리나라 보건의료 수요는 지속적으로 증가할 것으로 예상된다.
공급 부문의 종합적 점수는 OECD 국가들보다 조금 높은 위치이 다. 그러나 보건의료 인력은 계속해서 낮은 수준에 머무르며, 특히 인 구 천 명당 의사 수는 2.4명으로 OECD 국가 중에서는 세 번째로 낮다.
반면 병상 수는 다른 국가들에 비해 많은데, 특히 노인장기병상은 2000년 이후 급증하여 현재는 OECD 국가 중 가장 많다.
OECD 국가들과 비교했을 때 우리나라 접근도에 대한 상대적 위치 는 높은 편이다. 예방접종도 B형 간염과 독감의 경우 OECD 국가 중 1
위였고, 국민건강보험공단 국가암검진에 포함된 유방암과 자궁경부 암 검진율도 지속적으로 증가하여 2017년 이후부터 모두 OECD 중앙 값 대비 양의 값을 기록했다. 우리나라는 접종률 향상을 위해 다양한 보건사업과 프로그램을 진행하였고, 자궁경부암과 유방암 등 6대 암 에 대한 국민건강보험공단 국가암검진을 지원하는 등의 정책을 시행 한 성과로 볼 수 있다[13].
종합적인 의료의 질에 대한 OECD 국가 간 상대적 위치는 양호한 편이며 상승 추세이다. 질 지표 중 급성진료, 암 진료, 환자 안전 및 경 험은 OECD 국가들보다 높은 반면, 일차의료와 정신질환은 지속적으 로 낮은 수준에 머물러 개선이 요구된다. 일차의료의 경우 울혈성심부 전을 제외한 천식, 만성폐쇄성폐질환(chronic obstructive pulmonary disease), 고혈압, 당뇨 입원율은 일차의료를 통한 적절한 관리와 치료 를 통해 예방이 가능한 질환이지만 우리나라는 OECD 국가 중 지속 적으로 상위권을 기록하고 있다. 따라서 일차의료 역할의 정립과 서 비스 전달체계 강화를 통한 질환의 예방과 관리를 위한 방안이 필요 하다.
한국의 보건의료비 지출은 OECD 국가들과 비교하여 낮은 수준이 지만, 지속적으로 증가하고 있는 추세를 보인다. 2018년에 한국 GDP 대비 경상의료비는 8.0% OECD 중앙값 9.0%(평균 8.8%)보다 낮다 [12]. 그러나 의료비 지출의 증가 속도를 보면 2013년과 2018년 사이 1.4% 증가하여 OECD 평균 0.1%에 비해 가장 빠른 것으로 나타나며, 다른 국가들과의 격차가 점차 줄어들고 있다. 한국은 의료 수요 증가, 보장성 확대 등에 따라 보건의료비 지출은 앞으로도 더 증가할 것으 로 예상되어, 재원의 효율적 지출을 위한 전략 수립이 더욱 필요하다.
이 연구결과를 바탕으로 우리나라 보건의료수준의 상대적 위치를 해석함에 있어 주의해야 할 한계점이 있다. 먼저 우리나라가 OECD health statistics에 제출하지 못한 지표에 대해서는 우리나라의 위치 를 파악할 수 없고, OECD 국가들의 최댓값, 최솟값, 중앙값을 사용하 여 PARC 값을 산출하기 때문에 지표별로 자료를 제출한 국가의 수에 따라 결과값이 변할 수 있다. 따라서 PARC 값을 사용하여 우리나라 위치를 해석할 때 주의가 필요하다. 예를 들어 정신질환의 경우 10개 의 국가들 중 우리나라의 상대적 위치임을 참고해야 한다.
또한 OECD 자료가 국가별로 지표를 측정하는 방법에 차이가 있을 수 있다. 그리고 질 관리를 위한 노력에도 불구하고 많은 항목을 측정 하는데 있어서 과소 보고, 결측 자료 및 오류의 가능성이 있기 때문에 해석에 주의를 기울여야 한다. 환자 안전 및 경험과 관련된 자료는 최 근 1–2년의 자료만 수집되었기 때문에 꾸준한 관찰이 필요하다고 여 겨진다. 마지막으로, PARC는 절대평가가 아닌 각 국가의 중앙값을 기준으로 한 상대평가를 하는 지표이므로 주의가 필요하다. 이 같은 한계점에도 불구하고 이 연구는 보건의료수준을 나타내는 대표성 있
Youn HM et al ∙ Position Value for Relative Comparison of Healthcare Status of Korea in 2018: Comparison with the OECD
는 지표를 활용하여 OECD 국가들 중 우리나라의 상대적 위치를 비 교하고 평가할 수 있다는 강점을 갖고 있다.
보건의료정책 모형에 기반하여 수요, 공급, 접근도, 의료의 질, 의료 비 부문에서 우리나라 보건의료정책 문제를 진단해 본 결과, 대부분 의 지표에서 OECD 국가들보다 상대적으로 양호한 편이었으나, 보건 의료 인력, 일차의료, 정신질환을 포함한 일부 지표들은 개선이 필요 한 정책과제였다. 또한 앞으로 의료 수요와 의료비의 지속적인 증가 추세가 이어질 것으로 예상되어 이에 대한 정책대안 마련이 필요하 다. 이 연구의 진단결과를 바탕으로 보건의료문제에 대한 우선순위 결정을 통해 보건의료체계 지속 가능성을 공고히 할 것을 기대한다.
ORCID
Hin Moi Youn: https://orcid.org/0000-0002-8383-5889 Hyeon Ji Lee: https://orcid.org/0000-0002-7874-593X;
Eun-Cheol Park: https://orcid.org/0000-0002-2306-5398
REFERENCES