TEMPORAL VARIATIONS OF URBAN HEAT ISLAND USING LAND SURFACE TEMPERATURE DERIVED FROM MTSAT-1R
Hong Ki-Ok, Suh Myoung-Seok, Kang Jeon-Ho, Kwak Chong-Heum, Kim Chan-Soo
Department of Atmospheric Science, Kongju National University, 182 Shinkwan-dong, Gongju-city 314-701, ChungCheongnam-do, Korea, [email protected]
ABSTRACT: The land surface temperature (LST) derived from the meteorological satellite can be used to investigate the urban heat island (UHI) and its temporal variations. In this study, we developed LST retrieval algorithm from MTSAT-1R by means of a statistical regression analysis from radiative transfer simulations using MODTRAN 4 for a wide range of atmospheric, satellite viewing angle (SVA) and lapse rate conditions. 535 sets of thermodynamic initial guess retrieval (TIGR) were used for the radiative transfer simulations. Sensitivity and intercomparison results showed that the algorithm, developed in this study, estimated the LST with a similar bias and root mean square errors to that of other algorithms. The magnitude, spatial extent, and seasonal and diurnal variations of the UHI of Korean peninsula were well demonstrated by the LST derived from MTSAT-1R data. In general, the temporal variations of UHI clearly depend on the weather conditions and geographic environment of urban.
KEY WORDS: Land surface temperature, MODTRAN 4, MTSAT-1R, urban heat island
1. INTRODUCTION
Urbanization brought about the significant modification of landcover and emission of extra heat. As the results, the local energy budget over urban area significantly changed through an alteration of Bowen ratio and local air quality. So, it is well known that the temperature over urban area is several degrees higher than the simultaneous temperatures of the surrounding rural areas. This effect is often referred to as the urban heat island (UHI).
Korea has experienced rapid urbanization and dramatic economic growth since early 1970s. As a result, significant warming has been occurred, especially at the urban area due to the combined effects of UHI and green house gases. Many works have been performed on the UHI over South Korea using conventional data (e.g., Kim and Baik, 2002). Accurate estimation of UHI is important for not only the policy making but also the assessment of global warming. Conventional data has a limitation in the number of observing station for the accurate evaluation of UHI according to the various geographic and weather conditions. The LST derived from satellite data can be used to investigate the spatial and temporal variations of UHI (Owen et al., 1998; Roth et al., 1989).
Theoretical possibility for the retrieval of LST using split-window method has been shown by Becker and Li (1990), and many others. Various algorithms for the retrieval of LST from the meteorological satellite data have been developed and tested in many countries (e.g., Kerr et al., 1992; Ulivieri et al., 1994; Wan and Dozier, 1996). However, operational retrieval of LST from the satellite data is very limited due to the poor accuracy of retrieved LST. The lower quality of retrieved LST is mainly caused by the combined effects of spectrally and
temporally varying emissivity and atmosphere. Recently, the various background data (e.g., landcover, vegetation index) and methods (vegetation coverage method: Valor and Caselles, 1996) for the estimation of spectral emissivity are developed. And the quality of satellite data is clearly improved in radiometric, navigation and signal to noise ratio. As the results, the quality of retrieved LST is being improved steadily.
In this study, we developed the LST retrieval algorithm from MTSAT-1R data over Korean peninsula.
And we investigate the spatial and temporal variations of urban heat island over South Korea using the LST derived from MTSAT-1R data.
2. SIMULATION OF RADIATIVE TRANSFER MODEL FOR MTSAT-1R
To retrieve the LST using split-window methods, ground match-up data are needed for the coefficients of regression equation. However, available match-up data are severely limited in LST. So, we performed radiative transfer simulations using MODTRAN 4 with various atmospheric and satellite viewing conditions. The main factors affecting the retrieved LST using split-window method are atmospheric profiles, spectral emissivity, satellite viewing angle and lapse rate at surface layer. The atmospheric radiative transfer simulations are designed to include all the impacting factors mentioned above.
x Atmospheric profiles: 535 TIGR data sets located at the SVA less than 60 o from MTSAT- 1R.
x Satellite zenith angle: SVA varies from 0 to 60 according to the relative location of TIGR data to the MTSAT-1R.
x Surface lapse rate: the LST are prescribed as Ta – 6K to Ta + 14K in steps of 2K. This wide range of LST represents the night time (Ta – 6K to Ta + 2K) and day time (Ta – 2K to Ta + 14K) conditions.
x Band emissivity: the emissivity of IR1 is range from 0.9576 to 0.9890 in step of 0.00314. And the emissivity of IR2 is range from 0.9663 to 0.9908 in step of 0.00245 .
3. PRELIMINARY RESULTS 3.1 Sensitivity Test
To evaluate the sensitivity of LST regression equations to the impacting factors, following equations are derived and tested.
(1) (2) (3)
The biases of Eqs. (1) and (2) are very similar, but that of (3) is clearly decreased (Fig. 1). It indicates that inclusion of emissivity is needed for the improvement of LST accuracy.
Figure 1. Biases of Eqs. (1), (2), and (3) for the 535 TIGR data.
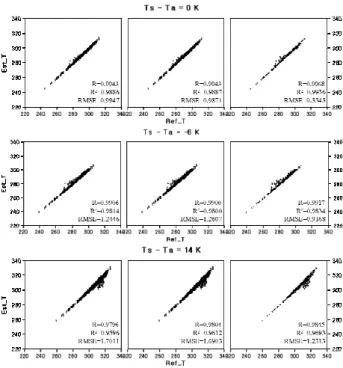
The performances of LST algorithms are strongly dependent on the surface temperature and lapse rate (Fig.
2). All the LST algorithms have a tendency to overestimate and underestimate for the strong surface inversion and superadiabatic states, respectively.
Especially, underestimations are significant at the warm LST in all the LST algorithms. The estimation level of Eq.
(3) is superior to Eqs. (1) and (2) without regard to the lapse rate and the range of LST in all statistics. So, we used the Eq. (3) for the estimation of LST over Korean peninsula from MTSAT-1R data.
As shown in Eqs. (1)~(3), effective spectral emissivity is needed to estimate the LST using split window method from MTSAT-1R data. To derive the spectral emissivity over Korean peninsula, vegetation cover method (VCM, Caselles et al., 1997) is used. The effective emissivity of each channel is defined as the sum of the components from the vegetated area and the remaining ground area within pixel.
(4)
where, εi,g, and εi,v, are the vegetation and ground emissivity corresponding to the land cover types.
Emissivities of vegetation and ground according to the land cover types were obtained from Peres and DaCamara(2002).
Figure 2. Scatter plots of estimated LST (ordinate) using Eqs. (1), (2) and (3) against reference LST (abscissa) according to the surface lapse rate.
3.2 FVC and Emissivity
FVC is the fraction of vegetation and calculated using the normalized difference vegetation index (NDVI).
(5)
NDVImax and NDVImin are the NDVI when the pixel is completely covered with vegetation and ground, respectively.
B i a s ( K )
count
6 3 0 - 3 - 6 8 0 0 0
6 0 0 0
4 0 0 0
2 0 0 0
0 ( 1 )
6 3 0 - 3 - 6 ( 2 )
6 3 0 - 3 - 6
8 0 0 0
6 0 0 0
4 0 0 0
2 0 0 0
0 ( 3 )
min max
min
NDVI NDVI
NDVI FVC NDVI
−
= −
FVC FVC iv
g i
i=ε, ×(1− )+ε, ×
ε
2 1 2.78769 0.31635 00333
. 1 5418 .
1 T T T
LST=− + IR + Δ + Δ
2 1 2.755 0.31652 988971
. 0 3224 .
5 T T T
LST= + IR + Δ + Δ
) 1 ( 9499 . 89 ) 1 (sec 1552 .
1 θ− + −ε
+
) 1 (sec 15567 .
1 −
+ θ
2 1 2.62936 0.340194 00734
. 1 0 .
4 T T T
LST=− + IR + Δ + Δ
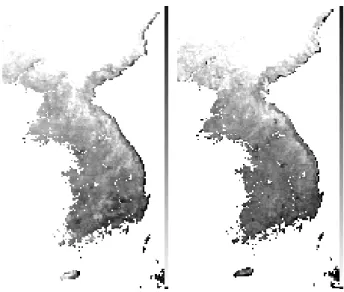
Figure 3 shows a sample image of FVC for January and August. It shows significant spatial and temporal variations. FVC is much smaller in January than in August, but their spatial variation is larger in January.
Whereas, spatial variation is very weak in August except for the urban area.
Figure 4 exhibits the emissivities of IR1 and IR2 in August. The areas with a weak FVC such as a river or a city show low emissivity. Although there are similar spatial distributions between IR1 and IR2, the latter channel shows a little bit higher emissivity.
Figure 3. Spatial distribution of FVC derived from monthly NDVI over Korean peninsula in January (left) and August (right).
Figure 4. Effective emissivities of IR 1 (left) and IR 2 (right) of MTSAT-1R in August.
3.3 LST Retrieval
UHI is clearly affected by not only the urban characteristics but also the weather conditions, such as
cloud, precipitation and wind. So, it is necessary to retrieve and analyze the LST under the various weather conditions for the quantitative investigation of the spatial extent and temporal variations of UHI.
Figure 5 shows the LST of September, 2006 derived from MTSAT-1R over Korean peninsula. To enhance the spatial contrast of LST, we used the different scale-bar at each image. Left and right images are the day time (0333UTC on 07) and night time (1333UTC on 24) LST, respectively. In general, the LST was decreased with height, warmer at the plain area and cooler at the mountain area. The LST over the main urban area, such as Seoul, Busan, and Daegu, is clearly higher than the surrounding areas. The UHI effect is also seen at the night image but the magnitude is slightly weaker than day time.
Figure 5. Spatial distribution of day (left) and night (right) time LST derived from MTSAT-1R over Korean Peninsula in September. (Scale bar range – left: 290K ~ 313K, right: 275K ~ 295K)
Figure 6 shows the LST of January, 2006 derived from MTSAT-1R over Korean peninsula. Left and right are the day time (0633UTC on 22) and night time (1433UTC on 21) LST, respectively. The UHI effect is also seen both day and night image but the magnitude is slightly weaker than September case. The one reason for the weak UHI can be attributed to the enhanced vertical and horizontal mixings induced by the stronger wind in January than September. And the LST of the east coast is significantly higher than that of other regions with similar latitude and height under the influence of warm current.
Figure 6. Same as in Figure 5 except for January. (Scale bar range - left : 265K ~ 281K, right: 260K ~ 275K)
4. SUMMARY
In this study, we developed the LST retrieval algorithms from MTSAT-1R data through the radiative transfer simulations under various atmospheric profile (TIGR data), SVA and lapse rate conditions using MODTRAN 4. And we investigated on the sensitivity and consistency of the derived LST equations. The relative accuracy of LST equation is increased as the number of impacting factor included in the LST equation.
So, we used the Eq. (3) to estimate the LST over Korean peninsula.
Effective emissivities of IR1 and IR2 are derived using vegetation cover method with the land cover map and monthly NDVI. The effective emissivity of each channel well captures the spatial and temporal variations due to the different land cover types and the seasonal march of fraction of vegetation over Korean peninsula.
The LST derived from MTSAT-1R under various weather conditions showed that the UHI over South Korea is significant without regard to the month and day and night. However, the magnitude of UHI is clearly dependent on the weather conditions and urban characteristics. The UHI is more dominant during day and summer than night and winter. In general, the UHI is more dominant especially the wind is weak and is proportional to the spatial extent of urban area. Also, the UHI is affected by the surrounding geographic environment of the urban. So, the UHI is more dominant at the inland area, especially surrounded by mountain than coastal area and opened area.
It is necessary to retrieve more LST under the various weather conditions for the quantitative evaluation on the spatial extent and temporal variations of UHI. And other data such as weather conditions (wind, cloud, precipitations), topography and land cover map of Korean peninsula should be incorporated.
5. REFERENCES
Becker F., and Z.-L., Li, 1990. ㄴ Toward a local split window method over land surface. Int. J. Remote Sens., 3, 369-393.
Caselles V., C. Coll, and E. Valor, 1997, Land surface emissivity and temperature determination in the whole HAPEX-Sahel area from AVHRR data. Int. J. Remote Sens., 18, 1009–1027.
Kerr Y. H., J. P. Lagouarde, and J. Imbernon, 1992.
Accurate land surface temperature retrieval from AVHRR data with use of an improved split window.
Remote Sens. Env., 41, 197-209.
Kim Y. -H., and J. -J. Baik, 2002, Maximum urban heat islands intensity in Seoul. J. Appl. Meteor., 41, 651-659.
Owen, T. W., T. N. Carlson, R. R. Gillies, 1998. An assessment of satellite remotely-sensed land cover parameters in quantitatively describing the climatic effect of urbanization. Int. J. Remote Sens., 19 (9), 1663– 1681.
Roth M., T. R. Oke, W. J. Emery, 1989. Satellite derived urban heat islands from three coastal cities and the utilization of such data in urban climatology. Int. J.
Remote Sens., 10 (11), 1699– 1720.
Peres L., and C. C. DaCamara, 2002, An emissivity look- up table for LST estimations from MSG data. SAF on land Surface Analysis Training Workshop, Lisbon, Portugal, July 8-10.
Ulivieri C., M. M. Castronouvo, R. Francioni and A.
Cardillo, 1994. A split-window algorithm for estimating land surface temperature from satellites. Adv. Space Res., 14(3), 59-65.
Valor E, and V. Caselles, 1996. Mapping land surface emissivity from NDVI: Application to European, African, and South American areas. Remote Sens. Env., 57, 164- 184.
Wan Z, and J. Dozier, 1996. A generalized split-window algorithm for retrieval of land surface temperature from space. IEEE Trans. Geosci. Remote Sens., 34, 892-905.
6. ACKNOWLEDGENENTS
This research was supported by the project:
“Development of meteorological data processing system of communication, ocean and meteorological satellite V”