Simultaneous measurements of red blood cell aggregation and blood viscosity in a slit rheometry with light transmission analysis
Myungsu Park
†, Yunhee Ku
*, Sehyun Shin
**, Jangsu Suh
***광 투사법을 이용한 슬릿 점도계에서의 적혈구 응집성 및 점도 측정에 관한 연구
박명수† · 구윤희*· 신세현** · 서장수***
Key Words : Aggregation(응집성), transmit-light intensity(광투과도), slit rheometry(슬릿 점도계), blood viscosity(혈액 점도)
Abstract
The light-transmission technique has been applied to a slit rheometer for measuring red blood cell aggregation as well as blood viscosity over a range of shear rates. For measurement of blood viscosity and aggregation, instantaneous pressure and transmit-light intensity are measured with time. Using a precision pressure measurement, one can determine the shear stress and shear rate. In addition, a transmitted light through a blood sample indicates degree of RBC aggregation. With abruptly flowing with high shear rate, RBCs rapidly disaggregate and the intensity of the transmitted light becomes low. When continuously flowing with decreasing shear rate, RBCs tend to re-aggregate and the corresponding transmit-intensity gradually increases with time. The light intensity as a degree of RBC aggregation is plotted against shear rate and compared with blood viscosity. The advantages of this design are dual measurement at a time, simplicity, i.e., ease of operation and no moving parts, low cost, short operating time, and the disposable kit which is contacted with blood sample
.
1. Introduction
Red blood cells (RBC) in normal human blood tend to form linear and branched aggregates if the fluid shear forces affecting the cells are below a critical level.
(1) This tendency for aggregation is known to be one of the major determinants of the shear-thinning viscosity of blood: Formation of RBC aggregates at low shear rates results in higher apparent viscosity, while with increasing shear dis-aggregation occurs and the apparent viscosity decreases.(2) Thus, the degree of
RBC aggregation is widely accepted as a very important determinant of low-shear viscosity of blood.
The major cause of the aggregation is the presence of large plasma-proteins, especially fibrinogen.(2)
Therefore, various methods for measuring RBC aggregation have been developed and can be found elsewhere.(3) A measurement of erythrocyte sedimentation rate (ESR)(4) was popular due to its simplicity even though its indirect measurement of RBC aggregation. In addition, there have been image analysis methods in a flow chamber(5) and ultrasound back-scattering techniques(6) for measuring RBC aggregation. Recently, a photometry recording the intensity of transmitted or back-scattered light under defined shearing conditions has been widely used to determine several aspects of RBC aggregation.(7)(8) The time course of light transmission (or back scattering), after a sudden decrement in shear rate
† 경북대학교 기계공학과 대학원 E-mail : [email protected]
TEL : (053)954-5035 FAX : (053)954-5034
* 경북대학교 기계공학과 대학원
** 경북대학교 기계공학부
** 경북대학교 의과대학 임상병리학 교실 대학기계학회 2004년도 춘계학술대회 논문집
1678
following a period of high shear, is known as a
“syllectogram”. (7) One of the commercially available instruments which analyze such “syllectograms” in a photometric shearing system is LORCA (R&R Mechatronics, Hoorn, The Netherlands).(8) The instrument consists of a laser diode, a thermostated bob-cup measuring system, step motor and a photodiode attached to a microcomputer. The microcomputer also controls the step motor, to generate various shear stress in the sample. The sample is sheared in a Couette system made of glass, with a gap of 0.3 mm between the cylinders. The backscattered light intensity is analyzed by the microcomputer and characteristic indexes are calculated.
Although these methods and instruments are able to measure RBC aggregation, the most current technology, while useful in a research setting, is not optimal for day-to-day clinical use. Furthermore, most current techniques cannot produce aggregation measurement and viscosity measurement at a time. Therefore, there has been a need to develop a simple and labor-free instrument that can measure both the aggregation of RBCs and blood viscosity over plural shear stresses at a time.
This study describes an innovative modification of slit rheometry, which is capable of measuring both blood viscosity and RBC aggregation continuously over a broad range of shear rates. The flow-rate and pressure-drop measurements that are usually required for the operation of a slit rheometer are replaced with a single measurement of pressure variation with time.
The syllectogram is adopted in a photometric shearing system and the transmitted light under decreasing shearing conditions is measured to determine the RBC aggregation. Throughout the development of this technique an emphasis has been placed on the simplicity of the design, i.e, ease of operation, no moving parts, and low cost.
2. Experiment
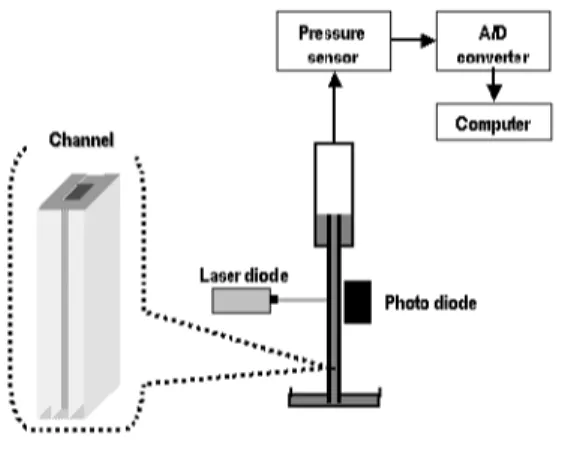
Fig. 1 is a schematic diagram of the laser- transmission slit-rheometer(LTSR), which consisted of a vacuum chamber, glass slit, receptacle, pressure transducer, laser diode, photodiode, and a computer data acquisition system. The blood sample is sheared in the slit channel made of glass with a gap of 0.80 mm and width of 6.4 mm. The glass slit integrated with a vacuum chamber is disposable. The diode laser (650 nm, 5mW) and a photodiode were used to consist of a light-transmission photometric system. The length and gap of the slit were chosen to ensure that the friction loss in the slit was the dominant loss in the system.
Fig. 1 A schematic diagram
Prior to the experiment, the atmospheric pressure (PA) and the total volume of the vacuum chamber (V0) are determined. Typical tests are conducted as follows:
At time t = 0, the data acquisition system is enabled and the valve between the preset vacuum chamber and the slit is opened, allowing the fluid to flow through the slit and be collected in the vacuum chamber as driven by the differential pressure. When the differential pressure reaches equilibrium with a pressure head (Ph = 1.05 kPa), the test fluid stops flowing.
While the fluid is flowing through the slit, a laser beam emitting from the laser diode traverses a blood sample and is transmitted though the glass slit. The transmitted light is detected by a photodiode, linked to the data acquisition system with a computer. When a differential pressure is suddenly applied, RBCs disaggregate. However, while the differential pressure is decreasing, RBCs tend to re-aggregate. The intensity of the transmitted light as a measure of RBC aggregation is recorded with the differential pressure with respect to time.
The essential feature of the LTSR was the combination of slit viscometer with a photometric technique of RBC aggregation measurement. Thus, in the present measurements, differential pressure and light intensity were measured every 0.1s by a precision pressure transducer (Validyne DP15TL) and the photodiode, respectively. The instantaneous pressure and light intensity were recorded in a computer data file through an analog-to-digital data acquisition system (NI PCI-MIO-16XE) with respect to time.
A detailed description of the stress-shear rate relation can be found in a previous study.(9) A brief description is as follows: In deriving the stress-shear rate relation in the slit rheometer, the important assumptions are 1) a fully developed, isothermal, 대학기계학회 2004년도 춘계학술대회 논문집
1679
laminar flow; 2) no slip at the walls; and 3) air in the vacuum chamber as an ideal gas. On the assumption that the product of pressure P(t) and volume V(t) in the vacuum chamber at time t is constant, PiVi= P(t)V(t), where subscript i represents the initial state of the experiment and the instantaneous pressure P(t) is recorded in the computer file. The flow rate at time t can be obtained as
= ( ) )
( P t
V P dt t d
Q
i i (1)On the other hand, the pressure difference through a slit can be expressed as P = {PA–P(t) – gL} and the corresponding wall shear stress as w(t) =
P(t)H/{(1+2H/W)L} . The shear rate at the slit wall is obtained from the classical Weissenberg- Rabinowitsch equation6
+
=
=
w aw
w z
w d
Q d dz
t dV
ln 2 ln 3 ) 1
( &
& (2)
where &aw is 6Q/wH2. It is worth noting that the optical measurement of anisotropy in the diffraction pattern reflects the elongation of cells at all depths in the pressure-driven slit flow, and hence the elongation of cells experiencing shear stress levels from zero up to the wall shear stress.
For calibration purpose of the slit rheometer, water and an aqueous solution of commercial polyacrylamide (Separan AP-273, Dow Chem. Co.) were measured and compared their results with them measured by a rotating viscometer (Physica model UDS-200, Parr Physica, Inc.) at specific temperatures. Compared with these results, the test results give about a 3.2% error across the entire shear rate range. Detail results can be found the previous study.(10) In addition, it is commonly known that fibrin is a dominant protein to cause aggregation of RBCs. Thus, the present study compares the effect of fibrin on cell aggregation and blood viscosity.
3. Results and discussion
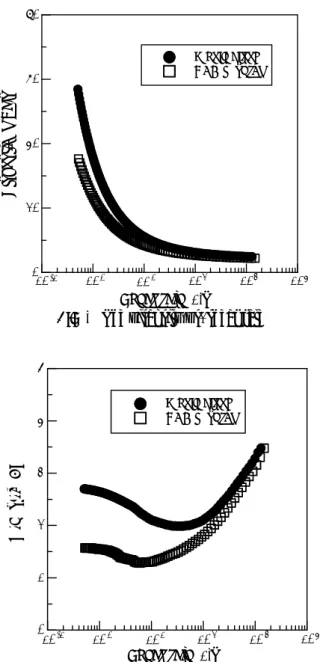
Fig. 2(a) shows the differential pressure variations over time for a blood sample. As time passed, the differential pressure between the vacuum chamber and atmosphere decreased since the waste sample chamber was filled with the flowing fluid from the slit.
Typically, it took approximately one minute to reach an asymptote for blood samples.
Fig. 2(b) shows the time courses of light transmission after sudden application of decreasing differential pressure for whole blood and RBC suspension in serum. The time course curves of light
0 2 4 6 8
Pressure(kPa)
0 50 100 150 200 250
Time (s) 0
2 4
Intensity(AU) Whole Blood
RBC in serum
Fig. 2 (a) the differential pressure variations over time.
(b) the time courses of light transmission.
transmission in Fig. 2(b) show initial decreases due to introducing blood into a light path way and disaggregation of RBCs at a high shear range, immediately followed by an increase of the transmit intensity, due to re-aggregation of RBC at a lower shear range. In the initial process, there occurs a strong shearing condition applied on blood cells, which causes disaggregation of RBCs. It is important to provide a sufficient shearing condition which can disaggregate the aggregated cells.
After passing the minimum in Fig. 2(b), the time- light curve tends to increase and reaches a plateau value as RBCs re-aggregate. Fig. 2(b) shows distinct different plateau values between the whole blood and defibriogated blood: The transmitted light for the whole blood shows higher asymptote than that for the RBC suspension in serum. This phenomenon can be interpreted by the degree of aggregation.
Fig. 3 shows the viscosity vs. shear rate plot for whole blood and RBC suspension in serum. The blood samples are obtained from the same donor and their hematocrits are the same. The fibrinogen-free blood shows much less shear-thinning viscosity than the whole blood at low shear rate. The fact implies that removing fibrinogen from plasma has a significant effect on blood viscosity associated with aggregation in spite of the fact that fibrinogen makes up only about 5% of the total plasma protein concentration of a normal blood sample. The relationship between blood viscosity and cell aggregation can be quantitatively analyzed by the present measurement of light transmitted intensity.
Fig. 4 shows the light-transmit intensity (I) versus shear rate for the whole blood and RBC suspension in 대학기계학회 2004년도 춘계학술대회 논문집
1680
10
Shear rate (1/s)
0 20 40 60 80
Viscosity(mPa.s)
Whole blood RBC in serum
10-1 100 1 102 103 104
Fig. 3 The viscosity vs. shear rate
10
Shear rate (1/s) 0
1 2 3 4 5
Intensity(AU)
Whole blood RBC in serum
10
10-1 0 1 102 103 104
Fig. 4 The light-transmit intensity (I) versus shear rate
serum. Due to the decreasing shear forces over the course of the experiment, the progressive break-up of cellular aggregates ends around the shear rate of 10 ~ 40 s-1, which is in good agreement with previous study.(2) Then, RBCs starts to re-aggregate as the shear rates decreases. The corresponding intensity increases with decreasing shear rate and reaches plateau value for each blood sample. The whole blood sample shows higher values than RBC suspension in serum, which confirms the above discussed viscometric data as shown in Fig. 3: aggregation levels in blood is proportional to low-shear viscosity. In addition, these results illustrate the well established fact that in normal blood, red cell aggregation is due mainly due to fibrinogen but other plasma proteins are involved as
well, mainly IgG, IgM and 2-macroglobulin.(2)
4. Conclusions
Since the present slit-flow photometry is designed to systematically vary shear rates over the course of the experiment, it might be interesting to further consider the relaxation of deformed red blood cell under decreasing stress and its effect on the RBC aggregation.
Furthermore, the fact that the light-transmit intensity is being characterized by a phenomenological ‘index’ of RBC aggregation suggests that the present method and technique can be satisfactorily used for screening purpose in a clinical setting.
Acknowledgments
This work was supported by a grant from the National Research Laboratory of the Ministry of Science and Technology, Korea.
References
(1) S. Chien L.A. Sung, 1987, Clin. Hemorheol. 7, 71.
(2) M.W. Rampling, 1999, Rouleax formation; its cause and consequences, In: Cardiovascular flow modeling and measurement with application to clinical mdecine. S.G. Sajidai, G.B. Nash and M.W.
Rampling, Ed., Clarendon Press, Oxford, pp. 183- 193 .
(3) S. Oka, 1981,Cardiovascular Hemorheology (Cambridge University Press, ).
(4) L.L. Houbouyan, M. Delamaire, A. Beauchet, M.
Gentil, G. Cauchois, A. Taccoen, J.P. Yvert, N.
Montredon, M.F. Roudaut, S. Zhao, A. Goguel, G.
Potron, M. Boisseau and J.-F. Stoltz,1998,Clin.
Hemorheol. Microcirc. 17, 299.
(5) S. Chen, G. Barshtein, B. Gavish, Y. Mahler and S.
Yedgar, 1994,Clin. Hemorheol. 14, 497.
(6) 6. M. Boynard, J.C Lelievre and R. Guillet, 1987,Biorheology 24, 451.
(7) H. Schmid-Schönbein, E. Volger, P. Teitel, H.
Kiesewetter, U. Dauer and L. Heilmann, 1982, Clin.
Hemorheol. 2, 93.
(8) M.R. Hardeman, P.T. Goedhart, J.G.G. Dobbe ve K.P. Lettinga, 1994, Clin.Hemorheol. 14, 605.
(9) S. Shin, Y.H. Ku, M.S. Park, J.H. Jang and J.S. Suh, 2004, Rev. Sci. Inst., 78, 567 .
(10) S. Shin, S.W. Lee, Y.H. Ku, KSME Int. J., (submitted).
대학기계학회 2004년도 춘계학술대회 논문집
1681