Background and Purpose To test whether nigrosome-1 imaging using high-resolution quantitative susceptibility mapping (QSM) combined with histogram analysis can improve the diagnostic accuracy in early-stage idiopathic Parkinson’s disease (IPD) patients.
Methods Three-dimensional multiecho gradient-recalled echo images (0.5×0.5×1.0 mm3) were obtained at 3 T for QSM in 38 patients with IPD and 25 healthy subjects. To segment the substantia nigra (SN), regions of interest (ROIs) were semiautomatically drawn at the location below the red nucleus, and the normal-appearing nigrosome-1 was determined by manual cor- rection. QSM histograms were obtained within the ROI. The segmented SN regions on the right and left that had higher mean susceptibility values and fewer voxels with susceptibility values lower than 60, 65, 70, 75, and 80 ppb were chosen for comparisons between the IPD patients and healthy subjects. These results were compared with those of the visual assess- ments of nigrosome-1 in susceptibility map-weighted imaging (SMWI) by analyzing receiver operating characteristics curves.
Results The proportion of voxels with susceptibility values lower than 70 ppb showed the best diagnostic performance, with its value differing significantly between the IPD patients (median=0, interquartile range=0–0.23) and healthy subjects (median=10.67, interquartile range=5.98–21.57) (p<0.0001). The number of voxels with susceptibility values lower than 60, 65, 70, 75, and 80 ppb showed worse diagnostic performances but were still significantly better than that of the mean susceptibility value (p=0.0249, 0.0192, 0.0183, 0.0191, and 0.0186, respec- tively), which also differed significantly between the two groups: 125.81±16.27 ppb (mean±standard deviation) in IPD versus 98.41±11.70 ppb in healthy subjects (p<0.0001). Ad- ditionally, using the proportion of voxels with susceptibility values lower than 70 ppb provided significantly better diagnostic performance than did visual assessments of SMWI (p=0.0143).
Conclusions High-spatial-resolution QSM combined with histogram analysis at 3 T can im- prove the diagnostic accuracy of early-stage IPD.
Key Words Parkinson’s disease, magnetic resonance imaging, substantia nigra, pars compacta; ROC curve.
Diagnosis of Early-Stage Idiopathic Parkinson’s Disease Using High-Resolution Quantitative Susceptibility
Mapping Combined with Histogram Analysis in the Substantia Nigra at 3 T
INTRODUCTION
The structure of nigrosome-1 as revealed using magnetic resonance imaging (MRI) has re- cently emerged as a new imaging biomarker for idiopathic Parkinson’s disease (IPD).1-6 Al- though susceptibility-weighted imaging (SWI) at 3 T can improve the detection of iron de- position in nigrosome-1 and can be used for simple visual inspections, the subjectivity of its Eung Yeop Kima
Young Hee Sungb Hyeong-Geol Shinc Young Nohb Yoonho Namd Jongho Leec
a Departments of Radiology and
b Neurology, Gachon University Gil Medical Center, Incheon, Korea
c Department of Electrical and Computer Engineering,
Seoul National University, Seoul, Korea
d Department of Radiology,
Seoul St. Mary’s Hospital, Seoul, Korea
pISSN 1738-6586 / eISSN 2005-5013 / J Clin Neurol 2018;14(1):90-97 / https://doi.org/10.3988/jcn.2018.14.1.90
Received July 31, 2017 Revised October 10, 2017 Accepted October 10, 2017 Correspondence Jongho Lee, PhD
Laboratory for Imaging Science and Technology, Department of Electrical and Computer Engineering, Seoul National University, 1 Gwanak-ro, Gwanak-gu, Seoul 08826, Korea Tel +82-2-880-731 E-mail jonghoyi@snu.ac.kr Yoonho Nam, PhD Department of Radiology, Seoul St. Mary’s Hospital, 222 Banpo-daero, Seocho-gu, Seoul 06591, Korea
Tel +82-2-258-1965 Fax +82-2-599-6771 E-mail yhnam83@gmail.com
cc This is an Open Access article distributed under the terms of the Creative Commons Attribution Non-Com- mercial License (http://creativecommons.org/licenses/by-nc/4.0) which permits unrestricted non-commercial use, distribution, and reproduction in any medium, provided the original work is properly cited.
JCN
Open Access ORIGINAL ARTICLEKim EY et al.
JCN
assessments may reduce its utility due to interobserver dis- crepancies when determining the presence or absence of ab- normality in the small subregion of the substantia nigra pars compacta (SNpc). Moreover, the different imaging sequenc- es and diverse imaging planes used in previous studies may make it difficult to incorporate nigrosome-1 imaging into the routine imaging protocol for evaluations of parkinsonism.
To address the issues of subjective visual assessments and the use of different imaging sequences, quantitative suscepti- bility mapping (QSM) is potentially a good solution because it provides an objective measure of a quantitative magnetic susceptibility value, which can be obtained by using either a single or multiecho gradient-recalled echo sequence indepen- dent of proprietary sequences.7,8 Several studies have shown the advantages of this technique over SWI and R2* mapping,9 as well as its usefulness in IPD.10-16 Studies of the diagnostic capabilities of QSM have compared the mean susceptibility values in the presumed region of the substantia nigra (SN) or SNpc in order to distinguish patients with IPD and the healthy subjects, with the results supporting the usefulness of QSM in the diagnosis of IPD.11,13-15
However, despite successfully deploying QSM, these stud- ies found that its diagnostic accuracy was comparable to that of conventional nigrosome-1 imaging using T2*-weighted imaging or SWI, showing an overlap of the mean susceptibil- ity values between the two groups. One of the potential limi- tations of these studies is that the voxels were larger [(0.9×0.9
×2.0 mm3)13-15 and (0.4×0.7×1.5 mm3)11] than those for ni- grosome-1 imaging (0.4–0.55×0.4–0.55×0.7–1.5 mm3).2,4,5 In addition, the imaging orientation may have obscured the results because all but one study (that by Murakami et al.11) obtained images axially with thick slices (1.5 mm to 2 mm), which is suboptimal for delineating the nigrosome-1 region considering its size and shape (Supplementary Fig. 1 in the online-only Data Supplement). More importantly, the previ- ous studies drew regions of interest (ROIs) along the margin of the high-susceptibility regions in QSM, which may have excluded the lower susceptibility region of nigrosome-1. This could have resulted in the normal nigrosome-1 region not being included in the ROI analysis (particularly for healthy subjects), thereby affecting the diagnostic accuracy.
In addressing these challenges, it might be possible to im- prove the diagnostic performance by performing QSM with a high spatial resolution in the imaging plane perpendicular to the principal axis of the nigrosome-1 structure (Supple- mentary Fig. 1 in the online-only Data Supplement). More- over, a histogram analysis of the SN that includes the normal nigrosome-1 region in all subjects may help to improve diag- nostic accuracy. This study explored the diagnostic utility of high-resolution QSM images combined with histogram anal-
ysis for detecting early-stage IPD patients and healthy subjects.
METHODS
This retrospective study was approved by the Institutional Review Board (GDIRB2016-18).
Participants
All of the patients and healthy subjects gave written informed consent. We enrolled 38 patients with IPD from our move- ment disorder clinic from December 2014 to May 2016 (aged 68.3±9.2 years, mean±standard deviation; 21 males and 17 females). The clinical diagnosis was based on the UK Parkin- son’s Disease Society Brain Bank Clinical Diagnostic Criteria.17 All patients underwent N-3-fluoropropyl-2-β-carbomethoxy- 3-β-(4-iodophenyl)nortropane positron-emission tomogra- phy (Biograph-6, Siemens, Elrlangen, Germany) for the ini- tial diagnosis in order to rule out secondary parkinsonism.
The Hoehn and Yahr stage18 and the score on the Unified Par- kinson Disease Rating Scale, Part III (UPDRS III) were de- termined by an experienced neurologist in order to evaluate the severity of motor symptoms. All patients were de novo IPD without medication when they were assessed based on both neurological examinations and imaging studies.
The following exclusion criteria for the patients were ap- plied: 1) symptoms or signs suggestive of atypical parkinson- ism (e.g., cerebellar abnormality, severe orthostatic hypoten- sion, vertical supranuclear gaze palsy, or ideomotor apraxia);
2) dementia; 3) neurological disorders other than IPD; 4) oth- er potential causes of parkinsonism such as metabolic de- rangement or structural brain lesions; 5) infarction, hemor- rhage, tumors, trauma, or severe white-matter hyperintensity (deep white-matter lesions larger than 25 mm, or caps or bands larger than 10 mm); 6) a history of taking drugs that are known to cause parkinsonism; or 7) contraindications to MRI.
Twenty-five healthy subjects were recruited (aged 65.0±
6.3 years; 11 males and 14 females) from among the spouses of the patients and the family members of the hospital em- ployees. The inclusion criteria for the healthy subjects were 1) older than 40 years, 2) no history of neurological or psy- chiatric diseases, 3) no family history of movement disor- ders, and 4) normal cognition without subjective memory impairment, as indicated by a score in the Mini Mental State Examination (MMSE) of >26. The demographic and clinical characteristics of the participants are summarized in Table 1.
MRI image acquisition
All participants underwent MRI in a 3-T scanner with a 32- channel coil (MAGNETOM Skyra, Siemens Healthcare, Forch- heim, Germany). Whole-brain sagittal three-dimensional (3D)
Diagnosis of IPD Using High-Resolution QSM
JCN
magnetization-prepared rapid gradient-echo (MP-RAGE) imaging was initially performed with the following parame- ters: repetition time (TR)=1,800 ms, echo time (TE)=3 ms, inversion time (TI)=920 ms, matrix=256×256 pixels, field of view (FOV)=250×250 pixels (1-mm isovoxels), accelera- tion factor=2, and acquisition time=3 minutes and 36 sec- onds. Oblique coronal 3D multiecho data image combination (MEDIC), which generates a combined image of multiecho gradient-recalled echo images, was performed parallel to the plane from the posterior commissure and the top of the pons, as located using sagittal MP-RAGE imaging.6 The scanning parameters for MEDIC were as follows: TR=88 ms, mini- mum TE=11.1 ms, maximum TE=66.9 ms, six echoes, echo spacing=11.1 ms, flip angle=10°, echo train length=6, thick- ness=1 mm, number of sections=28, matrix=384×384 pix- els, FOV=192×192 (spatial resolution=0.5×0.5×1 mm3), acceleration factor=2, and acquisition time=7 minutes and 19 seconds.
Quantification of susceptibility in the SN of IPD patients and healthy subjects
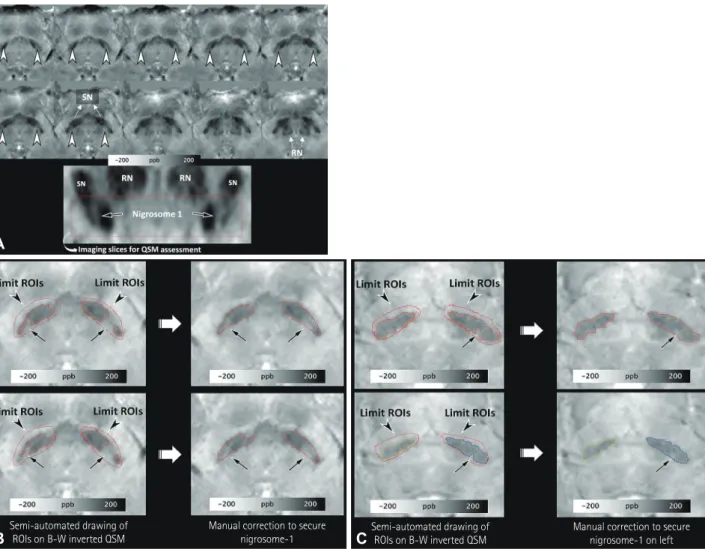
After performing the reconstruction and normalization of QSM (Supplementary Fig. 2 and a document in the online- only Data Supplement), the normalized QSM images were transferred to Analyze® (version 12.0, AnalyzeDirect, Over- land Park, KS, USA) for the semiautomated drawing of the ROIs. Since the main part of nigrosome-1 is present below the level of the red nucleus, and nigrosome-1 and nigrosome-4 are in close proximity above the level of the red nucleus,19,20 a neuroradiologist drew the ROIs from the level of the lower border of the red nucleus to the lowermost region of the SN with higher susceptibility values compared to the adjacent re- gions (Fig. 1A). Another investigator (an MRI physicist with 2 years of experience performing research into parkinsonism) independently made the same measurements in order to as-
sess the degree of interrater agreement.
All voxels were segmented with a threshold of 80–300 ppb to select the SN. The threshold was determined by the first investigator, who observed that the values could include the lower part of the SN in 10 participants. Each side was select- ed separately. The investigators were asked to determine the part with lower susceptibility values within the presumed SN–
which presumably consisted of the normal nigrosome-1 with or without other nigrosomes–by manual correction (Fig. 1B and C). Such manual correction was limited to the dorsolat- eral portion of the SN in order to avoid the inadvertent in- clusion of other regions.
After combining the segmented voxels on each side, the mean susceptibility value and the proportions of voxels with susceptibility values lower than 80, 75, 70, 65, and 60 ppb were calculated for the histogram analysis. The segmented SN regions on the right and left that had higher mean susceptibil- ity values and fewer voxels with susceptibility values lower than 80, 75, 70, 65, and 60 ppb were chosen for comparisons between the patients with IPD and the healthy subjects.
Visual assessments of susceptibility map-weighted imaging
The reconstructed susceptibility map-weighted imaging (SMWI) images (Supplementary Material in the online-only Data Supplement) were resliced using the same method that was applied to the QSM images. A neuroradiologist and a neurologist independently reviewed images while blinded to other clinical information. To minimize any recall bias, the neuroradiologist assessed images 2 months after quanti- fying the susceptibility in the SN. The signal intensity of the nigrosome-1 region was compared with that of the white matter lateral to the decussation of the superior cerebellar peduncles, and was classified into three grades: normal (iso- or hyperintensity), possibly abnormal (hypointensity in Table 1. Demographic and clinical characteristics
IPD patients (n=38) Healthy subjects (n=25) p
Age, years 68.3±9.2 [40–83] 65.0±6.3 [46–76] 0.123*
Female sex, n (%) 17 (44.7) 14 (56) 0.382†
MMSE 27 (22.5–28.0) 29 (28–30) <0.001*
Disease duration, months 12 (4.5–22.5) - -
H&Y stage, 1 / 2 12 / 26 - -
UPDRS I 1 (0–4) - -
UPDRS II 6.5 (3.7) - -
UPDRS III 17.6 (7.7) - -
Data are mean±standard-deviation [range] values for normally distributed variables, median (interquartile range) values for nonnormally distributed variables, or n (%) values.
*Independent t-test, †chi-square test.
H&Y: Hoehn and Yahr, IPD: idiopathic Parkinson’s disease, MMSE: Mini Mental State Examination, UPDRS: Unified Parkinson Disease Rating Scale, -: not applicable.
Kim EY et al.
JCN
<50% of the nigrosome-1 region), and definitely abnormal (hypointensity in ≥50% of the nigrosome-1 region).5,6 Each side was rated separately in each subject. For a simplified sta- tistical analysis, the images of a participant were reclassified as abnormal if any abnormality was identified on either side of the nigrosome-1 region, while it was considered normal when the nigrosome-1 was determined to be normal bilaterally. Any discrepancy between the two raters was resolved by consensus.
Statistical analyses
The chi-square test was used to compare the sex distribution between the patients with IPD and the healthy subjects. The Mann-Whitney U test or independent t-test was applied ac- cording to the normality of the results for each continuous variable, including the age, MMSE score, mean susceptibility, and proportion of voxels with susceptibility values lower
than 80, 75, 70, 65, and 60 ppb. The areas under the receiver operating characteristics (ROC) curves were compared for the mean susceptibility values and the proportions of voxels with susceptibility values lower than 80, 75, 70, 65, and 60 ppb using MedCalc (version 16.8.4, Mariakerke, Belgium), based on the method developed by DeLong et al.21 The diag- nostic results were compared between the two investigators using the intraclass correlation coefficient, Bland-Altman plots, and the McNemar test. The diagnostic performances of QSM combined with histogram analysis and visual assess- ments of SMWI were compared using ROC curves. The cutoff for statistical significance was set at p<0.05. Statistical analyses were conducted with SPSS Statistics (version 23, IBM Corp., Armonk, NY, USA).
Fig. 1. Semiautomated drawing of ROIs on negative monochrome QSM images. ROIs are first drawn within the SN below the level of the inferior border of the RN on axial oblique QSM images [A, nigrosome-1 regions are hyperintense and indicated by arrowheads on axial oblique QSM images (upper two rows) and are indicated by arrows on the oblique-coronal reformatted image (lower row)]. After delimiting the SN, ROIs are drawn semi- automatically with a threshold of 80–300 ppb. The unselected regions (arrows in B and C) in the dorsolateral aspect of the SN are considered the re- gions that include intact nigrosome-1, and were manually identified at two different image levels below the RN in both healthy subjects (B) and early- stage idiopathic Parkinson’s disease patients (C). QSM: quantitative susceptibility mapping, RN: red nucleus, ROI: region of interest, SN: substantia nigra.
Semi-automated drawing of ROIs on B-W inverted QSM
Manual correction to secure
nigrosome-1 Semi-automated drawing of ROIs on B-W inverted QSM
Manual correction to secure nigrosome-1 on left
A
B C
Diagnosis of IPD Using High-Resolution QSM
JCN
RESUlTS
Comparison of susceptibility values between patients with IPD and healthy subjects
Table 2 summarizes the differences in the mean susceptibility values and the proportions of voxels with susceptibility val- ues lower than 80, 75, 70, 65, and 60 ppb in the lower part of the SN between the patients with IPD and the healthy con- trol subjects. All six parameters differed significantly be- tween the two groups (all p<0.0001). Table 3 summarizes the areas under the ROC curves and the diagnostic sensitivity, specificity, and the optimal thresholds for the mean suscepti- bility and the proportions of voxels with susceptibility values lower than 80, 75, 70, 65, and 60 ppb. The mean susceptibility with an optimal threshold of 109.25 ppb yielded 4 false-pos- itive results out of 25 healthy subjects (16%) and 5 false-neg- ative results out of 36 IPD patients (13.9%). The threshold of 1.9% for the proportion of voxels with susceptibility values lower than 70 ppb showed a sensitivity of 100% and a speci- ficity of 100% without overlap between the patients with IPD and the healthy subjects, and both the diagnostic sensi- tivity and specificity decreased for lower thresholds (Supple- mentary Fig. 3 in the online-only Data Supplement). On the other hand, the mean susceptibility values overlapped between the two groups (Fig. 2). The ROC curves differed significant- ly between the mean susceptibility values and the propor-
tion of voxels with susceptibility values lower than 70 ppb (p=0.0183) (Fig. 3).
Interrater agreement
The measurements made by the second investigator were compared with those made by the first investigator for the proportion of voxels with susceptibility values lower than 70 ppb, which revealed a significant correlation on both sides (intraclass correlation coefficient=0.844 and 0.895 on the right and left, respectively; both p<0.0001). The Bland-Alt- man plots for the right and left sides showed that most mea- surements were within the upper and lower 95% limits of agreement (Supplementary Fig. 4 in the online-only Data Supplement). When applying the optimal threshold of 1.9%
for the proportion of voxels with susceptibility values lower than 70 ppb as determined by the first investigator, the mea- surements made by the second investigator produced one false-positive and one false-negative result, thereby exhibit- ing no significant difference from those made by the first investigator (p>0.05).
Visual assessments of SMWI
There were three differences in the interpretations of SMWI made by the two raters (k=0.894), which were resolved by con- sensus. All of the IPD patients were correctly diagnosed, while five healthy subjects (20%) were considered abnormal;
Table 2. Mean susceptibility and proportions of voxels with susceptibility values lower than 60, 65, 70, 75, and 80 ppb in the lower part of the sub- stantia nigra between the patients with IPD and the healthy subjects
IPD patients (n=36) Healthy subjects (n=25) p
Mean susceptibility, ppb 125.81±16.27 98.41±11.70 <0.0001*
Proportion of voxels <60 ppb, % 0.00 (0.00–0.00)‡ 5.57 (2.78–15.26)‡ <0.0001†
Proportion of voxels <65 ppb, % 0.00 (0.00–0.16)‡ 8.46 (4.38–18.99)‡ <0.0001†
Proportion of voxels <70 ppb, % 0.00 (0.00–0.23)‡ 10.67 (5.98–21.57)‡ <0.0001†
Proportion of voxels <75 ppb, % 0.11 (0.00–0.50)‡ 15.76 (9.16–27.09)‡ <0.0001†
Proportion of voxels <80 ppb, % 0.31 (0.00–1.07)‡ 21.43 (15.34–34.27)‡ <0.0001†
*Independent t-test, †Mann-Whitney U test, ‡Data are median (interquartile range) values.
IPD: idiopathic Parkinson’s disease.
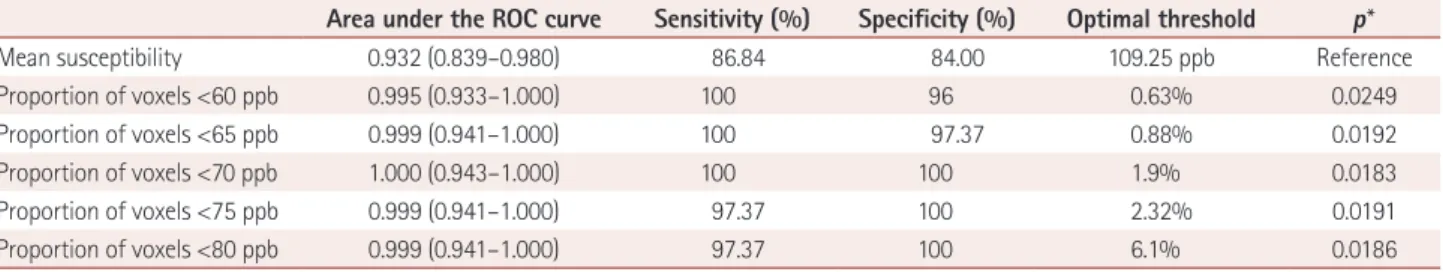
Table 3. Areas under the ROC curves, diagnostic sensitivity and specificity, and the optimal thresholds for mean susceptibility and the proportion of voxels with susceptibility values lower than 60, 65, 70, 75, and 80 ppb
Area under the ROC curve Sensitivity (%) Specificity (%) Optimal threshold p*
Mean susceptibility 0.932 (0.839–0.980) 86.84 84.00 109.25 ppb Reference
Proportion of voxels <60 ppb 0.995 (0.933–1.000) 100 96 0.63% 0.0249
Proportion of voxels <65 ppb 0.999 (0.941–1.000) 100 97.37 0.88% 0.0192
Proportion of voxels <70 ppb 1.000 (0.943–1.000) 100 100 1.9% 0.0183
Proportion of voxels <75 ppb 0.999 (0.941–1.000) 97.37 100 2.32% 0.0191
Proportion of voxels <80 ppb 0.999 (0.941–1.000) 97.37 100 6.1% 0.0186
Data are median and 95% confidence-interval values.
*Pairwise comparisons of ROC curves with that for the mean susceptibility.
ROC: receiver operating characteristics.
Kim EY et al.
JCN
those false-positive subjects exhibited small proportions of voxels with susceptibility values lower than 70 ppb in the ni- grosome-1 region (Supplementary Fig. 5 in the online-only Data Supplement). The ROC curves differed significantly be- tween the visual assessments of SMWI and the proportions of voxels with susceptibility values lower than 70 ppb (p=0.0143).
DISCUSSION
This study demonstrated that QSM at a high spatial resolu- tion combined with histogram analysis of the lower part of the SN can improve the diagnostic differentiation between early-stage IPD patients and healthy subjects. This improve-
ment in diagnostic performance was achieved by consider- ing several factors. We drew ROIs below the level of the red nucleus to include only the part of the SN that contains nigro- some-1. Such limited ROIs were also used by Azuma et al.,13 who drew ROIs in the anterior, middle, and posterior SN regions below the level of the red nucleus in coronally refor- matted QSM. We acknowledge that their method is reason- able because the upper border of the SN is not clearly defined in conventional MRI, and the most important structure for evaluating IPD (nigrosome-1) is located in the dorsolateral aspect of the SN. Unlike their method, we performed high- spatial-resolution QSM in the imaging plane perpendicular to the axis of nigrosome-1, which helped our investigators to determine normal nigrosome-1 regions in the SN on both sides of healthy subjects and the normal or less-affected SN regions of IPD patients. We also utilized histogram analysis to improve the diagnostic accuracy.
As reported previously,10,11,13-15 healthy subjects may exhib- it higher susceptibility values in the dorsolateral part of the SN that would lead to false-positive interpretations of nigro- some-1 images.2,4-6 Our study also identified this problem in 5 of 25 healthy subjects, which is a higher proportion than in most previous studies but lower than that in a recent study.22 This higher prevalence of false-positive findings in our study may have been due to differences between the imaging meth- ods used in previous studies and the SMWI that we used. The higher contrast-to-noise ratio of SMWI may help to improve the diagnostic sensitivity,23 but it may also increase the rate of false-positive results.
While it has previously been demonstrated that the visual assessment of nigrosome-1 or dorsolateral nigral hyperinten- sity at 3 T can show perfect diagnostic sensitivity,2,6 the report- ed specificity has been lower, ranging from 83.6% to 85.0%;5,6,24 such a trade-off between sensitivity and specificity is com-
IPD Normal 200
175 150 125 100 75 50
Mean susceptibility (ppb)
IPD Normal
IPD Normal
Magnified 50
40 30 20 10 0 -10
Proportion of voxels <70 ppb
2 1 0 -1
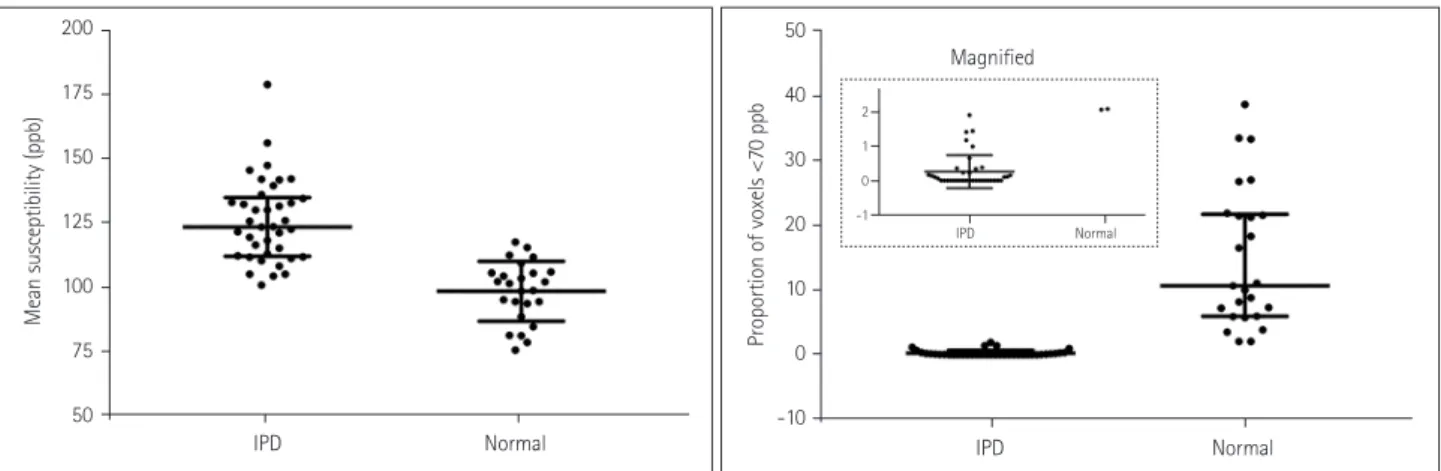
Fig. 2. Mean susceptibility values and the proportions of voxels with susceptibility values lower than 70 ppb for patients with IPD and the healthy subjects. The mean susceptibility values overlapped between the two groups, whereas the proportions of voxels with susceptibility values lower than 70 ppb did not (see the inset). The horizontal lines indicate the median and interquartile-range values. IPD: idiopathic Parkinson’s disease.
Fig. 3. Receiver operating characteristics curves for mean suscepti- bility and the proportions of voxels with susceptibility values lower than 60, 65, 70, 75, and 80 ppb.
0 20 40 60 80 100 100-specificity
Mean susceptibility Proportion <60 ppb Proportion <65 ppb Proportion <70 ppb Proportion <75 ppb Proportion <80 ppb 100
80
60
40
20
0
Sensitivity
Diagnosis of IPD Using High-Resolution QSM
JCN
monly observed in medical research. Moreover, the diagnos- tic sensitivities in previous visual assessments of a similar re- gion at 3 T were relatively low, at approximately 88%.24,25 We addressed this limitation by adopting histogram analysis, which yielded perfect discrimination between the two groups using a threshold determined by the proportion of voxels with susceptibility values lower than 70 ppb. Our technique may have implications for improving the diagnostic specificity by reducing the rate of false-positive findings.
Despite our efforts to draw ROIs in the SN from the level of the inferior border of the red nucleus down to the lower- most region of higher susceptibility on QSM in order to de- termine the nigrosome-1 region, these areas may have includ- ed the nigrosome-3 region. However, that region is relatively small, exhibits lower susceptibility, and is in close proximity to the posterior border of the SN.20 The nigrosome-3 region may therefore be indistinguishable from the adjacent mid- brain area outside the SN, and is unlikely to be included with- in the ROIs in healthy or less-affected SN cases, although it may be included in the affected SN due to its higher suscep- tibility.
A quantitative assessment for determining the presence or absence of abnormalities in the SN with QSM at a high spa- tial resolution is more desirable than a visual assessment, par- ticularly when a suspicious abnormality has been observed in a visual assessment of nigrosome-1 in SMWI or another method. However, our method has the following downsides:
it requires normal-looking nigrosome-1 regions to be iden- tified by manual correction of the ROIs, and it is slower than simple visual assessments. Lastly, although we found good agreement between the assessments made by the two review- ers in our study, there were still a few discrepancies. Therefore, a better segmentation or fully automated method should be developed to improve the reproducibility and diagnostic accuracy.
This study was subject to several limitations. First, it had a retrospective single-center design. Second, the number of patients enrolled was relatively small. Third, we did not enroll patients with atypical parkinsonism. We surmised that pa- tients exhibiting multiple system atrophy with predominant parkinsonism and progressive supranuclear palsy may also show abnormalities similar to those associated with IPD, as suggested in recent studies.22,25-27 Fourth, despite its utility, the results of QSM have been shown to depend on the specif- ic methods and parameters used in the reconstruction process.
It might therefore be necessary to determine the optimal threshold if a user applies different QSM options or algorithms for reconstruction. Fifth, QSM involves relative measurements that require a reference ROI for determining the relative sus- ceptibility values. In this study, we used the decussation of the
superior cerebellar peduncle as a reference on the assumption that this structure is not affected by IPD, and the threshold would need to be adjusted accordingly if another reference is used. Finally, confirmation of the abnormalities of the SN in QSM using histopathological examinations may improve the confidence of the findings. Conducting such imaging-pa- thology correlation studies focused on the correlation be- tween a histogram analysis and the extent of degeneration in the nigrosome-1 region would be important. However, this would be quite challenging to do with a sizable number of patients.
In summary, QSM at a high spatial resolution combined with histogram analysis in the lower part of the SN below the level of the red nucleus may provide better differentiation of early-stage IPD patients from normal subjects compared with measurements of the mean susceptibility values in the SN using QSM.
Supplementary Materials
The online-only Data Supplement is available with this arti- cle at https://doi.org/10.3988/jcn.2018.14.1.90.
Conflicts of Interest
The authors have no financial conflicts of interest.
Acknowledgements
This research was supported by the Brain Research Program through the National Research Foundation of Korea (NRF) funded by the Ministry of Science, ICT & Future Planning (grant no. NRF-2015M3C7A1031969), a grant of the Korea Healthcare Technology R&D Project through the Ko- rea Health Industry Development Institute (KHIDI) funded by the Min- istry of Health & Welfare, Republic of Korea (grant no. HI14C1135), and the Gachon University research fund of 2015 (grant no. GCU-2015-5033).
REFERENCES
1. Blazejewska AI, Schwarz ST, Pitiot A, Stephenson MC, Lowe J, Bajaj N, et al. Visualization of nigrosome 1 and its loss in PD: pathoana- tomical correlation and in vivo 7 T MRI. Neurology 2013;81:534-540.
2. Schwarz ST, Afzal M, Morgan PS, Bajaj N, Gowland PA, Auer DP. The
‘swallow tail’ appearance of the healthy nigrosome-a new accurate test of Parkinson’s disease: a case-control and retrospective cross-sectional MRI study at 3T. PLoS One 2014;9:e93814.
3. Cosottini M, Frosini D, Pesaresi I, Costagli M, Biagi L, Ceravolo R, et al. MR imaging of the substantia nigra at 7 T enables diagnosis of Par- kinson disease. Radiology 2014;271:831-838.
4. Cosottini M, Frosini D, Pesaresi I, Donatelli G, Cecchi P, Costagli M, et al. Comparison of 3T and 7T susceptibility-weighted angiography of the substantia nigra in diagnosing Parkinson disease. AJNR Am J Neuroradiol 2015;36:461-466.
5. Noh Y, Sung YH, Lee J, Kim EY. Nigrosome 1 detection at 3T MRI for the diagnosis of early-stage idiopathic Parkinson disease: assessment of diagnostic accuracy and agreement on imaging asymmetry and clinical laterality. AJNR Am J Neuroradiol 2015;36:2010-2016.
6. Sung YH, Noh Y, Lee J, Kim EY. Drug-induced Parkinsonism versus idiopathic Parkinson disease: utility of nigrosome 1 with 3-T imaging.
Radiology 2016;279:849-858.
7. Deh K, Nguyen TD, Eskreis-Winkler S, Prince MR, Spincemaille P,
Kim EY et al.
JCN
Gauthier S, et al. Reproducibility of quantitative susceptibility map- ping in the brain at two field strengths from two vendors. J Magn Re- son Imaging 2015;42:1592-1600.
8. Lin PY, Chao TC, Wu ML. Quantitative susceptibility mapping of hu- man brain at 3T: a multisite reproducibility study. AJNR Am J Neuro- radiol 2015;36:467-474.
9. Barbosa JH, Santos AC, Tumas V, Liu M, Zheng W, Haacke EM, et al.
Quantifying brain iron deposition in patients with Parkinson’s disease using quantitative susceptibility mapping, R2 and R2*. Magn Reson Imaging 2015;33:559-565.
10. He N, Ling H, Ding B, Huang J, Zhang Y, Zhang Z, et al. Region-spe- cific disturbed iron distribution in early idiopathic Parkinson’s disease measured by quantitative susceptibility mapping. Hum Brain Mapp 2015;36:4407-4420.
11. Murakami Y, Kakeda S, Watanabe K, Ueda I, Ogasawara A, Moriya J, et al. Usefulness of quantitative susceptibility mapping for the diagno- sis of Parkinson disease. AJNR Am J Neuroradiol 2015;36:1102-1108.
12. Acosta-Cabronero J, Cardenas-Blanco A, Betts MJ, Butryn M, Valdes- Herrera JP, Galazky I, et al. The whole-brain pattern of magnetic sus- ceptibility perturbations in Parkinson’s disease. Brain 2017;140:118- 13. Azuma M, Hirai T, Yamada K, Yamashita S, Ando Y, Tateishi M, et al. 131.
Lateral asymmetry and spatial difference of iron deposition in the sub- stantia nigra of patients with Parkinson disease measured with quanti- tative susceptibility mapping. AJNR Am J Neuroradiol 2016;37:782- 788.
14. Du G, Liu T, Lewis MM, Kong L, Wang Y, Connor J, et al. Quantitative susceptibility mapping of the midbrain in Parkinson’s disease. Mov Disord 2016;31:317-324.
15. Langkammer C, Pirpamer L, Seiler S, Deistung A, Schweser F, Fran- thal S, et al. Quantitative susceptibility mapping in Parkinson’s disease.
PLoS One 2016;11:e0162460.
16. Guan X, Xuan M, Gu Q, Huang P, Liu C, Wang N, et al. Regionally progressive accumulation of iron in Parkinson’s disease as measured by quantitative susceptibility mapping. NMR Biomed 2017;30:e3489.
17. Hughes AJ, Daniel SE, Kilford L, Lees AJ. Accuracy of clinical diagno-
sis of idiopathic Parkinson’s disease: a clinico-pathological study of 100 cases. J Neurol Neurosurg Psychiatry 1992;55:181-184.
18. Hoehn MM, Yahr MD. Parkinsonism: onset, progression, and mor- tality. Neurology 1967;17:427-442.
19. Damier P, Hirsch EC, Agid Y, Graybiel AM. The substantia nigra of the human brain. I. Nigrosomes and the nigral matrix, a compart- mental organization based on calbindin D(28K) immunohistochem- istry. Brain 1999;122:1421-1436.
20. Massey LA, Miranda MA, Al-Helli O, Parkes HG, Thornton JS, So PW, et al. 9.4 T MR microscopy of the substantia nigra with pathologi- cal validation in controls and disease. Neuroimage Clin 2016;13:154- 21. DeLong ER, DeLong DM, Clarke-Pearson DL. Comparing the areas 163.
under two or more correlated receiver operating characteristic curves:
a nonparametric approach. Biometrics 1988;44:837-845.
22. Wang N, Yang H, Li C, Fan G, Luo X. Using 'swallow-tail' sign and putaminal hypointensity as biomarkers to distinguish multiple system atrophy from idiopathic Parkinson’s disease: a susceptibility-weighted imaging study. Eur Radiol 2017;27:3174-3180.
23. Nam Y, Gho SM, Kim DH, Kim EY, Lee J. Imaging of nigrosome 1 in substantia nigra at 3T using multiecho susceptibility map-weighted imaging (SMWI). J Magn Reson Imaging 2017;46:528-536.
24. Bae YJ, Kim JM, Kim E, Lee KM, Kang SY, Park HS, et al. Loss of Ni- gral Hyperintensity on 3 Tesla MRI of Parkinsonism: comparison with (123) I-FP-CIT SPECT. Mov Disord 2016;31:684-692.
25. Reiter E, Mueller C, Pinter B, Krismer F, Scherfler C, Esterhammer R, et al. Dorsolateral nigral hyperintensity on 3.0T susceptibility-weight- ed imaging in neurodegenerative Parkinsonism. Mov Disord 2015;30:
1068-1076.
26. Frosini D, Ceravolo R, Tosetti M, Bonuccelli U, Cosottini M. Nigral involvement in atypical parkinsonisms: evidence from a pilot study with ultra-high field MRI. J Neural Transm (Vienna) 2016;123:509-513.
27. Oustwani CS, Korutz AW, Lester MS, Kianirad Y, Simuni T, Hijaz TA.
Can loss of the swallow tail sign help distinguish between Parkinson Disease and the Parkinson-Plus syndromes? Clin Imaging 2017;44:
66-69.