Introduction
Type 1 diabetes (T1D) mellitus is one of the most common endocrine and metabolic conditions in childhood.1) In Egypt, its incidence is 8/100000 per year in children under the age of 15 years.2)
Studies on adults have reported that patients with T1D show ultra-structural and functional myocardial deterioration.3) Simi- larly, it has been reported that young patients with T1D have significant changes in left ventricular dimension and myocar- dial relaxation.4) Diabetic cardiomyopathy (DCM) as a distinct clinical entity continues to be the subject of debate since it was first introduced by Rubler et al.5) in 1972. By definition, DCM is a distinct primary disease process which develops sec-
www.kse-jcu.org https://doi.org/10.4250/jcu.2017.25.1.12
ORIGINAL ARTICLE J Cardiovasc Ultrasound 2017;25(1):12-19
• Received: September 20, 2016 • Revised: January 12, 2017 • Accepted: February 21, 2017
• Address for Correspondence: Aya M Fattouh, Department of Pediatrics, Faculty of Medicine, Cairo University, 9157 Adel Ghonaim Street, 8th District, Elhadabah Elwosta, Mokattam, Cairo 11439, Egypt Tel: +20-1001572630, Fax: +20-23646718, E-mail: [email protected]
• This is an Open Access article distributed under the terms of the Creative Commons Attribution Non-Commercial License (http://creativecommons.org/licenses/by-nc/4.0) which permits unrestricted non-commercial use, distribution, and reproduction in any medium, provided the original work is properly cited.
ondary to a metabolic insult, resulting in structural and func- tional abnormalities of the myocardium leading to heart fail- ure.6) The most frequent and earliest detectable functional abnormality in DCM is impaired diastolic function.7) The ear- ly reductions in diastolic performance have been found to be followed by progressive reductions in systolic function during the later stages of DCM.8)
Echocardiography is a non-invasive method that can be used for the diagnosis of DCM or diabetes induced myocardial dys- function. Tissue Doppler echocardiography is a modality of echocardiography which proved to have additional value in the evaluation of ventricular filling in diabetic patients.3)
Conventional and tissue Doppler echocardiography can pre-
Evaluation of Cardiac Functions in Children and Adolescents
with Type 1 Diabetes
Faten M Abd-El Aziz, MD, Shereen Abdelghaffar, MD Eman M Hussien, MSc, and Aya M Fattouh, MD
Department of Pediatrics, Faculty of Medicine, Cairo University, Cairo, Egypt
Background: Cardiac dysfunction in patients with type 1 diabetes (T1D) represents one of the serious complications. To eval- uate the cardiac function in children with T1D by conventional echocardiography and tissue Doppler imaging (TDI).
Methods: The study included 40 T1D patients (age between 6 and 16 years) with > 5 years duration of diabetes and 42 healthy control children. The patients were subjected to clinical evaluation and laboratory investigations [glycosylated hemoglobin A1c (HbA1c), serum lipids and lipoproteins]. Conventional echocardiography and TDI were performed to patients and controls.
Results: The patients had lower early diastolic filling velocity (E wave) of the tricuspid valve and mitral valves with a p value of (0.000 and 0.006, respectively). TDI revealed that patients had lower S’velocity of the T1D, shorter isovolumic contraction time, longer isovolumic relaxation time and lower E/E’ of the right ventricle than controls (p value 0.002, 0.001, 0.004, 0.003, and 0.016, respectively). The left ventricle (LV)-T1D of the patients was significantly higher (p value 0.02). Twenty eight patients had poor glycemic control without significant differences between them and those with good glycemic control regarding echo- cardiographic data. Patients with dyslipidemia (13 patients) had higher late diastolic filling velocity of the mitral valve (A) and the lower LV late tissue velocity (A’) (p wave 0.047 and 0.015). No correlation existed between the duration of illness or the level of HbA1c and the echocardiographic parameters.
Conclusion: Diabetic children have evidence of echocardiographic diastolic dysfunctions. Periodic cardiac evaluation with both conventional and tissue Doppler echocardiography is recommended for early detection of this dysfunction.
KEY WORDS: Tissue Doppler echocardiography · Type 1 diabetes · Children · Diabetic cardiomyopathy.
dict early stages and progression of diabetic cardiac changes.9) However, studies which evaluated the use of tissue Doppler in detection of cardiac dysfunction in children with T1D are few and conflicting.
The aim of the present study is to assess right and left ven- tricular functions using conventional and tissue Doppler echo- cardiography in children and adolescents with T1D.
Methods Study design
This cross sectional study included 40 patients (age between 6 and 16 years) with T1D and receiving insulin injection for duration more than 5 years and 42 controls matched for age and sex. Patients with signs of major complications such as re- nal, retinal or neurological disease were excluded. Patients with concomitant illness affecting cardiac function, medica- tions known to affect cardiac functions or those with congeni- tal heart disease were also excluded from the study. The con- trols were volunteers, friends, or neighbors of patients, workers or nurses in the hospital. They were matched prospectively for age, gender, and body mass index (BMI). Full physical exami- nation including cardiac examination and blood pressure (BP) measurement, as well as echocardiography performed before recruiting them to ensure that they do not have an underlying cardiac problem. Informed consent was obtained from all in- cluded patients and controls. The study was approved by the Institutional Ethical Committee.
Methodology
Clinical evaluation
All children fulfilling the inclusion criteria were subjected to full history taking including: cardiac manifestations (history of palpitation, chest pain, hypertension and exertion on exer- cise and manifestations of heart failure), dietary habits, exercise habits and efforts to modify life style habits. Thorough clinical examination was performed. BP measurement (supine, sitting, and standing for detection of autonomic dysfunction). The mea- surements were plotted on the BP percentiles of BP of chil- dren.10) Body weight (kg) and height (m) to calculate BMI (kg/
m2) were measured and percentiles were assessed using Egyp- tian growth curves.11) Thorough cardiac examination was per- formed to detect cardiomegaly or manifestations of heart failure.
Laboratory evaluation
Glycosylated hemoglobin A1c (HbA1c), serum total choles- terol (TC), triglycerides (TG), low density lipoproteins (LDL) cholesterol and high density lipoproteins (HDL) cholesterol were measured for all patients. In nondiabetic patients, HbA1c is usually < 6%, whereas in diabetic patients, values of 6–7.9% represent good metabolic control; values of 8–9.9%
represent fair metabolic control; and values of HbA1c ≥ 10%
represent poor metabolic control.12) Dyslipidemia was defined by the American Diabetes Association13) as having LDL-cho- lesterol > 100 mg/dL, HDL-cholesterol < 40 mg/dL (males) and < 50 mg/dL (females), TC > 200 mg/dL and TG > 150 mg/
dL; and dyslipidemia was considered present if one or more of these lipid or lipoprotein levels are abnormal.14)
Electrocardiography
Twelve leads electrocardiography was performed for assessment of heart rate, rhythm, P-R interval and corrected Q-T interval.
Echocardiography & tissue Doppler study
Echocardiography was performed for all cases and controls in the supine, left lateral position using General Electric (GE, Viv- id-5, Horton, Norway) system with probe 3 or 5 MHz (multi- frequency transducer) according to the age of patient, having tissue velocity imaging capabilities.
The electrocardiography cable was connected to the ultra- sound machine to define and to time the cardiac cycle events. The examination was performed by a pediatric cardiologist expert in echocardiography and tissue Doppler imaging (TDI) in ac- cordance with the recommendations of the American Society of Echocardiography.15)
The examination consisted of M-mode, two dimensional, pulsed-wave, and color Doppler blood flow velocity measure- ments of the heart valves. Trans-mitral and trans-tricuspid flows were obtained with pulsed wave Doppler at the leaflet tips;
early diastolic inflow velocity (E), velocity during active atrial contraction (A), E to A wave (E/A) ratio, and deceleration time were measured.
TDI was obtained from the four chambers apical view, and tissue velocities were calculated. Using pulsed tissue velocity indices, the sample volumes were placed in the lateral sides of the mitral and tricuspid annuluses and the base of the inter- ventricular septum (IVS). The peak systolic and early and late diastolic velocities (E’ and A’, respectively) at these points were measured, and the E/E’ ratio was calculated. The isovolumic relaxation time (IVRT) and isovolumic contraction time (IVCT) were both measured for both left ventricle (LV) and right ven- tricle (RV) lateral walls.
Calculation of global myocardial performance index (MPI) was performed by pulsed tissue velocity imaging. For tissue Doppler, all interval measurements were performed within one cardiac cycle. The MPI was calculated a’–b’/b’ where a’ is the time interval from the end of A’ wave to the onset of E’ wave and b’ the time from the onset to the end of the S’ wave.
To reduce the effect of respiration on tissue velocities and as breath holding was not applicable in young children, three car- diac cycles were, recorded, and the average velocity was calculat- ed. To reduce intraobserver variability three different measure- ments for each tissue Doppler index was done and the average was taken.
Left ventricular parameters were assessed and grading of LV
and RV diastolic dysfunction (DD) were performed.15)16) The patients were divided into two groups according to pres- ence of dyslipidemia and compared according to their echocar- diographic data to find any effect of dyslipidemia on cardiac echo parameters.
The patients were also divided into two groups according to their glycosylated HbA1c level and compared according to their echocardiographic data to find any effect of degree of gly- cemic control on cardiac echo parameters.
Correlations were done between the level of HbA1c, duration of diabetes and level of TG and the parameters of DD.
Statistical analysis
Data were statistically described in terms of mean ± stan- dard deviation (SD), median and range, or frequencies (num- ber of cases) and percentages when appropriate. Comparison of numerical variables between the study groups was done using Student t test for independent samples when data were nor- mally distributed and Mann Whitney U test for independent samples when not normally distributed. For comparing cate- gorical data, chi square (χ2) test was performed. Exact test was used instead when the expected frequency is less than 5. p val- ues less than 0.05 was considered statistically significant. All statistical calculations were done using computer program Sta- tistical Package for the Social Science (SPSS Inc., Chicago, IL, USA) release 15 for Microsoft Windows (2006).
Results
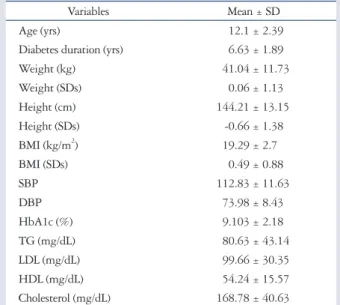
The mean age ± SD of the patients was 12.1 ± 2.39 versus 11.6 ± 1.23 for the controls (p value 0.235). The diabetes data of the patients included in this study are shown in Table 1 as
well as the comparison between the patients and controls re- garding the clinical data. None of our patients had cyanosis, palpitation or dyspnea at rest but there was 17.5% with exer- cise intolerance. Only a 16-year-old female patient with BMI26) and dyslipidemia had BP above 95th percentile. All patients had normal cardiac examination and normal cardio autonomic tests. There was positive family history of diabetes in 42.5%
of the patients. All the patients were receiving insulin.
Table 2 shows comparison between M-mode echocardio- graphic data of patients and controls. Dimensions of aorta, left atrium (LA), IVS, left ventricular posterior wall (LVPW), left ventricular internal diameter in diastole (LVIDd) and left ven- tricular internal diameter in diastole (LVIDs) were significant- ly higher in diabetic patients compared to controls (p value 0.000, 0.025, 0.000, 0.002, 0.000, and 0.000, respectively).
The fractional shortening (FS) was significantly lower in cases than controls (p value 0.033). Doppler echocardiographic study showed that the patients had significantly lower E and A waves
Table 1. Descriptive statistics of clinical and laboratory data of dia- betic patients
Variables Mean ± SD
Age (yrs) 12.1 ± 2.390
Diabetes duration (yrs) 6.63 ± 1.890
Weight (kg) 41.04 ± 11.73
Weight (SDs) 0.06 ± 1.130
Height (cm) 144.21 ± 13.15
Height (SDs) -0.66 ± 1.380
BMI (kg/m2) 19.29 ± 2.700
BMI (SDs) 0.49 ± 0.880
SBP 112.83 ± 11.63
DBP 73.98 ± 8.430
HbA1c (%) 9.103 ± 2.180
TG (mg/dL) 80.63 ± 43.14
LDL (mg/dL) 99.66 ± 30.35
HDL (mg/dL) 54.24 ± 15.57
Cholesterol (mg/dL) 168.78 ± 40.63
SDs: standard deviations, BMI: body mass index, SBP: systolic blood pres- sure, DBP: diastolic blood pressure, HbA1c: hemoglobin A1c, TG: triglyc- erides, LDL: low density lipoprotein, HDL: high density lipoprotein
Table 3. Comparison between pulsed wave echocardiography data of patients and controls
Variables Patients Controls
p-value Mean ± SD Mean ± SD
E tricuspid (m/sec) 00.61 ± 0.13 000.7 ± 0.13 0.023*
A tricuspid (m/sec) 00.43 ± 0.07 00.53 ± 0.15 0.006*
E/A ratio tricuspid 01.49 ± 0.28 01.35 ± 0.25 0.064 DT tricuspid (ms) 174.75 ± 38.23 166.73 ± 36.77 0.436 E mitral (m/sec) 0.94 ± 0.2 01.05 ± 0.13 0.019*
A mitral (m/sec) 0.51 ± 0.1 000.6 ± 0.17 0.054 E/A ratio mitral 01.85 ± 0.43 01.83 ± 0.39 0.863 DT mitral (ms) 150.81 ± 33.16 143.04 ± 30.69 0.362
*p < 0.05, significant diffrence. SD: standard deviation, E: E wave velocity, A:
A wave velocity, DT: deceleration time
Table 2. Comparison between M-mode echocardiography data of patients and controls
Variables Patients Controls
p-value Mean ± SD Mean ± SD
AO (mm) 22.8 ± 2.89 21.05 ± 3.38 0.047*
LA (mm) 24.93 ± 3.18 24.64 ± 3.58 0.754 RV (mm) 14.05 ± 2.97 14.23 ± 3.40 0.839 LVIDd (mm) 40.65 ± 4.61 36.91 ± 5.33 0.009*
LVIDs (mm) 26.65 ± 3.99 21.82 ± 4.17 0.001*
IVS (mm) 7.05 ± 1.21 6.36 ± 1.36 0.056
PW (mm) 6.73 ± 1.28 6.05 ± 1.29 0.053
FS (%) 40.08 ± 4.59 41.73 ± 8.69 0.270
EF (%) 67.53 ± 5.60 70.5 ± 8.74 0.160
*p < 0.05, significant diffrence. SD: standard deviation, AO: aorta, LA: left atrium, RV: right ventricle, LVIDd: left ventricular internal dimension during diastole, LVIDs: left ventricular internal dimension during systole, IVS: inter ventricular septum, PW: posterior wall, FS: fractional shorten- ing, EF: ejection fraction
velocity across both the tricuspid valve and the mitral valve than controls (p value 0.000, 0.000, 0.006, and 0.000, respec- tively) as shown in Table 3.
Table 4 shows the comparison between tissue Doppler echo- cardiographic data of patients and controls. The patients had lower S’ velocity of the RV and LV, shorter IVCT, longer IVRT and lower E/E’ of the RV than controls (p value 0.002, 0.001, 0.004, 0.003, and 0.016, respectively). The MPI of the LV of the patients was significantly higher than controls (p value 0.02).
Good glycemic control was achieved in 12 patients with HbA1c less than 7.5% while the rest of the patients had poor glycemic control. According to the patients’ lipid profile, they were grouped into two groups; 13 patients with dyslipidemia and 27 patients without dyslipidemia. Table 5 shows compar- ison between the M-mode and Doppler findings of patients with good and poor glycemic controls and patients with and without dyslipidemia. Patients with dyslipidemia had signifi- cantly higher A wave velocity of the mitral valve (p value 0.047).
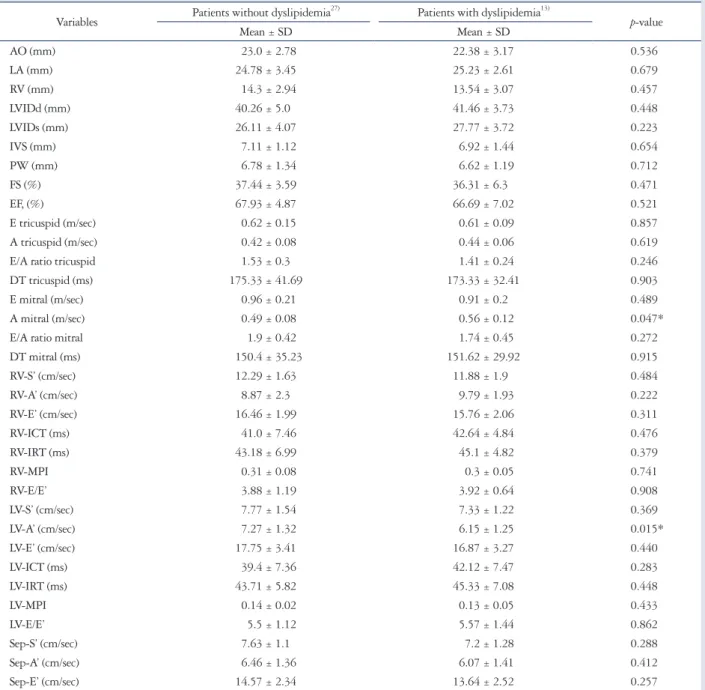
Table 6 shows comparison between tissue Doppler findings of patients with good and poor glycemic controls and patients with and without dyslipidemia. Patients with dyslipidemia had lower A’ velocity of the LV (p value 0.015).
No significant correlation was found between the duration of diabetes, level of HbA1c or the lipid profile of the patients and the echocardiographic parameters.
Discussion
DCM is defined as the cardiovascular damage present in di-
abetes patients, which is characterized by myocardial dilata- tion and hypertrophy, as well as a decrease in the systolic and diastolic function of the LV, and its presence is independent of the coexistence of ischemic heart disease or hypertension.17)
DD refers to abnormalities in ventricular relaxation and fill-
Table 4. Comparison between tissue Doppler echocardiography data of patients and controls
Variables Patients Controls
p-value Mean ± SD Mean ± SD
RV-S’ (cm/sec) 12.16 ± 1.71 13.25 ± 3.4 0.172 RV-A’ (cm/sec) 9.17 ± 2.20 10.06 ± 2.63 0.185 RV-E’ (cm/sec) 16.24 ± 2.02 17.38 ± 2.76 0.097 RV-ICT (ms) 41.53 ± 6.70 045.8 ± 9.9 0.080 RV-IRT (ms) 43.8 ± 6.37 35.76 ± 9.5 0.001*
RV-MPI 0.31 ± 0.07 00.27 ± 0.06 0.049*
RV-E/E’ 3.89 ± 1.02 04.13 ± 0.98 0.089
LV-S’ (cm/sec) 7.63 ± 1.44 09.13 ± 3.09 0.041*
LV-A’ (cm/sec) 6.91 ± 1.39 06.93 ± 2.17 0.963 LV-E’ (cm/sec) 17.47 ± 3.35 18.75 ± 3.89 0.200 LV-ICT (ms) 40.29 ± 7.41 42.74 ± 9.69 0.310 LV-IRT (ms) 44.24 ± 6.21 44.31 ± 12.02 0.978
LV-MPI 0.29 ± 0.03 00.27 ± 0.07 0.056
LV-E/E’ 5.52 ± 1.21 05.85 ± 1.47 0.425
Sep-S’ (cm/sec) 7.49 ± 1.17 07.59 ± 1.81 0.099 Sep-A’ (cm/sec) 6.33 ± 1.37 06.22 ± 2.59 0.053 Sep-E’ (cm/sec) 14.27 ± 2.41 14.65 ± 2.9 0.427
*p < 0.05, significant diffrence. SD: standard deviation, RV: right ventricle, ICT: isovolumic contruction time, IRT: isovolumic relaxation time, MPI:
myocardial performance index, LV: left ventricle, Sep: septal
Table 5. Comparison between patients with and without good gly- cemic control as regards M-mode, pulsed wave Doppler and tissue Doppler echocardiography data
Variables
Patients with HbA1c < 7.512)
Patients with HbA1c > 7.528) p-value Mean ± SD Mean ± SD
AO (mm) 23.42 ± 2.840 22.54 ± 2.920 0.383 LA (mm) 25.0 ± 3.240 24.89 ± 3.210 0.924 RV (mm) 14.5 ± 2.780 13.86 ± 3.070 0.523 LVIDd (mm) 41.33 ± 4.790 40.36 ± 4.590 0.557 LVIDs (mm) 26.83 ± 3.530 26.57 ± 4.220 0.842 IVS (mm) 7.33 ± 0.770 6.93 ± 1.350 0.244
PW (mm) 6.92 ± 0.900 6.64 ± 1.420 0.469
FS (%) 37.67 ± 3.280 36.82 ± 5.090 0.536 EF (%) 68.17 ± 4.130 67.25 ± 6.170 0.587 E tricuspid (m/sec) 0.61 ± 0.090 0.62 ± 0.140 0.908 A tricuspid (m/sec) 0.46 ± 0.090 0.41 ± 0.060 0.205 E/A ratio tricuspid 1.38 ± 0.210 1.53 ± 0.300 0.095 DT tricuspid (ms) 165.59 ± 44.04 178.63 ± 35.72 0.398 E mitral (m/sec) 0.97 ± 0.100 0.93 ± 0.230 0.399 A mitral (m/sec) 0.5 ± 0.090 0.52 ± 0.110 0.530 E/A ratio mitral 2.01 ± 0.390 1.78 ± 0.440 0.113 DT mitral (ms) 152.18 ± 41.45 150.2 ± 29.64 0.883 RV-S’ (cm/sec) 11.94 ± 1.990 12.25 ± 1.610 0.638 RV-A’ (cm/sec) 9.33 ± 2.090 9.1 ± 2.280 0.764 RV-E’ (cm/sec) 16.52 ± 2.170 16.11 ± 1.980 0.583 RV-ICT (ms) 42.27 ± 8.290 41.21 ± 6.040 0.694 RV-IRT (ms) 45.37 ± 8.990 43.13 ± 4.910 0.430
RV-MPI 0.33 ± 0.060 0.3 ± 0.080 0.238
RV-E/E’ 3.88 ± 1.010 3.9 ± 1.050 0.960
LV-S’ (cm/sec) 8.05 ± 2.100 7.45 ± 1.040 0.362 LV-A’ (cm/sec) 7.11 ± 1.170 6.82 ± 1.480 0.525 LV-E’ (cm/sec) 17.55 ± 2.820 17.43 ± 3.600 0.910 LV-ICT (ms) 39.97 ± 7.040 40.42 ± 7.680 0.857 LV-IRT (ms) 47.13 ± 6.470 43.0 ± 5.780 0.071
LV-MPI 0.15 ± 0.020 0.13 ± 0.040 0.136
LV-E/E’ 5.71 ± 1.100 5.44 ± 1.270 0.522
Sep-S’ (cm/sec) 7.77 ± 1.300 7.36 ± 1.100 0.356 Sep-A’ (cm/sec) 6.66 ± 1.110 6.19 ± 1.460 0.277 Sep-E’ (cm/sec) 14.7 ± 2.380 14.08 ± 2.440 0.459 HbA1c: hemoglobin A1c, SD: standard deviation, E: E wave velocity, A: A wave velocity, DT: deceleration time, AO: aorta, LA: left atrium, LVIDd:
left ventricular internal dimension during diastole, LVIDs: left ventricular internal dimension during systole, IVS: inter ventricular septum, PW:
posterior wall, FS: fractional shortening, EF: ejection fraction, RV: right ventricle, ICT: isovolumic contruction time, IRT: isovolumic relaxation time, MPI: myocardial performance index, LV: left ventricle, Sep: septal
ing (RV, LV, or both) with prolonged or incomplete return to presystolic length and force.18) Doppler echocardiography re- vealed that our patients had significantly lower mitral and tri- cuspid E and A wave velocities while the E’ and A’ velocities measured by TDI were not reduced in comparison to the con- trols. On the other hand, the S’ velocities of both LV and RV were significantly reduced in comparison to the controls. The mitral annular or basal LV velocities reflect the long-axis mo- tion of the ventricle, which is an important component of LV
systolic and diastolic function. The peak systolic velocity is also a sensitive marker of mildly impaired LV systolic function, even in those with a normal LV ejection fraction or apparently pre- served LV systolic function, such as “diastolic heart failure” or in diabetic subjects without overt heart disease.19) Subclinical LV dysfunction may be identified by reduced longitudinal contraction. The radial contractility appears to compensate for reduced longitudinal contractility in subclinical LV dysfunc- tion occurring in the absence of ischaemia or LV hypertro-
Table 6. Comparison between patients with and without dyslipidemia in relation to M-mode, pulsed wave Doppler and tissue Doppler param- eters
Variables Patients without dyslipidemia27) Patients with dyslipidemia13)
p-value
Mean ± SD Mean ± SD
AO (mm) 023.0 ± 2.780 22.38 ± 3.170 0.536
LA (mm) 024.78 ± 3.450 25.23 ± 2.610 0.679
RV (mm) 014.3 ± 2.940 13.54 ± 3.070 0.457
LVIDd (mm) 040.26 ± 5.000 41.46 ± 3.730 0.448
LVIDs (mm) 026.11 ± 4.070 27.77 ± 3.720 0.223
IVS (mm) 007.11 ± 1.120 6.92 ± 1.440 0.654
PW (mm) 006.78 ± 1.340 6.62 ± 1.190 0.712
FS (%) 037.44 ± 3.590 36.31 ± 6.300 0.471
EF, (%) 067.93 ± 4.870 66.69 ± 7.020 0.521
E tricuspid (m/sec) 000.62 ± 0.150 0.61 ± 0.090 0.857
A tricuspid (m/sec) 000.42 ± 0.080 0.44 ± 0.060 0.619
E/A ratio tricuspid 001.53 ± 0.300 1.41 ± 0.240 0.246
DT tricuspid (ms) 175.33 ± 41.69 173.33 ± 32.41 0.903
E mitral (m/sec) 000.96 ± 0.210 0.91 ± 0.200 0.489
A mitral (m/sec) 000.49 ± 0.080 0.56 ± 0.120 0.047*
E/A ratio mitral 001.9 ± 0.420 1.74 ± 0.450 0.272
DT mitral (ms) 150.4 ± 35.23 151.62 ± 29.92 0.915
RV-S’ (cm/sec) 012.29 ± 1.630 11.88 ± 1.900 0.484
RV-A’ (cm/sec) 008.87 ± 2.300 9.79 ± 1.930 0.222
RV-E’ (cm/sec) 016.46 ± 1.990 15.76 ± 2.060 0.311
RV-ICT (ms) 041.0 ± 7.460 42.64 ± 4.840 0.476
RV-IRT (ms) 043.18 ± 6.990 45.1 ± 4.820 0.379
RV-MPI 000.31 ± 0.080 0.3 ± 0.050 0.741
RV-E/E’ 003.88 ± 1.190 3.92 ± 0.640 0.908
LV-S’ (cm/sec) 007.77 ± 1.540 7.33 ± 1.220 0.369
LV-A’ (cm/sec) 007.27 ± 1.320 6.15 ± 1.250 0.015*
LV-E’ (cm/sec) 017.75 ± 3.410 16.87 ± 3.270 0.440
LV-ICT (ms) 039.4 ± 7.360 42.12 ± 7.470 0.283
LV-IRT (ms) 043.71 ± 5.820 45.33 ± 7.080 0.448
LV-MPI 000.14 ± 0.020 0.13 ± 0.050 0.433
LV-E/E’ 005.5 ± 1.120 5.57 ± 1.440 0.862
Sep-S’ (cm/sec) 007.63 ± 1.100 7.2 ± 1.280 0.288
Sep-A’ (cm/sec) 006.46 ± 1.360 6.07 ± 1.410 0.412
Sep-E’ (cm/sec) 014.57 ± 2.340 13.64 ± 2.520 0.257
*p < 0.05, significant diffrence. SD: standard deviation, AO: aorta, LA: left atrium, LVIDd: left ventricular internal dimension during diastole, LVIDs: left ventricu- lar internal dimension during systole, IVS: inter ventricular septum, PW: posterior wall, FS: fractional shortening, EF: ejection fraction, E: E wave velocity, A:
A wave velocity, DT: deceleration time, RV: right ventricle, ICT: isovolumic contruction time, IRT: isovolumic relaxation time, MPI: myocardial performance index, LV: left ventricle, Sep: septal
phy.20) Our patients added more evidence on DD in those pa- tients. Other findings which support the presence of subtle DD were longer IVRT, lower E/E’ of the RV and higher MPI of the LV. It is important to emphasize that the DD was more prom- inent in the RV parameters. These changes reflect early chang- es in myocardial relaxation. DD in diabetic children was re- ported by other investigators.21-23) LV DD in patients with diabets mellitus (DM) may be caused by increased LV diastolic stiffness, deposition of advanced glycation end (AGE) prod- ucts, and cardiac fibrosis, all as a consequence of DM.3) This is most likely because of the accumulation of AGE products in the myocardium.24) Accumulation of AGE in collagen was as- sociated with reduced collagen turnover, indicating the possi- bility that cross-linking of collagen makes collagen resistant to hydrolytic turnover. Such AGE-mediated cross-linking of collagen is thought to be responsible for increased stiffness of arteries and the myocardium.25) The early stages of DCM are dominated by the pathological alterations in the myocardial interstitium, i.e., formation of nonenzymatic (AGEs), impaired compliance, and ischemia from the disease in the vasa vasorum.
The morphology of the myocardial cells and small coronary vessels is anatomically preserved. These alterations lead to im- paired myocardial contractility. As the disease progresses, LV hypertrophy appears as a result of the hypertrophy of the myo- cardial cells, the interstitial and perivascular fibrosis, the greater thickening of the capillary basement membrane, and the for- mation of microaneurysms in small capillary vessels.18) So, more aggressive control of blood glucose levels should be started as early as possible. These results support the concept of a sub- clinical specific DCM, which develops before obvious systolic dysfunction in patients with T1D mellitus. Existence of a dis- tinct DCM has been claimed to cause DD formerly. In addi- tion, DD has been shown to precede systolic dysfunction in diabetics, even before the presence of pathological findings on clinical examination.26) The natural history of DCM consists of a latent subclinical period, during which cellular structural in- sults and abnormalities occur initially leading to DD and pro- gressing to degenerative changes, which the myocardium is unable to repair, with subsequent irreversible pathological re- modeling.27) Addition of TDI to posterior wall Doppler has been reported to improve the echocardiographic diagnosis of diastolic impairment in diabetic population. But, unfortunate- ly pediatric DD may not follow the progression seen in adult patients which raise the importance of development of new criteria for children. The pediatric reference data for echo pa- rameters to assess diastolic function successfully define nor- mal controls, but because of the large range of normal values classification of DD maybe difficult.28) Moreover, the recent update for the recommendations for evaluation of LV DD clearly stated that LV DD is present if more than half of the available parameters meet the cutoff values.29)
M-mode echocardiography showed a tendency to ventricular hypertrophy in the absence of hypertension. Our young patients
had significantly larger LVIDd and LVIDs diameters and in- creased IVS and LVPW thickness than controls, but their Z- scores for these dimensions were still within normal for these patients. The LA diameter was also significantly higher in our patients most probably secondary to LV DD. Other investiga- tors reported similar findings.4)26) The FS of LV was significant- ly lower in our young diabetic patients yet remained within normal values which may imply an early affection of the sys- tolic function. This finding was reported by the Strong Heart Study,30) but their population was different than ours, as they in- cluded type 2 diabetes and their patients were much older than ours.
No significant correlation between duration of diabetes and the echocardiographic parameters used to assess the systolic or diastolic function despite that all our patients were diabetic for more than 5 years. Other investigators reported a strong corre- lation between impairment of diastolic function and DM du- ration which emphasize the progressive nature of the pro- cess,3)26)31) but the our patients were younger than the patients included in those studies which can explain the discrepancy.
We did not find any correlation between HbA1c and LV or RV diastolic functions this issue may be partly explained by the fact that a single HbA1c may not reflect the overall control of diabetes; in addition, it may cause insufficient and deceptive information about long-term glycemic control. So, the mean HbA1c value averaged over several years instead of a single in- stantaneous value may provide more accurate information about glycemic control. The influence of HbA1c and diabetes dura- tion was not evident in our study. This relation remains con- troversial in many studies.
Dyslipidemia in diabetics is a disorder of lipoprotein me- tabolism that results in increased TC, high LDL, low HDL and high TG. Although dyslipidemia is an established risk fac- tor for cardiovascular disease in T1D adults, no long term stud- ies link between dyslipidemia in T1D children with subse- quent cardiovascular disease.32) But lipid abnormality has been linked to the development and prognosis of micro and macro- vascular complications in adolescents with T1D.33) Thirteen of our patient had dyslipidemia and they had significantly higher mitral A velocity and lower LV-A’ velocity patients without dyslipidemia. The effect of dyslipidemia is duration depen- dent.34) We believe that these findings are possibly a random occurrence of differences because of the large number of vari- ables analyzed. No enough studies regarding effect of dyslipid- emia on cardiac function in diabetic children were done.
One of the limitations of this study was that our patients were not subjected to the exercise stress as part of their evaluation which could have yielded more significant results. Another lim- itation was the use of single HbA1c reading instead of using a mean of readings over several months.
In conclusion, diabetic children have echocardiographic evi- dence of subtle RV and LV dysfunction with delayed myocar- dial relaxation. TDI has an additional value in evaluating ven-
tricular filling. This highlights the importance of periodic cardiac evaluation with both conventional and tissue Doppler echo- cardiography for early detection of this dysfunction.
References
1. International Diabetes Federation. IDF Diabetes Atlas, 5th ed. Brussels:
International Diabetes Federation;2011.
2. Soltèsz G, Patterson C, Dahlquist G. Global trends in childhood type 1 diabetes. IInternational Diabetes Federation, editors. Diabetes Atlas, 3rd ed.
Brussels: International Diabetes Federation;2006. p.153-90.
3. Kim EH, Kim YH. Left ventricular function in children and adolescents with type 1 diabetes mellitus. Korean Circ J 2010;40:125-30.
4. Suys BE, Katier N, Rooman RP, Matthys D, Op De Beeck L, Du Caju MV, De Wolf D. Female children and adolescents with type 1 dia- betes have more pronounced early echocardiographic signs of diabetic cardio- myopathy. Diabetes Care 2004;27:1947-53.
5. Rubler S, Dlugash J, Yuceoglu YZ, Kumral T, Branwood AW, Grish- man A. New type of cardiomyopathy associated with diabetic glomeruloscle- rosis. Am J Cardiol 1972;30:595-602.
6. Asghar O, Al-Sunni A, Khavandi K, Khavandi A, Withers S, Green- stein A, Heagerty AM, Malik RA. Diabetic cardiomyopathy. Clin Sci (Lond) 2009;116:741-60.
7. Fang ZY, Yuda S, Anderson V, Short L, Case C, Marwick TH. Echo- cardiographic detection of early diabetic myocardial disease. J Am Coll Car- diol 2003;41:611-7.
8. Hamblin M, Smith HM, Hill MF. Dietary supplementation with vita- min E ameliorates cardiac failure in type I diabetic cardiomyopathy by sup- pressing myocardial generation of 8-iso-prostaglandin F2alpha and oxidized glutathione. J Card Fail 2007;13:884-92.
9. Elshahed GS, Ahmed MI, El-Beblawy NS, Kamal HM, Ismaiel MF, Bin Zheidan OAS. Evaluation of right and left ventricular systolic and diastolic function in patients with type 1 diabetes using echocardiography and tissue Doppler imaging. Suez Canal Univ Med J 2008;11:65-74.
10. Rosner B, Cook N, Portman R, Daniels S, Falkner B. Determination of blood pressure percentiles in normal-weight children: some methodological issues. Am J Epidemiol 2008;167:653-66.
11. Ghali I, Salah N, Hussien F, Erfan M, El-Ruby M, Mazen I, Sabry M, Abd El-Razik M, Saad M, Hossney S, Ismaail, Abd El-Dayem S.
Egyptian growth curves for infants, children and adolescents. In: Satorio A, Buckler JMH, Marazzi N, editors. Crecerenelmondo. Milan: Ferring Pub- lisher;2008.
12. Alemzadeh R, Ali O. Diabetes mellitus: type 1 diabetes mellitus (immune mediated). In: Kliegman RM, Stanton B, St. Geme J, Schor NF, Behrman RE, editors. Nelson textbook of pediatrics, 19th ed. Philadelphia: Elsevier;
2011. p.1969-89.
13. American Diabetes Association. Standards of medical care in diabetes-- 2012. Diabetes Care 2012;35 Suppl 1:S11-63.
14. Kwiterovich PO Jr. Recognition and management of dyslipidemia in chil- dren and adolescents. J Clin Endocrinol Metab 2008;93:4200-9.
15. Nagueh SF, Appleton CP, Gillebert TC, Marino PN, Oh JK, Smis- eth OA, Waggoner AD, Flachskampf FA, Pellikka PA, Evangelisa A.
Recommendations for the evaluation of left ventricular diastolic function by echocardiography. Eur J Echocardiogr 2009;10:165-93.
16. Rudski LG, Lai WW, Afilalo J, Hua L, Handschumacher MD, Chan- drasekaran K, Solomon SD, Louie EK, Schiller NB. Guidelines for the echocardiographic assessment of the right heart in adults: a report from the American Society of Echocardiography endorsed by the European Association of Echocardiography, a registered branch of the European Society of Cardiolo- gy, and the Canadian Society of Echocardiography. J Am Soc Echocardiogr 2010;23:685-713; quiz 786-8.
17. Voulgari C, Papadogiannis D, Tentolouris N. Diabetic cardiomyopathy:
from the pathophysiology of the cardiac myocytes to current diagnosis and man- agement strategies. Vasc Health Risk Manag 2010;6:883-903.
18. Zile MR, Brutsaert DL. New concepts in diastolic dysfunction and diastol- ic heart failure: part I: diagnosis, prognosis, and measurements of diastolic function. Circulation 2002;105:1387-93.
19. Yu CM, Sanderson JE, Marwick TH, Oh JK. Tissue Doppler imaging a new prognosticator for cardiovascular diseases. J Am Coll Cardiol 2007;49:
1903-14.
20. Fang ZY, Leano R, Marwick TH. Relationship between longitudinal and radial contractility in subclinical diabetic heart disease. Clin Sci (Lond) 2004;106:53-60.
21. Khattab AA, Soliman MA. Biventricular function and glycemic load in type 1 diabetic children: Doppler tissue-imaging study. Pediatr Cardiol 2015;
36:423-31.
22. Gökşen D, Levent E, Kar S, Ozen S, Darcan S. Serum adiponectin and hsCRP levels and non-invasive radiological methods in the early diagnosis of cardiovascular system complications in children and adolescents with type 1 diabetes mellitus. J Clin Res Pediatr Endocrinol 2013;5:174-81.
23. Çiftel M, Ertuğ H, Parlak M, Akçurin G, Kardelen F. Investigation of endothelial dysfunction and arterial stiffness in children with type 1 diabetes mellitus and the association with diastolic dysfunction. Diab Vasc Dis Res 2014;11:19-25.
24. Sveen KA, Nerdrum T, Hanssen KF, Brekke M, Torjesen PA, Strauch CM, Sell DR, Monnier VM, Dahl-Jørgensen K, Steine K. Impaired left ventricular function and myocardial blood flow reserve in patients with long-term type 1 diabetes and no significant coronary artery disease: associa- tions with protein glycation. Diab Vasc Dis Res 2014;11:84-91.
25. Miki T, Yuda S, Kouzu H, Miura T. Diabetic cardiomyopathy: patho- physiology and clinical features. Heart Fail Rev 2013;18:149-66.
26. Gul K, Celebi AS, Kacmaz F, Ozcan OC, Ustun I, Berker D, Aydin Y, Delibasi T, Guler S, Barazi AO. Tissue Doppler imaging must be performed to detect early left ventricular dysfunction in patients with type 1 diabetes mellitus. Eur J Echocardiogr 2009;10:841-6.
27. Hegazy SK, Tolba OA, Mostafa TM, Eid MA, El-Afify DR. Alpha- lipoic acid improves subclinical left ventricular dysfunction in asymptomatic patients with type 1 diabetes. Rev Diabet Stud 2013;10:58-67.
28. Dragulescu A, Mertens L, Friedberg MK. Interpretation of left ventric- ular diastolic dysfunction in children with cardiomyopathy by echocardiogra- phy: problems and limitations. Circ Cardiovasc Imaging 2013;6:254-61.
29. Cosson S, Kevorkian JP. Left ventricular diastolic dysfunction: an early sign of diabetic cardiomyopathy? Diabetes Metab 2003;29:455-66.
30. Devereux RB, Roman MJ, Paranicas M, O’Grady MJ, Lee ET, Welty TK, Fabsitz RR, Robbins D, Rhoades ER, Howard BV. Impact of diabetes on cardiac structure and function: the strong heart study. Circulation 2000;101:2271-6.
31. Nagueh SF, Smiseth OA, Appleton CP, Byrd BF 3rd, Dokainish H, Edvardsen T, Flachskampf FA, Gillebert TC, Klein AL, Lancellotti P, Marino P, Oh JK, Alexandru Popescu B, Waggoner AD; Hous- ton, Texas; Oslo, Norway; Phoenix, Arizona; Nashville, Tennessee;
Hamilton, Ontario, Canada; Uppsala, Sweden; Ghent and Liège, Belgium; Cleveland, Ohio; Novara, Italy; Rochester, Minnesota; Bu- charest, Romania; and St. Louis, Missouri. Recommendations for the evaluation of left ventricular diastolic function by echocardiography: an up- date from the American Society of Echocardiography and the European Asso- ciation of Cardiovascular Imaging. Eur Heart J Cardiovasc Imaging 2016;17:1321-60.
32. Hong YM. Atherosclerotic cardiovascular disease beginning in childhood.
Korean Circ J 2010;40:1-9.
33. Marcovecchio ML, Dalton RN, Prevost AT, Acerini CL, Barrett TG,
Cooper JD, Edge J, Neil A, Shield J, Widmer B, Todd JA, Dunger DB. Prevalence of abnormal lipid profiles and the relationship with the de- velopment of microalbuminuria in adolescents with type 1 diabetes. Diabetes Care 2009;32:658-63.
34. Vitarelli A, Martino F, Capotosto L, Martino E, Colantoni C, Ashu-
rov R, Ricci S, Conde Y, Maramao F, Vitarelli M, De Chiara S, Za- noni C. Early myocardial deformation changes in hypercholesterolemic and obese children and adolescents: a 2D and 3D speckle tracking echocardiogra- phy study. Medicine (Baltimore) 2014;93:e71.