Beta-Cell Function, Self-rated Health, and Lifestyle Habits in 64-Year-Old Swedish Women with
Metabolically Healthy Obesity Phenotype
Ola Hjelmgren1, Anders Gummesson2, Göran Bergström1,2, Caroline Schmidt2,*
1Department of Clinical Physiology, Institution of Neuroscience and Physiology and 2Department of Molecular and Clinical Medicine, Institution of Medicine, Sahlgrenska Academy at Gothenburg University, Göteborg, Sweden
Background: A subset of obese individuals do not present metabolic abnormalities that commonly define the metabolic syndrome (MetS). This is referred to as a metabolically healthy obese (MHO) phenotype. The aim of the present study was to evaluate the prevalence of the MHO phenotype and its relationship with beta cell dys- function by measuring C-peptide and proinsulin, anthropometric-, metabolic- and lipid appearance, as well as lifestyle behaviors and self-rated health in a cohort of 64-year-old Swedish women.
Methods: The National Cholesterol Education Program definition was used to assess MetS. We defined normal weight as body mass index (BMI) 18.5–24.9 kg/m2 and obesity as BMI ≥30 kg/m2 to categorize participants as metabolically healthy normal weight, MHO, and metabolically unhealthy obese.
Results: The MHO phenotype represented 36.3% of obese participants and 16.3% of total participants. The MHO group were at greater risk of having proinsulin levels >11 pmol/L, indicating impaired beta cell function.
Further, homeostatic model assessment for insulin resistance, fasting plasma levels of insulin, and C-peptide showed significant trends, with the MHO phenotype group having intermediate levels among three groups. Health behaviors such as leisure time physical activity and alcohol intake were also intermediate in individuals with the MHO phenotype.
Conclusion: In this study, we demonstrate that over a third of the obese women in our sample were MHO. Fur- ther, women with the MHO phenotype showed intermediate profiles considering beta cell function and insulin resistance, as well as metabolic variables, and tended to rate their general health as worse than otherwise similar individuals of normal weight.
Key words: Metabolically benign obesity, Health, Life style
Received December 17, 2019 Reviewed February 8, 2020 Accepted February 29, 2020
* Corresponding author Caroline Schmidt
https://orcid.org/0000-0001-8534-3237 Department of Molecular and Clinical Medicine, Institution of Medicine, Sahlgrenska Academy at Gothenburg University, 413 45 Göteborg, Sweden Tel: +46-31-342-9696
E-mail: [email protected]
INTRODUCTION
Obesity is a complex, heterogeneous condition with significant phenotypic variation.
1Whereas obesity is closely related to cluster- ing of metabolic risk factors and increased morbidity and mortality, a subset of obese individuals do not present with metabolic abnor- malities. This phenotype is considered metabolically healthy obese (MHO).
2,3Why these individuals do not develop metabolic syn-
drome (MetS) is currently unknown.
4However, lifestyle behaviors, such as physical activity and sedentary time, may differ between MHO and metabolically unhealthy obese (MUO) phenotypes.
1Previous studies have shown inconsistent results comparing physi- cal activity levels between MHO and MUO subjects, with some studies reporting significant differences while other studies do not.
1Further, self-rated health (SRH), an inclusive measure of health, has previously been shown to be associated with increased risk of
Copyright © 2020 Korean Society for the Study of Obesity
This is an Open Access article distributed under the terms of the Creative Commons Attribution Non-Commercial License (https://creativecommons.org/licenses/by-nc/4.0/) which permits unrestricted non-commercial use, distribution, and reproduction in any medium, provided the original work is properly cited.
2017-03-16 https://crossmark-cdn.crossref.org/widget/v2.0/logos/CROSSMARK_Color_square.svg
progression to an unhealthy metabolic status in metabolically healthy individuals.
5Previous studies have also shown that low SRH is associated with increased incidence of both insulin resis- tance and type 2 diabetes mellitus.
6,7However, preserved insulin sensitivity and paucity of the components of the MetS may charac- terize the MHO phenotype.
8Physiologically, virtually all proinsulin molecules are cleaved into insulin and C-peptide. In healthy sub- jects, only a minor percentage of un-cleaved intact proinsulin is re- leased into the circulation. However, insulin resistance leads to an increased demand for insulin, and thus the cleavage capacity of the processing enzymes may be exhausted, and proinsulin and C-pep- tide may be increased.
9Further, insulin resistance may cause meta- bolic modifications that lead to imbalance in glucose metabolism, causing chronic hyperglycemia, which in turn initiates oxidative stress and inflammatory response that leads to cell damage.
10Insu- lin resistance can also change systemic lipid metabolism, which leads to the development of dyslipidemia and the well-known pat- tern of high levels of plasma triglycerides, low levels of high-density lipoprotein, and appearance of small dense low-density lipopro- tein.
10Therefore, measurements of intact proinsulin are important indirect predictors for insulin resistance and play roles as direct bio- markers of beta cell dysfunction.
9The aim of the present study was to evaluate the prevalence of the MHO phenotype and its relationships with anthropometric-, metabolic- and lipid appearance, as well as lifestyle behaviors and SRH, in a cohort of 64-year-old Swedish women. A further aim was to explore beta cell dysfunction by measuring C-peptide and proinsulin in the MHO phenotype.
METHODS Study population and design
All participants received both written and oral information be- fore they gave consent to take part in the study. The Ethics Com- mittee at Sahlgrenska University Hospital approved the protocol (Dnr: S 286-01).
The study population and study design have previously been ex- tensively described elsewhere.
8In brief, all 64-year-old women (n= 4,856) identified through the County Register in Gothenburg, Sweden, were sent an invitation letter to participate in a screening
examination. Those who accepted (n= 2,893) completed a brief questionnaire that was enclosed with the letter. Exclusion criteria were cancer (unless no relapse during the last 5 years), chronic in- flammatory disease, severe mental disorder, other severe illness, drug addiction, or inability to understand Swedish (n= 298).
Participants were invited to a screening examination including an oral glucose tolerance test (OGTT). The OGTT procedure has previously been thoroughly described.
11The World Health Orga- nization (WHO) criteria for capillary blood glucose values for cut- off were used.
12No OGTTs were performed on subjects with known diabetes. The examinations included a questionnaire solic- iting information regarding previous diseases, current medication, smoking habits, heredity for diabetes, TV time, leisure time physi- cal activity (LTPA) and SRH. Anthropometric measurements were performed, and blood pressure and heart rate were recorded. Body weight was measured in light clothing. Waist and hip circumferenc- es were measured according to current guidelines.
12Finally, 639 women were included in the study.
Definition of the phenotype groups
The National Cholesterol Education Program definition was used to assess MetS (Supplementary Table 1).
13By defining normal weight as body mass index (BMI) 18.5–24.9 kg/m
2and obesity as BMI
≥ 30 kg/m
2,
14the participants were categorized as (1) metabolical- ly healthy normal weight (MHNW; n= 180), (2) metabolically healthy obese (MHO; n= 53), and (3) metabolically unhealthy obese (MUO; n= 93) (Supplementary Table 2). This resulted in a sample of 326 women (Supplementary Fig. 1). The remaining 313 women were categorized as metabolic abnormal, normal weight, metabolic healthy, overweight, or metabolic abnormal, overweight.
Biochemical analysis
The biochemical analyses we performed have been described in detail elsewhere.
15,16All analyses were performed at the Wallenberg Laboratory for Cardiovascular Research, Sahlgrenska University Hospital, Gothenburg, Sweden.
Assessment of SRH
SRH was assessed by the question “In general, how would you
rate your health?” Answers were dichotomized into two groups,
good health (excellent and good) and average health or less (aver- age, poor and very poor) based on previous studies.
17,18SRH was further assessed by the question “In general, how would you rate your health compared to others your age?” with answers divided into three categories, better (much better and better), neither better nor worse, and worse (worse and much worse).
Statistics
The IBM SPSS version 22.0 (IBM Corp., Armonk, NY, USA) was used for all statistical analyses. Normally distributed continuous data are presented as the mean± standard deviation (SD). Skewed data are presented as the median and range and nominal data are presented as number and percent. Comparisons between groups were analyzed by one-way analysis of variance with the least signifi- cant difference post-hoc test. In addition, one-way test was used for analyzing trends between groups. Trend analyses in nonparametric variables were performed with Jonckheere-Terpstra test. Analyses of nominal data were performed with chi-square tests. The P-values
< 0.05 were considered statistically significant.
RESULTS
In the sample of 326 women, 71.5% were metabolically healthy and 44.8% were obese. The MHO phenotype represented 36.3%
of obese participants and 16.3% of participants in the total sample.
The mean age was 64.5 years (SD, 0.3). Values for baseline anthro- pometrics and lifestyle behaviors, baseline metabolic factors, in- cluding insulin variables, and lipids are presented in Tables 1 and 2, respectively. Briefly, the majority of the variables showed significant trends, with the MHO phenotype group having intermediate levels and the MUO phenotype group having levels that were the most unfavorable. The MHO group had significantly increased BMI, weight, waist circumference, and blood pressure, compared to the MHNW group. Further, fasting plasma insulin levels, plasma pro- insulin, C-peptide, triglycerides, apolipoprotein B levels, and apoli- poprotein B to A-I ratio were significantly increased, while high- density lipoprotein cholesterol was significantly lower in the MHO group than in the MHNW group. However, total cholesterol did not differ between the phenotype groups, nor did low-density lipo- protein cholesterol.
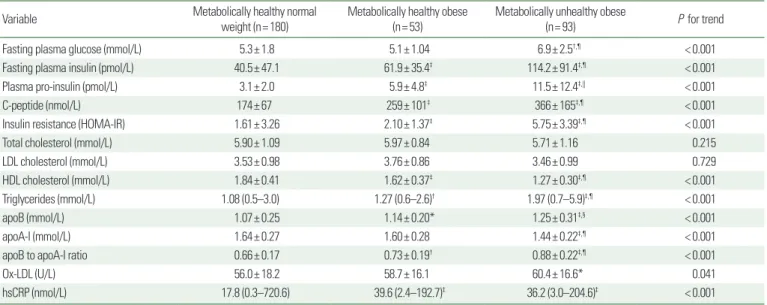
Fasting plasma levels of insulin, proinsulin, and C-peptide showed significant trends with the MHO phenotype group having interme- diate levels and the MUO phenotype group having the highest lev- els. Proinsulin levels > 11 pmol/L indicating beta-cell dysfunction, was most common in the MUO group (30%). In the MHO group, the corresponding figure was 9.8%, while only one patient (0.6%) in the MHNW group had proinsulin levels above 11 pmol/L. The risk ratio was 18.2 (95% confidence interval, 2.1 to 159.3) for increased
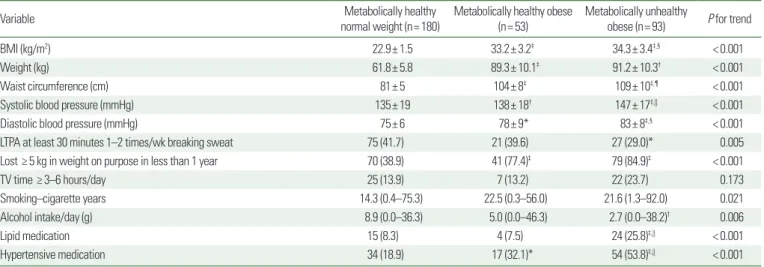
Table 1. Baseline anthropometric values and life style behaviors of the study participants according to phenotype
Variable Metabolically healthy
normal weight (n= 180) Metabolically healthy obese
(n= 53) Metabolically unhealthy
obese (n= 93) P for trend
BMI (kg/m2) 22.9± 1.5 33.2± 3.2‡ 34.3± 3.4‡,§ < 0.001
Weight (kg) 61.8± 5.8 89.3± 10.1‡ 91.2± 10.3† < 0.001
Waist circumference (cm) 81± 5 104± 8‡ 109± 10‡,¶ < 0.001
Systolic blood pressure (mmHg) 135± 19 138± 18† 147± 17‡,|| < 0.001
Diastolic blood pressure (mmHg) 75± 6 78± 9* 83± 8‡,§ < 0.001
LTPA at least 30 minutes 1–2 times/wk breaking sweat 75 (41.7) 21 (39.6) 27 (29.0)* 0.005
Lost ≥ 5 kg in weight on purpose in less than 1 year 70 (38.9) 41 (77.4)‡ 79 (84.9)‡ < 0.001
TV time ≥ 3–6 hours/day 25 (13.9) 7 (13.2) 22 (23.7) 0.173
Smoking–cigarette years 14.3 (0.4–75.3) 22.5 (0.3–56.0) 21.6 (1.3–92.0) 0.021
Alcohol intake/day (g) 8.9 (0.0–36.3) 5.0 (0.0–46.3) 2.7 (0.0–38.2)† 0.006
Lipid medication 15 (8.3) 4 (7.5) 24 (25.8)‡,|| < 0.001
Hypertensive medication 34 (18.9) 17 (32.1)* 54 (53.8)‡,|| < 0.001
Values are presented as mean± standard deviation, number (%), or median (range).
*P< 0.05 vs. metabolically healthy normal weight; †P< 0.01 vs. metabolically healthy normal weight; ‡P< 0.001 vs. metabolically healthy normal weight; §P< 0.05 vs. metabolically healthy obese; ||P< 0.01 vs. metabolically healthy obese; ¶P< 0.001 vs. metabolically healthy obese.
BMI, body mass index; LTPA, leisure time physical activity.
risk among MHO subjects to have a proinsulin level > 11 pmol/L compared to MHNW subjects. Insulin resistance assessed as ho- meostatic model assessment for insulin resistance (HOMA-IR) sig- nificantly differed between the MHO and the MHNW groups. Fur- ther, the MUO group had significantly higher values of HOMA-IR compared to both other groups.
Both obese phenotype groups were more likely to have lost ≥ 5 kg in weight on purpose in less than one year compared to the nor- mal weight group. LTPA showed a significant trend towards less
activity in the MUO group, with the MHNW group reporting the most activity. However, no difference was observed in the number of subjects performing LTPA at least 30 minutes 1–2 times per week while breaking sweat between the MHO and the MHNW groups, but this variable differed significantly between the MUO and MHNW groups. No difference between phenotype groups was observed for TV time ≥ 3–6 hours per day. The MUO group reported significantly more cigarette years, representing smoking habits, compared to the normal weight group.
Table 2. Baseline metabolic and insulin factors for the study participants according to phenotype
Variable Metabolically healthy normal
weight (n= 180) Metabolically healthy obese
(n= 53) Metabolically unhealthy obese
(n= 93) P for trend
Fasting plasma glucose (mmol/L) 5.3± 1.8 5.1± 1.04 6.9± 2.5†,¶ < 0.001
Fasting plasma insulin (pmol/L) 40.5± 47.1 61.9± 35.4‡ 114.2± 91.4‡,¶ < 0.001
Plasma pro-insulin (pmol/L) 3.1± 2.0 5.9± 4.8‡ 11.5± 12.4‡,|| < 0.001
C-peptide (nmol/L) 174± 67 259± 101‡ 366± 165‡,¶ < 0.001
Insulin resistance (HOMA-IR) 1.61± 3.26 2.10± 1.37‡ 5.75± 3.39‡,¶ < 0.001
Total cholesterol (mmol/L) 5.90± 1.09 5.97± 0.84 5.71± 1.16 0.215
LDL cholesterol (mmol/L) 3.53± 0.98 3.76± 0.86 3.46± 0.99 0.729
HDL cholesterol (mmol/L) 1.84± 0.41 1.62± 0.37‡ 1.27± 0.30‡,¶ < 0.001
Triglycerides (mmol/L) 1.08 (0.5–3.0) 1.27 (0.6–2.6)† 1.97 (0.7–5.9)‡,¶ < 0.001
apoB (mmol/L) 1.07± 0.25 1.14± 0.20* 1.25± 0.31‡,§ < 0.001
apoA-I (mmol/L) 1.64± 0.27 1.60± 0.28 1.44± 0.22‡,¶ < 0.001
apoB to apoA-I ratio 0.66± 0.17 0.73± 0.19† 0.88± 0.22‡,¶ < 0.001
Ox-LDL (U/L) 56.0± 18.2 58.7± 16.1 60.4± 16.6* 0.041
hsCRP (nmol/L) 17.8 (0.3–720.6) 39.6 (2.4–192.7)‡ 36.2 (3.0–204.6)‡ < 0.001
Values are presented as mean± standard deviation deviation, number (%), or median (range).
*P< 0.05 vs. metabolically healthy normal weight; †P< 0.01 vs. metabolically healthy normal weight; ‡P< 0.001 vs. metabolically healthy normal weight; §P< 0.05 vs. metabolically healthy obese; ||P< 0.01 vs. metabolically healthy obese; ¶P< 0.001 vs. metabolically healthy obese.
HOMA-IR, homeostatic model assessment for insulin resistance; LDL, low-density lipoprotein; HDL, high-density lipoprotein; apoB, apolipoprotein B; apoA-I, apolipoprotein A-I; Ox- LDL, oxidized low-density lipoprotein; hsCRP, high-sensitive C-reaction protein.
Figure 1. Proportion of each phenotype group rating their health as average or worse. *P< 0.001 vs. MHNW; †P< 0.01 vs. MHNW; ‡P< 0.05 vs. MHO. MHNW, metabolically healthy normal weight; MHO, metabolically healthy obese; MUO, metabolically unhealthy obese.
60 50 40 30 20 10 0
%
MHNW MHO MUO
In general, how would you rate your health?:
I rate my health as average or less
P< 0.001 for trend
*
†,‡
Figure 2. Proportion of each phenotype group rating their health as worse com- pared to others their own age. *P< 0.01 vs. MHNW; †P< 0.01 vs. MHO. MHNW, metabolically healthy, normal weight; MHO, metabolically healthy obese; MUO, metabolically unhealthy obese.
%
30 25 20 15 10 5 0
MHNW MHO MUO
In general, how would you rate your health compared to others your age?:
I rate my health as worse compared to others my own age P< 0.001 for trend *,†