INTRODUCTION
Prostate cancer (PC) is one of the most common malig
nancies among men in the United States and is the second
Gene expression profile comparison in the penile tissue of diabetes and cavernous nerve injury-
induced erectile dysfunction rat model
Sung Chul Kam1, Sang Hoon Lee2, Ju Hong Jeon3, Insuk So4, Mee Ree Chae5, Jong Kwan Park6, Sung Won Lee5
1Department of Urology, Gyeongsang National University Changwon Hospital, Gyeongsang National University School of Medicine, Changwon, Korea, 2Department of Biochemistry, University of Utah School of Medicine, Salt Lake City, UT, USA, 3Department of Physiology and Biomedical Sciences, Seoul National University College of Medicine, Institute of Human-Environment Interface Biology, Seoul National University, Seoul, 4Department of Physiology and Biophysics, Seoul National University College of Medicine, Seoul, 5Department of Urology, Samsung Medical Center, Samsung Biomedical Research Institute, Sungkyunkwan University School of Medicine, Seoul, 6Department of Urology, Chonbuk National University Medical School, Institute for Medical Sciences, Chonbuk National University, Research Institute and Clinical Trial Center of Medical Device of Chonbuk National University Hospital, Jeonju, Korea
Purpose: To investigate the effects of cavernous nerve injury (CNI) on gene expression profiles in the cavernosal tissue of a CNI- induced erectile dysfunction (ED) model and to provide a basis for future investigations to discover potential target genes for ED treatment.
Materials and Methods: Young adult rats were divided randomly into 2 groups: sham operation and bilateral CN resection. At 12 weeks after CNI we measured erectile responses and performed microarray experiments and gene set enrichment analysis to re- veal gene signatures that were enriched in the CNI-induced ED model. Alterations in gene signatures were compared with those in the diabetes-induced ED model. The diabetic-induced ED data is taken from GSE2457.
Results: The mean ratio of intracavernosal pressure/blood pressure for the CNI group (0.54±0.4 cmH2O) was significantly lower than that in the sham operation group (0.73±0.8 cmH2O, p<0.05). Supervised and unsupervised clustering analysis showed that the diabetes- and CNI-induced ED cavernous tissues had different gene expression profiles from normal cavernous tissues. We identified 46 genes that were upregulated and 77 genes that were downregulated in both the CNI- and diabetes-induced ED mod- els.
Conclusions: Our genome-wide and computational studies provide the groundwork for understanding complex mechanisms and molecular signature changes in ED.
Keywords: Erectile dysfunction; Gene expression; Microarray analysis; Peripheral nerve injuries
This is an Open Access article distributed under the terms of the Creative Commons Attribution Non-Commercial License (http://creativecommons.org/licenses/by-nc/4.0) which permits unrestricted non-commercial use, distribution, and reproduction in any medium, provided the original work is properly cited.
Received: 26 April, 2016 • Accepted: 9 June, 2016 Corresponding Author: Sung Won Lee
Department of Urology, Samsung Medical Center, Sungkyunkwan University School of Medicine, 81 Irwon-ro, Gangnam-gu, Seoul 06351, Korea TEL: +82-2-3410-3559, FAX: +82-2-3410-3027, E-mail: [email protected]
ⓒ The Korean Urological Association, 2016
leading cause of male cancer death [1]. Radical prostatectomy (RP) remains the goldstandard treatment method for localized PC but postoperative erectile dysfunction (ED) is a major complication of the treatment [2]. ED means that
www.icurology.org
Investig Clin Urol 2016;57:286-297.
http://dx.doi.org/10.4111/icu.2016.57.4.286 pISSN 2466-0493 • eISSN 2466-054X
the state that an erection is not sufficient or maintained sufficiently for a satisfactory sexual life, so it lowers the quality of life and causes distress to the patients. ED after the RP is often caused by surgical injury of the cavernous nerve (CN), which is the final neuronal pathway of penile erection. ED has been reported to occur in 25%–75% of patients who underwent RP [3].
Common types of cavernous nerve injury (CNI) include traction, laceration, and compression, which increase the number of apoptotic cells in endothelial and smooth muscle cells of the corporal cavernous tissue [4]. Many studies have used the CNI rat model to research the physiological mechanisms of ED, such as penile shrinkage, loss of key neurotransmitters, and a distinct pattern of smooth muscle cell apoptosis in the corpora cavernous tissue [5]. However, a little is known about the molecular mechanisms and biological processes of ED induced by CNI.
Gene expression profiling and genomewide analysis can provide a foundation for discovering the molecular mechanisms of ED and global genomic alteration caused by CNI in the corpora cavernous tissue. In this study, we performed microarray experiments on the cavernous tissue of the CNIinduced ED model and compared the results with a diabetesinduced ED model to obtain a global view of biological processes and to suggest markers for the diagnosis for ED.
MATERIALS AND METHODS
1. Tissue harvest and sample preparation
In total, 6 adult male Sprague Dawley rats (12 weeks old) were divided randomly into 2 groups: sham operation (n=3) and bilateral CN resection (n=3) groups. The experimental rats were anesthetized intraperitoneally with ketamine (50 mg/kg) and the bilateral CN in the resection group was excised, as described previously [6]. The bilateral CN in the sham operation group was also identified by the lower abdominal midline incision, but no direct CN manipulation was performed. This procedure was performed carefully to prevent any possible reinnervation [7]. Abdominal wounds were then closed with sutures.
At 12 weeks after CN resection, the rats in both groups were anesthetized and penile tissue was harvested. The corpus cavernosum of the penis was dissected to pen
oprostatic junction, excluding any prostate tissue, urethral tissue, and glans tissue. The corpus cavernosum was blotted to remove blood and the tissue was snapfrozen in liquid N2
for the next experiments.
2. Measurement of erectile responses
At 12 weeks after CNI, the measurement of erectile responses was performed based on Rehman et al. [8]. The animals were anesthetized and placed in a supine position, and systemic arterial blood pressure (BP) was monitored via carotid artery cannulation with polyethylene (PE)50 tubing.
The prostate and bladder were exposed through a midline abdominal incision. The major pelvic ganglion, pelvic nerves, and CN were identified posterolateral to the prostate on one side, and an electric stimulator with stainless steel bipolar hook electrodes was placed around the CN for electrical stimulation. To monitor intracavernosal pressure (ICP), a 25gauge cannula was filled with 250 U/mL of heparin, connected to PE50 tubing and inserted into the right crura.
Both systemic and intracavernosal BP were measured with a transducer connected to a computerized system for data acquisition (PowerLab ADI Instruments, Sydney, Australia).
Realtime display and recording of pressure were performed using the Chart 5 software (ADI Instruments). Electrical field stimulation parameters were as follows: voltage, 5 V, duration 60 seconds. The ratio of maximal ICP to mean arterial BP obtained at the peak of erectile response was determined to control for variations in arterial BP.
3. RNA preparation and microarray experiment
Total RNA was extracted from the rat penile tissue sample using the TRI Reagent (MRC, Cincinnati, OH, USA) according to the manufacturer’s instructions. Total RNA (1 µg) was labeled and amplified using Universal Linkage System RNA labeling kit (Kreatech Diagnostics, Amsterdam, The Netherlands) [9]. The Cy3labeled RNAs were resuspended in 10 µL of hybridization solution (GenoCheck, Ansan, Korea). The resuspended RNAs were placed on an Agilent Rat genome 4×44K array (GPL7289, Agilent Technologies, Santa Clara, CA, USA) and covered by an A4 hybridization mixer (Biomicro Systems, Salt Lake City, UT, USA). The slides were hybridized for 12 hours at 42oC with a MAUI hybridization system (Biomicro Systems).The hybridized slides were washed in 2× saline sodium citrate (SSC), 0.1% sodium dodecyl sulphate for 2 minutes, 1× SSC for 3 minutes, and then 0.2× SSC for 2 minutes at room temperature. The slides were centrifuged (3000 rpm, 20 seconds) to dry them. Hybridized slides were scanned with the Axon Instruments Agilent scanner and the scanned images were analyzed with the Feature Extraction software (ver. 10.7.3.1; Agilent Technologies) and GeneSpring GX 11.0 (Agilent Technologies). Spots that were judged as substandard by visual examination of each slide were flagged and excluded from further analysis. Relative signal
intensities for each gene were generated using the Robust MultiArray Average algorithm. The data were processed based on the median polish normalization method using the GeneSpring GX 11.0, and normalized to 19,550 probe sets excluding missing gene information. Our microarray raw data are available at the Gene Expression Omnibus database (http://www.ncbi.nlm.nih.gov/geo) under accession number GSE31247.
4. Collection of ED model microarray data and intensive preprocessing
We downloaded gene expression profile of ED in diabetes
induced rats (GSE2457) [10]. At 10 weeks after streptozotosin
induction of diabetes, they confirmed decreased erectile function in diabetic animals in response to CN stimulation by ICP measurements. The penis was rapidly dissected free at the level of the crura. We expect that this diabetes
induced ED model will be a good comparison with our CNI
induced ED model. The quality of microarray data was assessed through the pipeline at http://www.arrayanalysis.
org for intensive and strict quality control test to filter out lowquality microarray samples [11]. We used the same criteria for highquality samples described by Lee et al. [12]. All raw data were normalized using the single
channel array normalization method, which standardizes the individual probelevel data by deducting arrayspecific background using only data from within each microarray [13]. Custom chipdefinition files (ver. 17.1.0) provided by the BrainArray resource were used in the normalization process to map microarray probe values to 9,180 genes and excludes inaccurate or wrongly annotated probes [14].
5. Feature selection and classification analysis using a machine learning tool
Feature selection and phenotype classification based on the gene expression profile were performed using a machine learning tool, Weka (Waikato Environment for Knowledge Analysis; ver. 3.6.3) [15]. We used sequential minimal optimization (SMO) [16] and leaveoneout crossvalidation [17]
as classifier algorithms to obtain a statistically predictive measurement in the small sample size microarray data set [18]. Feature selection involves processing the data to find certain properties and select those features that can most effectively predict a class from each sample group. ReliefF [19] was used to rank features based on their ability to classify microarray samples. In our study, we set the ‘average merit’ to >0.1 for feature selection.
6. Computational analysis and statistics: unsuper- vised hierarchical clustering, GSEA, and SAM
Unsupervised hierarchical clustering analysis using the Gene Pattern (ver. 3.7.0) software [20] was performed with the features selected by the ReliefF algorithm. For the unsupervised hierarchical clustering parameters, Pearson correlation was set for the column and row distance measures, and a pairwise completelinkage was set up as the hierarchical clustering method.
Gene set enrichment analysis (GSEA) was used to exa
mine the enrichment of significant gene signatures in the 2 different biological groups using the gene ontology (GO) biological process signature databases (ver. 4.0) [21]. As the number of samples was small, pvalues were calculated by permuting the genes 1,000 times in the process of finding enriched gene signatures. An alteration of gene signatures with a false discovery rate (FDR) qvalue <0.4 between 2 classes was considered significant. An enrichment score (ES) in the GSEA results shows the strength of the relationship between gene signatures and phenotypes. The normalized enrichment score accounts for the size of each gene signature. Gene signatures that were downregulated in CNI or diabetesinduced ED model would have negative ES values.
Significance analysis of microarrays (SAM) [22] was used to identify statistically significant genes that were expressed differentially between CNIinduced ED or diabetesinduced ED versus normal cavernous tissue (NCT). We estimated our empirical null distribution using 1,000 permutations and set a FDR threshold (qvalue) of 0.01 for stringent feature selection.
All procedures and methods were approved by the ethical committee of the Samsung Medical Center Institutional Review Board before commencement of the study (CA82222).
This study has no conflict of interest.
RESULTS
1. Erectile function in CNI rats
The mean ICP in response to CN stimulation in the CNI group was significantly lower than in the sham operation group (p<0.05). These responses were reproducible 30 minutes after the initial stimulation. The values for ICP and BP were 94.4±8.3 and 129.8±3.5 cmH2O, respectively, for the sham operation group, and 73.3±9.4 and 134.7±7.1 cmH2O, respectively, for the CNI group. For the statistical comparison of stimulation effects, the mean amplitude of the ICP response at each level of nerve stimulation was expressed as a fraction of the mean BP (ICP/BP) during
nerve stimulation. The mean ICP/BP for the CNI group (0.54±0.4) was significantly different from the sham operation group (0.73±0.8, p<0.05) (Fig. 1). This result shows that ED was induced successfully by CNI in rat corporal cavernous tissue.
2. Supervised classification analysis of microarray data
In the CNIinduced ED microarray data, two NCT and one CNIinduced ED samples were misclassified (predictive accuracy 50%, Table 1). In the diabetesinduced ED microarray data, three control samples were misclassified (predictive accuracy 70%, Table 1). These results indicated that the small size of samples that include unnecessary features cannot produce accurate predictive accuracy in classification analysis [22]. Thus, we performed feature selection to select a subset of strongly relevant features for CNI and diabetesinduced ED gene expression profiles. The ReliefF algorithm selected 2,970 probe sets and 2,457 genes in the CNI and diabetesinduced ED models, respectively.
Classification accuracy after the feature selection was increased to 100% in both microarray data sets (Table 1).
3. Unsupervised hierarchical clustering analysis
Unsupervised hierarchical clustering analysis with all 19,550 probe sets in CNIinduced ED and all 9,180 genes in diabetesinduced ED models did not form distinct clusters against normal tissue samples (data not shown). However, hierarchical clustering analysis after feature selection built a better hierarchy of clusters to split normal versus ED model gene expression profiles. Normal and CNIinduced ED samples were perfectly split to each cluster in hierarchical clustering analysis with 2,970 selected features (Fig. 2A).On the other hand, in the hierarchical clustering analysis with 2,457 selected features in diabetesinduced ED model, two normal samples still clustered to the diabetesinduced ED group (data not shown). This was partly because SMO classification and hierarchical clustering use different algorithms. After excluding the 2 wrongly clustered normal samples, the rest of the three normal and 5 diabetesinduced
Nerve stimulation
A B
Pressure(cmHO)2
100
0 150
50
Shem operation group
BP
ICP
Pressure(cmHO)2
100
0 150
50
Nerve stimulation
BP
ICP CN crushing injury group
Shem operation 60
40
20
Crushing CNI
ICP/BP
0
* C
80
Fig. 1. Representative records of data and intracavernosal pressure/ blood pressure (ICP/BP) from electric field stimulation at 12 weeks after cav- ernous nerve injury (CNI). Representative time course of changes in ICP for sham operation group rats (A), cavernous nerve (CN) crushing injury group rats (B), and summary of all in vivo data (C). In vivo experiments were performed 12 weeks after CNI in rats. *p-value<0.05, response signifi- cantly different compared with sham operation group.
ED samples could be separated to different clusters, showing distinct gene expression profiles in the heat map (Fig. 2B).
These results showed that diabetes and CNIinduced ED cavernous tissue have different gene expression profiles from NCTs by unsupervised clustering methods, too.
4. Gene signatures modulated in CNI- and diabe- tes-induced ED models
To assess functional gene regulation and identify significantly altered gene signatures of biological process in CNI and diabetesinduced ED models, we used a statistical approach applying an external gene annotation standard, GO [20]. The GSEA was carried out with the final genes selected by ReliefF with average merit >0.1. In the CNIinduced ED model, REPRODUCTIVE_PROCESS, ANAOMICAL_STRUCTURE_DEVELOPMENT, SYSTEM_
DEVELOPMENT, and NEGATIVE_REGULATION_
OF_DEVELOPMENTAL_PROCESS gene signatures were downregulated (Table 2). In the diabetesinduced ED model, SKELETAL_DEVELOPMENT,ION_TRANSPORT, NEUROLOGICAL_SYSTME_PROCESS, SENSORY_
PERCEPTION, SYSTEM_DEVELOPMENT, TISSUE_
DEVELOPMENT, and TRANSMISSION_OF_NERVE_
IMPULSE gene signatures were downregulated related to ED (Table 3). We observed gene signatures regarding tissue development were downreulatged commonly in both models.
Also, this result suggests that the function of genes selected by ReliefF in both models is commonly involved in ED phenotype.
To understand the effect of CNI on ED status, we analy
zed genes belonging to the ANATOMICAL_STRUCTURE_
DEVELOPMENT gene signature. An enrichment plot of the ANATOMICAL_STRUCTURE_DEVELOPMENT gene signature showed the distribution of up and downregulated genes between normal cavernous and CNI penile tissue (Fig.
3). In the ANATOMICAL_STRUCTURE_DEVELOPMENT gene signature, 39 genes were found to belong to the leading edge subset (LES). The heat map in Fig. 3 displays the different gene expression pattern of the 39 LES genes between normal cavernous and CNI penile tissue. Table 4 lists the 39 LES genes with the information on fold change and rank metric score.
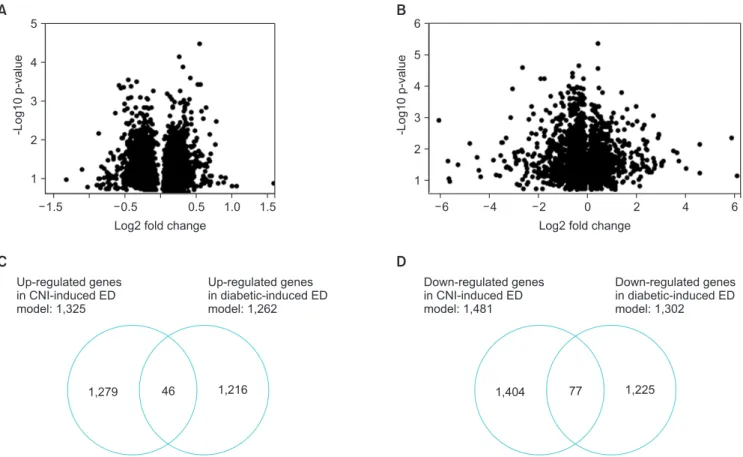
From the features selected by the ReliefF algorithm, SAM analysis identified 2,816 and 2,564 genes that were significantly down or upregulated in the CNI or diabetes
induced ED model versus normal tissues, respectively.
Volcano plot representation of the SAM results showed the magnitude of fold change (in xaxis) and significance (pvalue in yaxis) of the genes. The magnitude of fold change in the Table 1. Summary of data set information and the result of supervised classification analysis GSE31247GSE2457 No. of samples6 (3 normal and 3 CNI-induced ED model)10 (5 normal and 5 diabetes-induced ED model) Total number of probe sets41,01215,923 No. of genes or probe sets after normalization and excluding missing gene annotations19,550 Probe sets9,180 Genes No. of features selected on ReliefF ‘average merit’ >0.12,970 Probe sets2,595 Genes Predictive accuracy Before feature selection50% (2 CNI and 1 CNI-induced ED samples misclassified)70% (3 control samples misclassified) After feature selection100%100% CNI, cavernous nerve injury; ED, erectile dysfunction.
CNIinduced ED model was not large (range of –1.5 to 1.5 in the xaxis of Fig. 4A) compared to that in the diabetes
induced ED model (range of –6 to 6 in the xaxis of Fig.
4B). However, most of the differentially expressed genes in
the CNIinduced model showed significant pvalues like the diabetesinduced ED model (log10 p>1.30 means p<0.05 in the yaxis). Further analysis revealed 46 upregulated and 77 downregulated genes that overlapped in the CNI and
SON1 SON2 SON3 CNI_ED1 CNI_ED2 CNI_ED3
CNI
NCT1 NCT2 NCT4 DM_ED2 DM_ED1 DM_ED3 DM_ED4 DM_ED5
A B
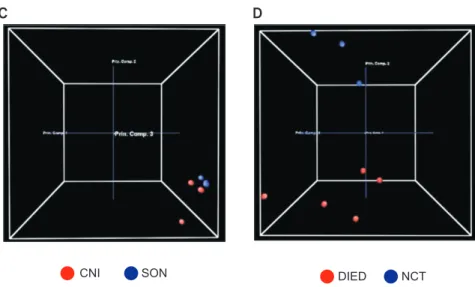
C D
SON DIED NCT
(Sum of % variances in PC2 and PC3: 0.65% and 5.46%, respectively)
Fig. 2. Different gene expression patterns between normal and diabetes- or cavernous nerve injury (CNI)-induced erectile dysfunction (ED) penile tissues. (A) Unsupervised hierarchical clustering of gene expression profile distinguishes the CNI-induced ED model from (B) the diabetes-induced ED model. (C, D) Principal component analysis (PCA) plots for the CNI-induced and diabetes-induced model data. The sum of % variance is shown for each PCA plot. The diabetic-induced ED (DIED) data is taken from GSE2457 [10]. SON, sham operation normal tissue; NCT, normal cavernous tissue.
Table 2. The list of 7 gene signatures significantly down-regulated in cavernous nerve injury-induced erectile dysfunction model (GSE31247)
Name ESa NESb Nominal p-value FDR q-valuec
REPRODUCTIVE_PROCESS –0.452 –1.613 0.029 0.338
POSITIVE_REGULATION_OF_CATALYTIC_ACTIVITY –0.422 –1.574 0.034 0.364
ANATOMICAL_STRUCTURE_DEVELOPMENT –0.296 –1.633 0.006 0.367
SYSTEM_DEVELOPMENT –0.265 –1.443 0.042 0.373
CELLULAR_CATABOLIC_PROCESS –0.387 –1.423 0.109 0.386
NEGATIVE_REGULATION_OF_DEVELOPMENTAL_PROCESS –0.442 –1.661 0.013 0.399
PROTEIN_METABOLIC_PROCESS –0.266 –1.445 0.043 0.399
The values of enrichment score (ES), normalized enrichment score (NES), nominal p-value, and false discovery rate (FDR) q-value were rounded off to 3 decimal places. The table is sorted smallest to largest by NES.
a:The ES indicates the degree to which a gene set is overrepresented at the entired ranked gene list. b:The NES was calculated by normalizing the enrichment score (ES) to account for the size of each gene signature. c:FDR q-value: FDR is to control the proportion of false positives correspond- ing to each NES. FDR was represented as q-value, which is the analog of p-value that has been corrected for multiple hypothesis testing.
diabetesinduced ED models (Fig. 4C, D, respectively).
DISCUSSION
The main pathophysiologies of ED are vascular insufficiency and autonomic neuropathy. ED results from endocrine dysfunction, partial Wallerian degeneration due to CNI, which disrupts the linkage with normal nerve tissue and consequently causes the alterations and atrophy in the smooth muscle and white membrane of the corpus
cavernosum. Moreover, secondarily, it induces cavernous smooth muscle cell apoptosis, the ratio change between smooth muscle and collagen, and atrophy in endothelial cells, which eventually ED [5,23,24]. However, insights from the CNIinduced ED mechanism and the effects of CNI on the ED process have not thoroughly studied.
Here, we provide the first analysis of gene alterations in a CNIinduced ED rat model through microarray analysis.
Similar gene signature alterations were present in the CNI
induced ED rat model and the diabetesinduced rat model.
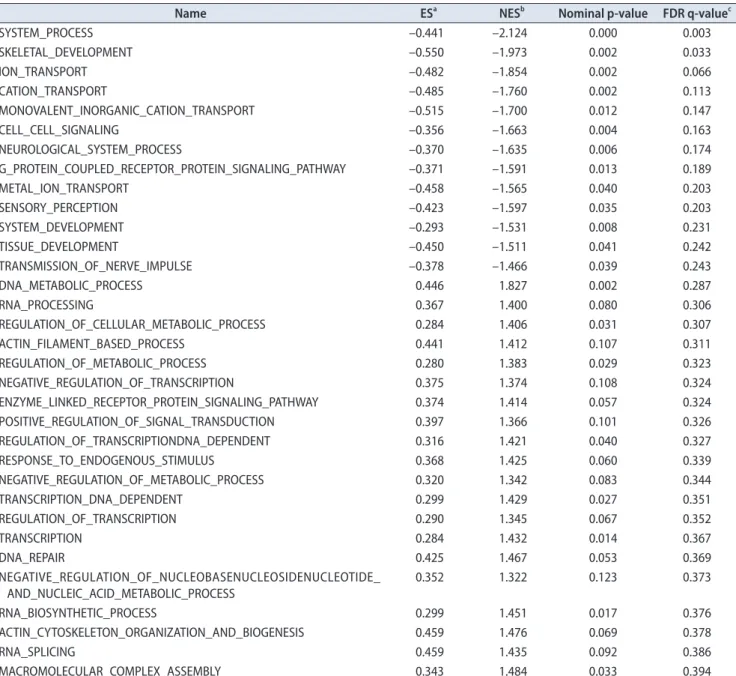
Table 3. The list of 33 gene signatures significantly up- or down-regulated in diabetes-induced erectile dysfunction model (GSE2457)
Name ESa NESb Nominal p-value FDR q-valuec
SYSTEM_PROCESS –0.441 –2.124 0.000 0.003
SKELETAL_DEVELOPMENT –0.550 –1.973 0.002 0.033
ION_TRANSPORT –0.482 –1.854 0.002 0.066
CATION_TRANSPORT –0.485 –1.760 0.002 0.113
MONOVALENT_INORGANIC_CATION_TRANSPORT –0.515 –1.700 0.012 0.147
CELL_CELL_SIGNALING –0.356 –1.663 0.004 0.163
NEUROLOGICAL_SYSTEM_PROCESS –0.370 –1.635 0.006 0.174
G_PROTEIN_COUPLED_RECEPTOR_PROTEIN_SIGNALING_PATHWAY –0.371 –1.591 0.013 0.189
METAL_ION_TRANSPORT –0.458 –1.565 0.040 0.203
SENSORY_PERCEPTION –0.423 –1.597 0.035 0.203
SYSTEM_DEVELOPMENT –0.293 –1.531 0.008 0.231
TISSUE_DEVELOPMENT –0.450 –1.511 0.041 0.242
TRANSMISSION_OF_NERVE_IMPULSE –0.378 –1.466 0.039 0.243
DNA_METABOLIC_PROCESS 0.446 1.827 0.002 0.287
RNA_PROCESSING 0.367 1.400 0.080 0.306
REGULATION_OF_CELLULAR_METABOLIC_PROCESS 0.284 1.406 0.031 0.307
ACTIN_FILAMENT_BASED_PROCESS 0.441 1.412 0.107 0.311
REGULATION_OF_METABOLIC_PROCESS 0.280 1.383 0.029 0.323
NEGATIVE_REGULATION_OF_TRANSCRIPTION 0.375 1.374 0.108 0.324
ENZYME_LINKED_RECEPTOR_PROTEIN_SIGNALING_PATHWAY 0.374 1.414 0.057 0.324
POSITIVE_REGULATION_OF_SIGNAL_TRANSDUCTION 0.397 1.366 0.101 0.326
REGULATION_OF_TRANSCRIPTIONDNA_DEPENDENT 0.316 1.421 0.040 0.327
RESPONSE_TO_ENDOGENOUS_STIMULUS 0.368 1.425 0.060 0.339
NEGATIVE_REGULATION_OF_METABOLIC_PROCESS 0.320 1.342 0.083 0.344
TRANSCRIPTION_DNA_DEPENDENT 0.299 1.429 0.027 0.351
REGULATION_OF_TRANSCRIPTION 0.290 1.345 0.067 0.352
TRANSCRIPTION 0.284 1.432 0.014 0.367
DNA_REPAIR 0.425 1.467 0.053 0.369
NEGATIVE_REGULATION_OF_NUCLEOBASENUCLEOSIDENUCLEOTIDE_
AND_NUCLEIC_ACID_METABOLIC_PROCESS 0.352 1.322 0.123 0.373
RNA_BIOSYNTHETIC_PROCESS 0.299 1.451 0.017 0.376
ACTIN_CYTOSKELETON_ORGANIZATION_AND_BIOGENESIS 0.459 1.476 0.069 0.378
RNA_SPLICING 0.459 1.435 0.092 0.386
MACROMOLECULAR_COMPLEX_ASSEMBLY 0.343 1.484 0.033 0.394
The values of enrichment score (ES), normalized enrichment score (NES), nominal p-value, and false discovery rate (FDR) q-value were rounded off to 3 decimal places. The table is sorted smallest to largest by NES.
a:The ES indicates the degree to which a gene set is overrepresented at the entired ranked gene list. b:The NES was calculated by normalizing the ES to account for the size of each gene signature. c:FDR q-value: FDR is to control the proportion of false positives corresponding to each NES. FDR was represented as q-value, which is the analog of p-value that has been corrected for multiple hypothesis testing.
User et al. found a group of genes that were altered in a postradical prostatectomy model of ED. The SMR1 gene in particular, which is speculative for clinical relevance in penile function, was 82.5 fold downregulated in the CN transaction group [23]. However, these studies failed to investigate the biological processes or molecular mechanisms for ED induced by CNI with a genomewide expression profile. On the other hand, the association between ED and diabetic patients was reported a long time ago. Diabetes can affect all components of the erectile response because it is a complex pathology that causes neural and vascular damage in the penis. Men with diabetes suffer from more severe ED and comply less with pharmacological therapies for ED [24]. Collagen type 1 is the most abundant form of collagen in human and rat erectile tissues and forms the bulk of the matrix structure of the cavernosum. Hipp et al.
[25] performed microarray experiments for gene expression profile analysis and found collagen I and actin genes, which play roles in maintaining muscle tensile strength and structure, were downregulated in the erectile tissue of the streptozotocindiabetes model. Colla1 was significantly downregulated in the CNIinduced ED. It is interesting
that ApoE (apolipoprotein E), which has been studied in hypercholesterolemiainduced ED using knockout mice and resulted in impaired ED, was upregulated in the CNI
induced ED model [26]. Also, elastic fiberrelated genes, such as Eln, were significantly downregulated in the CNI
induced ED model. Elastin deficiency is known to lead to erectile dysfuncion [10]. Hu et al. [27] performed microarray experiments for gene expression profile analysis and found Cxcl12, Tgfbr1, Asns, Bdkrb1, and Cdh3 genes, which play roles in oxidative stressinduced genes, were up and down
regulated in the ED rat model. Bdkrb2 was significantly downregulated in the CNI and diabetesinduced ED models.
Bdkrb1 and 2 played an important role in relieving DNA damage and apoptosis [28]. The 77 genes that were commonly downregulated in the CNI and diabetesinduced ED models included Serpine2 [29].
The limitations of this study are that we used the small number of subjects and we did not perform lab experiments to validate the gene alterations in corpus cavernosum of CNIindued ED model due to finite resources. Nonetheless, using statistical and computational analyses we were able to demonstrate changes in gene expression in the CNIinduced Fig. 3. Enrichment plot of ANATOMI- CAL_STRUCTURE_DEVELOPMENT gene signatures. The square box indicates the leading edge subset and the heat map presents 39 genes of the leading edge subset. SON, sham operation normal tissue; CNI_ED, cavernous nerve injury- induced erectile dysfunction; FDR, false discovery rate is the estimated prob- ability that a gene set with a given NES represents a false positive finding; ES, enrichment score; NES, normalized en- richment score.
SON CNI_ED
FOXE1 NCL MOBP UBB PITX1 KCNMB2 GHRHR PSPN NPR1 MOG APOA5 RTN1 SIX1 MYH11 PLP1 FGF18 CST6 COL1A1 PITX3 SOX10 RASGRP4 ANXA2 CALCA HDAC5 BAIAP2 SLIT1 CD9 TAOK2 ACTA1 STMN3 WNT7A PPARD FGF3 RHOB EMP1 RASA1 BRAF TNFRSF11B THBS4
Enrichment plot:
ANATOMICAL_STRUCTURE_DEVELOPMENT
0.05 0.00 0.05 0.10 0.15 0.20 0.25 0.30
Enrichmentscore(ES)
1.0 0.5
0.5 1.0
Rankedlistmetric(signal2Noise)
0.0
0 250 500 750 1,000 1,250 1,500 1,750 2,000 Rank in ordered dataset
Enrichment profile Hits Ranking metric scores
p-value=0.006 FDR q-value=0.367 ES= 0.296 NES= 1.633
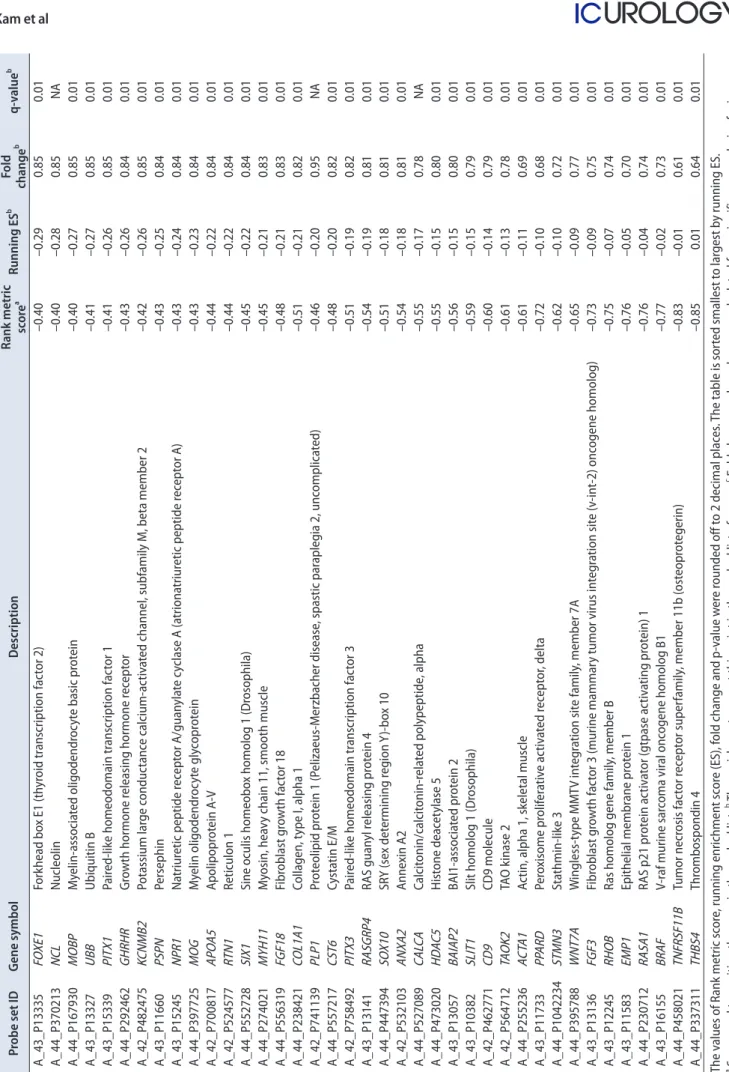
Table 4. The list of 39 LES genes in ANATOMICAL_STRUCTURE_DEVELOPMENT gene signature Probe set IDGene symbolDescriptionRank metric scoreaRunning ESbFold changebq-valueb A_43_P13335FOXE1Forkhead box E1 (thyroid transcription factor 2)–0.40–0.290.850.01 A_44_P370213NCLNucleolin–0.40–0.280.85NA A_44_P167930MOBPMyelin-associated oligodendrocyte basic protein–0.40–0.270.850.01 A_43_P13327UBBUbiquitin B–0.41–0.270.850.01 A_43_P15339PITX1Paired-like homeodomain transcription factor 1–0.41–0.260.850.01 A_44_P292462GHRHRGrowth hormone releasing hormone receptor–0.43–0.260.840.01 A_42_P482475KCNMB2Potassium large conductance calcium-activated channel, subfamily M, beta member 2–0.42–0.260.850.01 A_43_P11660PSPNPersephin–0.43–0.250.840.01 A_43_P15245NPR1Natriuretic peptide receptor A/guanylate cyclase A (atrionatriuretic peptide receptor A)–0.43–0.240.840.01 A_44_P397725MOGMyelin oligodendrocyte glycoprotein–0.43–0.230.840.01 A_42_P700817APOA5Apolipoprotein A-V–0.44–0.220.840.01 A_42_P524577RTN1Reticulon 1–0.44–0.220.840.01 A_44_P552728SIX1Sine oculis homeobox homolog 1 (Drosophila)–0.45–0.220.840.01 A_44_P274021MYH11Myosin, heavy chain 11, smooth muscle–0.45–0.210.830.01 A_44_P556319FGF18Fibroblast growth factor 18–0.48–0.210.830.01 A_44_P238421COL1A1Collagen, type I, alpha 1–0.51–0.210.820.01 A_42_P741139PLP1Proteolipid protein 1 (Pelizaeus-Merzbacher disease, spastic paraplegia 2, uncomplicated)–0.46–0.200.95NA A_44_P557217CST6Cystatin E/M–0.48–0.200.820.01 A_42_P758492PITX3Paired-like homeodomain transcription factor 3–0.51–0.190.820.01 A_43_P13141RASGRP4RAS guanyl releasing protein 4–0.54–0.190.810.01 A_44_P447394SOX10SRY (sex determining region Y)-box 10–0.51–0.180.810.01 A_42_P532103ANXA2Annexin A2–0.54–0.180.810.01 A_44_P527089CALCACalcitonin/calcitonin-related polypeptide, alpha–0.55–0.170.78NA A_44_P473020HDAC5Histone deacetylase 5–0.55–0.150.800.01 A_43_P13057BAIAP2BAI1-associated protein 2–0.56–0.150.800.01 A_43_P10382SLIT1Slit homolog 1 (Drosophila)–0.59–0.150.790.01 A_42_P462771CD9CD9 molecule–0.60–0.140.790.01 A_42_P564712TAOK2TAO kinase 2–0.61–0.130.780.01 A_44_P255236ACTA1Actin, alpha 1, skeletal muscle–0.61–0.110.690.01 A_43_P11733PPARDPeroxisome proliferative activated receptor, delta–0.72–0.100.680.01 A_44_P1042234STMN3Stathmin-like 3–0.62–0.100.720.01 A_44_P395788WNT7AWingless-type MMTV integration site family, member 7A–0.65–0.090.770.01 A_43_P13136FGF3Fibroblast growth factor 3 (murine mammary tumor virus integration site (v-int-2) oncogene homolog)–0.73–0.090.750.01 A_43_P12245RHOBRas homolog gene family, member B–0.75–0.070.740.01 A_43_P11583EMP1Epithelial membrane protein 1–0.76–0.050.700.01 A_44_P230712RASA1RAS p21 protein activator (gtpase activating protein) 1–0.76–0.040.740.01 A_43_P16155BRAFV-raf murine sarcoma viral oncogene homolog B1–0.77–0.020.730.01 A_44_P458021TNFRSF11BTumor necrosis factor receptor superfamily, member 11b (osteoprotegerin)–0.83–0.010.610.01 A_44_P337311THBS4Thrombospondin 4–0.850.010.640.01 The values of Rank metric score, running enrichment score (ES), fold change and p-value were rounded off to 2 decimal places. The table is sorted smallest to largest by running ES. a :Score used to position the gene in the ranked list. b :The enrichment score at this point in the ranked list of genes. c :Fold change and q-value were calculated from significance analysis of microarrays analysis.
ED rat models and compared the results with the diabetes
induced ED model to identify genes that might be involved in ED. Experiment with Larger numbers of subjects and examining the functions of EDinvolved genes are necessary in further studies. The accuracy of this study may also be low because tissue from not only the corpus cavernosum, but also the tunica albuginia, was used in the microassay.
Our study showed that CNI and diabetes induced downregulation of the gene signatures associated with neurological processes and anatomical structure development that might play important roles in maintaining proper erectile function and cavernous structure. We were unable to reveal exactly how the 39 LES CNIinduced rat model genes and the 77 genes that were downregulated in both rat models influence the pathogenesis of ED, although these genes are presumed to be related to nerve regeneration.
Findings from our study expand the scope of potential candidate genes and pathways that are dysregulated in CNI and can have a negative impact on erectile function.
The various genes identified in our study can be further evaluated as diagnostic markers and potential drug targets
in patients with CNIinduced ED.
CONCLUSIONS
ED is often caused by diabetes and CNI and negatively affects the quality of life, especially in younger patients.
However, the mechanism(s) and molecular alteration(s) in ED have not been examined sufficiently. We performed microarray experiments to understand the gene signature alterations in the corporal cavernous tissue of the CNI
induced ED rat model. Additionally, we used public microarray data from a diabetesinduced ED model to compare it with our results in terms of gene expression profile. We found that system and anatomical structure developmentrelated gene signatures were downregulated in both the diabetes and CNIinduced ED penile tissues versus controls. Also, we identified candidate genes that were commonly downregulated in the CNIinduced and diabetesinduced ED models; these may be useful for novel molecularbased therapies for ED. These findings on gene expression changes in the diabetes and CNIinduce ED A
6 4 2 0 2 4 6
5 4 3 2 1
-Log10p-value
Log2 fold change
B
6
1.5 0.5 0.5 1.0 1.5
5
4
3
2
1
-Log10p-value
Log2 fold change
Up-regulated genes in CNI-induced ED model: 1,325
Up-regulated genes in diabetic-induced ED model: 1,262
1,279 46 1,216
Down-regulated genes in CNI-induced ED model: 1,481
Down-regulated genes in diabetic-induced ED model: 1,302
1,404 77 1,225
C D
Fig. 4. Differentially expressed genes in cavernous nerve injury (CNI)- and diabetes-induced erectile dysfunction (ED) models identified by analy- sis of microarrays (SAM) analysis. Volcano plots depicted the magnitude of fold change and significance of p-value of the genes identified by SAM in CNI- (A) or diabetes-induced ED (B) models. The x-axis represents log2 fold change and the y-axis log10 p-value. (C) Forty-six genes were com- monly up-regulated, and (D) 77 genes were commonly down-regulated in CNI- and diabetes-induced ED models. The diabetic-induced ED data is taken from GSE2457 [10].
models may provide hints for targets for ED treatment and for biomarkers to predict the effects of drug treatment.
CONFLICTS OF INTEREST
The authors have nothing to disclose.
ACKNOWLEDGMENTS
This research was supported by a grant of the Korea Health Technology R&D Project through the Korea Health Industry Development Institute (KHIDI), funded by the Ministry of Health & Welfare, Republic of Korea (HI13C0104).
REFERENCES
1. Jemal A, Siegel R, Xu J, Ward E. Cancer statistics, 2010. CA Cancer J Clin 2010;60:277-300.
2. Noldus J, Michl U, Graefen M, Haese A, Hammerer P, Huland H. Patient-reported sexual function after nerve-sparing radical retropubic prostatectomy. Eur Urol 2002;42:118-24.
3. Sanda MG, Dunn RL, Michalski J, Sandler HM, Northouse L, Hembroff L, et al. Quality of life and satisfaction with outcome among prostate-cancer survivors. N Engl J Med 2008;358:1250- 61.
4. User HM, Hairston JH, Zelner DJ, McKenna KE, McVary KT.
Penile weight and cell subtype specific changes in a post-rad- ical prostatectomy model of erectile dysfunction. J Urol 2003;
169:1175-9.
5. Mullerad M, Donohue JF, Li PS, Scardino PT, Mulhall JP.
Functional sequelae of cavernous nerve injury in the rat: is there model dependency. J Sex Med 2006;31:77-83.
6. Yamashita S, Kato R, Kobayashi K, Hisasue S, Arai Y, Tsuka- moto T. Nerve injury-related erectile dysfunction following nerve-sparing radical prostatectomy: a novel experimental dis- section model. Int J Urol 2009;16:905-11.
7. McVary KT, Razzaq A, Lee C, Venegas MF, Rademaker A, McKenna KE. Growth of the rat prostate gland is facilitated by the autonomic nervous system. Biol Reprod 1994;51:99-107.
8. Rehman J, Chenven E, Brink P, Peterson B, Walcott B, Wen YP, et al. Diminished neurogenic but not pharmacological erec- tions in the 2- to 3-month experimentally diabetic F-344 rat.
Am J Physiol 1997;272(4 Pt 2):H1960-71.
9. Alers JC, Rochat J, Krijtenburg PJ, van Dekken H, Raap AK, Rosenberg C. Universal linkage system: an improved method for labeling archival DNA for comparative genomic hybridiza- tion. Genes Chromosomes Cancer 1999;25:301-5.
10. Sullivan CJ, Teal TH, Luttrell IP, Tran KB, Peters MA, Wessells
H. Microarray analysis reveals novel gene expression changes associated with erectile dysfunction in diabetic rats. Physiol Genomics 2005;23:192-205.
11. Eijssen LM, Jaillard M, Adriaens ME, Gaj S, de Groot PJ, Muller M, et al. User-friendly solutions for microarray quality control and pre-processing on ArrayAnalysis.org. Nucleic Ac- ids Res 2013;41(Web Server issue):W71-6.
12. Lee S, Chun JN, Kim SH, So I, Jeon JH. Icilin inhibits E2F1- mediated cell cycle regulatory programs in prostate cancer.
Biochem Biophys Res Commun 2013;441:1005-10.
13. Piccolo SR, Sun Y, Campbell JD, Lenburg ME, Bild AH, John- son WE. A single-sample microarray normalization method to facilitate personalized-medicine workflows. Genomics 2012;
100:337-44.
14. Dai M, Wang P, Boyd AD, Kostov G, Athey B, Jones EG, et al.
Evolving gene/transcript definitions significantly alter the in- terpretation of GeneChip data. Nucleic Acids Res 2005;33:e175.
15. Hall M, Frank E, Holmes G, Pfahringer B, Reutemann P, Wit- ten IH. The WEKA data mining software: an update. SIGKDD Explor 2009;11:10-8.
16. Cao LJ, Keerthi SS, Ong CJ, Zhang JQ, Periyathamby U, Fu XJ, et al. Parallel sequential minimal optimization for the training of support vector machines. IEEE Trans Neural Netw 2006;17:
1039-49.
17. Kohavi R, editor. A study of cross-validation and bootstrap for accuracy estimation and model selection. In: IJCAI'95 Pro- ceedings of the 14th international joint conference on Artificial intelligence. San Francisco (CA): Morgan Kaufmann Publish- ers Inc.; 1995. p. 1137-43.
18. Ding C, Peng H. Minimum redundancy feature selection from microarray gene expression data. J Bioinform Comput Biol 2005;3:185-205.
19. Yu L, Liu H. Efficient feature selection via analysis of relevance and redundancy. J Mach Learn Res 2004;5:1205-24.
20. Hubble J, Demeter J, Jin H, Mao M, Nitzberg M, Reddy TB, et al. Implementation of GenePattern within the Stanford Micro- array Database. Nucleic Acids Res 2009;37(Database issue):
D898-901.
21. Subramanian A, Tamayo P, Mootha VK, Mukherjee S, Ebert BL, Gillette MA, et al. Gene set enrichment analysis: a knowl- edge-based approach for interpreting genome-wide expression profiles. Proc Natl Acad Sci U S A 2005;102:15545-50.
22. Tusher VG, Tibshirani R, Chu G. Significance analysis of mi- croarrays applied to the ionizing radiation response. Proc Natl Acad Sci U S A 2001;98:5116-21.
23. Leungwattanakij S, Bivalacqua TJ, Usta MF, Yang DY, Hyun JS, Champion HC, et al. Cavernous neurotomy causes hypoxia and fibrosis in rat corpus cavernosum. J Androl 2003;24:239- 45.
24. Hyun JS. Prostate cancer and sexual function. World J Mens Health 2012;30:99-107.
25. Hipp JD, Davies KP, Tar M, Valcic M, Knoll A, Melman A, et al. Using gene chips to identify organ-specific, smooth muscle responses to experimental diabetes: potential applications to urological diseases. BJU Int 2007;99:418-30.
26. Musicki B, Liu T, Lagoda GA, Strong TD, Sezen SF, Johnson JM, et al. Hypercholesterolemia-induced erectile dysfunction:
endothelial nitric oxide synthase (eNOS) uncoupling in the mouse penis by NAD(P)H oxidase. J Sex Med 2010;7:3023-32.
27. Hu C, Dong YY, Dong YH, Cui JF, Dai JC. Identification of
oxidative stress-induced gene expression profiles in cavernosal endothelial cells. Mol Med Rep 2015;11:2781-8.
28. Kakoki M, McGarrah RW, Kim HS, Smithies O. Bradykinin B1 and B2 receptors both have protective roles in renal ischemia/
reperfusion injury. Proc Natl Acad Sci U S A 2007;104:7576- 81.
29. Calenda G, Strong TD, Pavlovich CP, Schaeffer EM, Burnett AL, Yu W, et al. Whole genome microarray of the major pelvic ganglion after cavernous nerve injury: new insights into molec- ular profile changes after nerve injury. BJU Int 2012;109:1552- 64.