A Novel Index Using Soluble CD36 Is Associated with the Prevalence of Type 2 Diabetes Mellitus: Comparison Study with Triglyceride-Glucose Index
Ho Jin Kim*, Jun Sung Moon*, Il Rae Park, Joong Hee Kim, Ji Sung Yoon, Kyu Chang Won, Hyoung Woo Lee Department of Internal Medicine, Yeungnam University College of Medicine, Daegu, Korea
Background: Plasma soluble cluster determinant 36 (sCD36) level is closely related with insulin resistance and atherosclerosis, but little is known whether it could be a surrogate for estimating risk of developing diabetes or not. To address this, we evaluated associ- ation between sCD36 index, the product of sCD36 and fasting plasma glucose (FPG), and the prevalence of type 2 diabetes mellitus (T2DM), and then compared with triglyceride-glucose (TyG) index which has been suggested simple index for insulin resistance.
Methods: This was cross-sectional study, and participants were classified as normal glucose tolerance (NGT), prediabetes, and T2DM according to glucose tolerance. The formula of TyG index was ‘ln [FPG (mg/dL)×triglyceride (mg/dL)/2],’ and the sCD36 index was ‘ln [sCD36 (pg/mL)×FPG (mg/dL)/2].’
Results: One hundred and fifty-five subjects (mean age, 55.2 years) were enrolled, and patients with T2DM were 75. Both indexes were significantly increased in prediabetes and T2DM rather than NGT, and sCD36 index was positively correlated with both glyco- sylated hemoglobin and homeostasis model assessment of insulin resistance (r=0.767 and r=0.453, respectively; P<0.05) and neg- atively with homeostasis model assessment estimate of β-cell function (r=–0.317). The odds ratio (OR) of sCD36 index for T2DM was 4.39 (95% confidential interval, 1.51 to 12.77) after adjusting age, gender, blood pressure, smoking, alcohol, non-high density lipoprotein cholesterol and high-sensitivity C-reactive protein. However, OR of TyG index did not remained significance after ad- justment.
Conclusion: sCD36 index has an independent association with the risk of T2DM, and showed better correlation than TyG index.
These results suggest sCD36 index might be useful surrogate marker for the risk of diabetes.
Keywords: CD36; CD36 index; TyG index; Insulin resistance; Diabetes mellitus, type 2
INTRODUCTION
As the incidence and prevalence of type 2 diabetes mellitus (T2DM) continues to rise worldwide, estimating the risk of dia- betes in general population becomes more important to mini-
mize the high morbidity and increasing socioeconomic costs as- sociated with this disease [1,2].
It is well established that insulin resistance precedes dysgly- cemia; thus, evaluating parameters associated with metabolic dysfunction (e.g., abdominal adiposity, dyslipidemia) could be
Received: 25 April 2017, Revised: 5 July 2017, Accepted: 6 July 2017 Corresponding author: Hyoung Woo Lee
Department of Internal Medicine, Yeungnam University College of Medicine, 170 Hyeonchung-ro, Nam-gu, Daegu 42415, Korea
Tel: +82-53-620-3839, Fax: +82-53-654-3486, E-mail: [email protected]
*These authors contributed equally to this work.
Copyright © 2017 Korean Endocrine Society
This is an Open Access article distributed under the terms of the Creative Com- mons Attribution Non-Commercial License (http://creativecommons.org/
licenses/by-nc/4.0/) which permits unrestricted non-commercial use, distribu- tion, and reproduction in any medium, provided the original work is properly cited.
helpful to predict the development of diabetes [3,4]. Even though hyperinsulinemic-euglycemic clamp study was suggest- ed as a gold standard test measuring insulin resistance [5], it is not practical in real world due to the problem of time, labor, and cost. For these reasons, several simple indexes for estimating insulin resistance and the risk of diabetes have been suggested.
The triglyceride-glucose (TyG) index, the product of (fasting plasma glucose [FPG]) and triglycerides (TG), has been sug- gested as a simple surrogate of insulin resistance in healthy sub- jects [6-8]. Previous studies showed that the TyG index is corre- lated with insulin resistance using homeostasis model assess- ment of insulin resistance (HOMA-IR) [9,10], the insulin sup- pression test [7], and the hyperinsulinemic-euglycemic clamp [5,10]. However, the reliability of these indexes has been ques- tioned because TG levels are easily affected by alcohol con- sumption or diet.
Cluster determinant 36 (CD36), a fatty acid transporter and scavenger receptor, is a transmembrane glycoprotein expressed on a variety of cells and tissues and has a number of tissue-spe- cific functions [11]. CD36 is involved in lipid metabolism and homeostasis, and recently its up-regulation is reported to con- tribute to pancreatic β-cell dysfunction relevant to glucotoxicity [12-15]. In addition, plasma level of soluble CD36 (sCD36) has been strongly implicated in pathological conditions associated with metabolic dysregulation, including obesity, insulin resis- tance, diabetes, and atherosclerosis in large human trials [11,16,17]. Thus, sCD36 is drawing attention as a novel bio- marker of insulin resistance. However, little is known about the possible association between sCD36 and the risk of T2DM in the general population. To address this issue, sCD36 levels were assessed in individuals with normal glucose tolerance (NGT), prediabetes, and diabetes. Next, we calculated the TyG index and compared this prognostic formula (i.e., the sCD36 index) with the TyG index, to assess its usefulness in predicting the risk of T2DM.
METHODS
Study population
This was a cross-sectional study. Between January 2005 and April 2013, 159 subjects visiting the Yeungnam University Health Promotion Center and the Endocrinology Department, Daegu, Korea were enrolled. Informed consent was obtained from all individual participants included in the study. Their ages ranged from 32 to 79 years. Individuals having type 1 diabetes mellitus (n=3), severe anemia (hemoglobin <8 g/dL), chronic
kidney disease (serum creatinine >1.5 mg/dL), and abnormal liver function test (total or direct bilirubin, aspartate transami- nase, or alanine transaminase >2-fold of upper normal limits) were excluded. A patient was given pioglitazone was also ex- cluded (n=1), because thiazolidinedione could affect plasma sCD36 level [18]. The study protocol was approved by the Insti- tutional Review Board of Yeungnam University Medical Center (YUMC2014-11-002). All procedures followed were in accor- dance with the ethical standards of the responsible committee on human experimentation (institutional and national) and with the Helsinki Declaration of 1975, as revised in 2008. Diabetes and prediabetes (impaired fasting glucose and/or impaired glu- cose tolerance) were defined according to the guidelines of the American Diabetes Association [19]. The criteria for the diag- nosis of diabetes were glycosylated hemoglobin (HbA1c) ≥ 6.5% or FPG ≥126 mg/dL. Self-reported diabetes medication use and/or self-reported medical diagnosis of diabetes (other than gestational diabetes) were also included. Prediabetes was defined as FPG 100 to 125 mg/dL or HbA1c 5.7% to 6.4%.
Clinical examination, laboratory measurements, and indexes
The waist circumference (WC) was measured in the morning, before breakfast, with light indoor clothing and no shoes, ac- cording to standard protocols. The body mass index (BMI) was calculated as weight (kg) divided by the square of height in me- ters (m2). Blood pressure was measured with a standard sphyg- momanometer after at least 10 minutes of rest in the sitting po- sition. Venous blood samples were obtained from each individ- ual after a 12-hour overnight fast. FPG was measured using the hexokinase method (AU 5400 Autoanalyzer, Olympus, Tokyo, Japan). HbA1c was measured by high-performance liquid chro- matography (HLC-723G7, Tosoh, Tokyo, Japan). Total choles- terol was measured by enzyme colorimetry (Kyowa Medex Co.
Ltd., Tokyo, Japan). TG levels were measured using the glycer- ol elimination method. High density lipoprotein cholesterol (HDL-C) was measured using direct enzymatic assays (Kyowa Medex Co. Ltd.). Low density lipoprotein (LDL) cholesterol was calculated using Friedewald’s formula. Insulin was mea- sured using an immunoradiometric assay (DIAsource Immuno- Assays S.A., Ottignies-Louvain-la-Neuve, Belgium). The sCD36 was measured using ELISA (Aviscera Bioscience, Santa Clara, CA, USA). HOMA-IR was estimated with the formula:
fasting insulin (U/mL)×FPG (mmol/L)/22.5 [20]. The TyG in- dex was calculated as the ‘ln [FPG (mg/dL)×TG (mg/dL)/2].’
We used sCD36, has been known as surrogate marker of insulin
resistance, substitute for TG and calculated sCD36 index as fol- lowing: sCD36 index=ln [sCD36 (pg/mL)×FPG (mg/dL)/2].
Both the TyG index and the sCD36 index are expressed in a logarithmic scale.
Statistical analysis
All numerical variables were expressed as mean±standard de- viation. Categorical data were expressed as percentages. Differ- ences between more than two groups were estimated using one- way analysis of variance with Turkey post hoc test. Pearson correlation coefficient was calculated to express the strength of the relationship between continuous values. Multivariate logis- tic regression analyses were performed to estimate the odds ra- tio (OR) for the prevalence of T2DM using sCD36, TyG index,
and sCD36 index. Receiver operating characteristic (ROC) curves were used to assess the ability of the surrogate measures for presence of T2DM. All statistical analyses were performed using IBM SPSS version 20.0 (IBM Co., Armonk, NY, USA). A value of P<0.05 was considered to indicate statistical signifi- cance.
RESULTS
A total of 155 subjects (90 men; mean age, 55.2±10.1 years) were finally included in this study. Participants were catego- rized into three groups: NGT (n=34), prediabetes (n=46), and T2DM (n=75); the baseline characteristics of the subjects are shown in Table 1. The overall means for sCD36, the TyG index,
Table 1. Clinical Characteristics of the Subjects
Characteristic NGT (n=34) Prediabetes (n=46) T2DM (n=75) P value
Age, yr 51.9±9.8 55.5±10.3 56.3±9.6 NS
Male sex, % 55.9 65.2 53.3 NS
Height, cm 164.1±9.8 163.5±8.9 162.8±8.7 NS
Weight, kg 63.2±9.8 65.8±11.1 64.5±11.7 NS
BMI, kg/m2 23.6±2.7 24.8±2.5 24.3±3.8 NS
Waist circumference, cm 80.29±7.78 82.46±7.10 87.00±8.50 0.017
SBP, mm Hg 123.4±13.3. 127.0±13.5 131.5±16.1 0.026
DBP, mm Hg 75.3±10.0 77.4±8.6 80.6±11.7 0.032
Hypertension, % 11.8 28.3 53.3 <0.001
Smoking 7 (20.6) 8 (17.4) 20 (26.7) NS
Alcohol 20 (58.8) 24 (52.2) 27 (36.0) 0.022
Total cholesterol, mg/dL 195.7±40.6 206.4±41.8 189.9±41.3 NS
Triglyceride, mg/dL 83.9±51.5 127.0±78.0 153.9±112.0 0.001
HDL-C, mg/dL 57.2±13.5 49.6±10.1 48.9±16.0 0.013
hs-CRP, mg/dL 0.34±1.34 0.16±0.27 1.33±4.50 NS
FPG, mg/dL 92.1±10.3 100.7±21.4 179.8±85.1 <0.001
HbA1c, % 5.4±0.2 5.9±0.2 9.4±2.4 <0.001
Insulin, μU/L 6.6±3.0 6.9±2.6 11.0±11.7 0.008
HOMA-IR 1.5±0.8 1.7±0.8 5.1±6.3 <0.001
HOMA-B 91.6±59.3 87.5±77.1 61.0±83.8 NS
sCD36, pg/mL 39.5±15.1 73.8±50.7 205.9±83.7 <0.001
TyG index 8.1±0.6 8.6±0.58 9.23±0.9 <0.001
sCD36 index 7.5±0.3 8.0±0.6 9.6±0.9 <0.001
Values are expressed as mean±standard deviation or number (%). P values for trend, comparison of the mean values by a one-way analysis of variance.
Nominal variables were compared by chi-square test.
NGT, normal glucose tolerance; T2DM, type 2 diabetes mellitus; NS, not significant; BMI, body mass index; SBP, systolic blood pressure; DBP, diastol- ic blood pressure; HDL-C, high density lipoprotein cholesterol; hs-CRP, high-sensitivity C-reactive protein; FPG, fasting plasma glucose; HbA1c, gly- cosylated hemoglobin; HOMA-IR, homeostasis model assessment of insulin resistance; HOMA-B, homeostasis model assessment estimate of β-cell function; TyG, triglyceride-glucose; sCD36, soluble cluster determinant 36.
and the sCD36 index in the study population were 130.97±
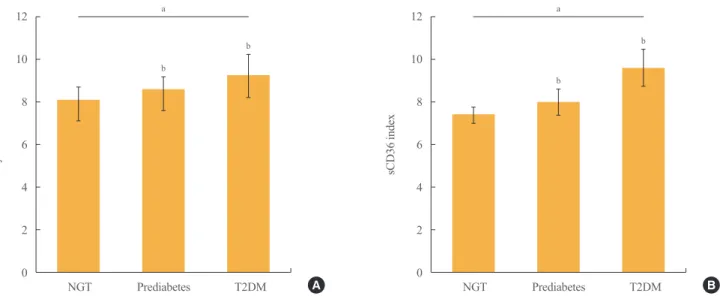
98.72 pg/mL, 8.80±0.91, and 9.37±1.17, respectively. There were no differences in age, sex, BMI, and smoking behavior among groups, whereas HDL-C was lower in the T2DM group than in the prediabetes and NGT groups (P<0.05). WC, systolic blood pressure (SBP), diastolic blood pressure (DBP), TG, FPG, HbA1c, insulin, HOMA-IR, and sCD36 were higher in the prediabetes and T2DM groups compared to those in NGT controls. In addition, both the TyG and the sCD36 indexes were found to be higher in prediabetes and T2DM group than in the NGT group (Fig. 1).
In linear correlation analyses, the TyG index and the sCD36 index were both significantly correlated with several metabolic variables related to diabetes (Table 2). Both indexes had posi- tive correlation with HbA1c and HOMA-IR, and negative with homeostasis model assessment estimate of β-cell function. In particular, the sCD36 index was strongly correlated with the glycemic control status (r=0.767, P<0.001).
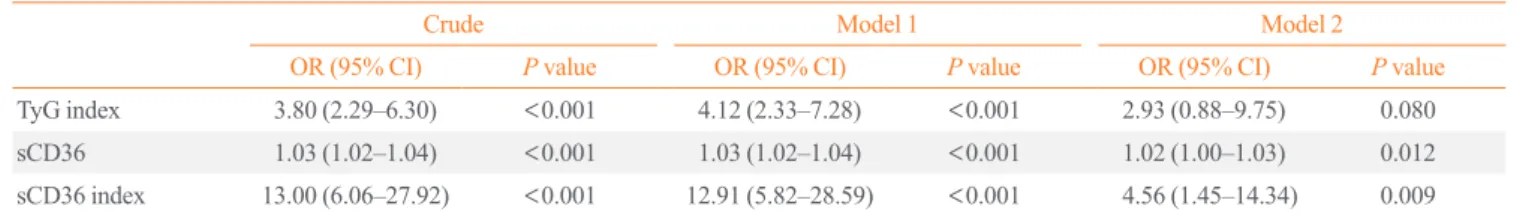
The possible association between the sCD36 index and the risk of T2DM was explored (Table 3). The OR of TyG index, plasma sCD36, and sCD36 index for the prevalence of T2DM were 3.81, 1.03, and 13.11, respectively (P<0.001) in logistic regression analysis. The sCD36 index was significantly associ- ated with the risk of T2DM after adjustment for age, sex, BMI, SBP, DBP, smoking, non-HDL-C, and high-sensitivity C-reac- tive protein (OR, 4.39; 95% confidence interval, 1.51 to 12.77;
P=0.007), but not the TyG index.
ROC curves of the sCD36 index for predicting T2DM are shown in Fig. 2. In regard to T2DM, the area under the ROC
12 10 8 6 4 2 0
12 10 8 6 4 2 0
TyG index sCD36 index
a a
b
b
b b
NGT Prediabetes T2DM NGT Prediabetes T2DM
Fig. 1. Comparison of triglyceride-glucose (TyG) index (A) and soluble cluster determinant 36 (sCD36) index (B) according to glucose tol- erance. (A) TyG index was significantly increased in type 2 diabetes mellitus (T2DM) compared with normal glucose tolerance (NGT) and prediabetes. (B) sCD36 index was significantly increased in T2DM compared with NGT and prediabetes. Differences were analyzed by analysis of variance, followed by Tukey test, aP<0.05 for trends; bP< 0.05 for post hoc analysis vs. NGT.
A B
Table 2. Correlations between TyG Index and sCD36 Index and Parameters in All Study Subjects
Parameter Coefficient of correlation (r) TyG index sCD36 index
BMI, kg/m2 0.101 –0.017
Waist circumference, cm 0.274a 0.345b Fasting glucose, mg/dL 0.820b 0.791b
Fasting insulin, μU/L 0.225a 0.224a
Total cholesterol, mg/dL 0.266a 0.015
Triglycerides, mg/dL 0.862b 0.533b
HDL-C, mg/dL –0.389b –0.236a
hs-CRP, mg/dL 0.119 0.320b
HbA1c, % 0.454b 0.765b
HOMA-IR 0.498b 0.450b
HOMA-B –0.309b –0.317b
Pearson coefficient of correlation.
TyG, triglyceride-glucose; sCD36, soluble cluster determinant 36; BMI, body mass index; HDL-C, high density lipoprotein cholesterol; hs-CRP, high-sensitivity C-reactive protein; HbA1c, glycosylated hemoglobin;
HOMA-IR, homeostasis model assessment of insulin resistance;
HOMA-B, homeostasis model assessment estimate of β-cell function.
aP<0.05; bP<0.001.
curve (AUC) for the sCD36 index and TyG index were 0.948 and 0.758, respectively, and AUC of sCD36 index was signifi- cantly higher than that of TyG index (P<0.001). ROC analysis showed that the sCD36 index had a slightly better performance than HOMA-IR (data not shown; AUC, 0.774; P<0.001) and the TyG index in identifying patients with T2DM.
DISCUSSION
In this study, we found that sCD36 was increased according to abnormal glucose tolerance, and novel and simple index using sCD36 was closely correlated with glycemic status, insulin re- sistance, and β-cell dysfunction. Furthermore, an increment in sCD36 index was positively associated with the risk of T2DM even after adjusted by several risk factors. The sCD36 index
showed better diagnostic value than TyG index.
Previous studies have indicated that sCD36 is strongly corre- lated with insulin resistance and the development of diabetes [17,18,21,22]. For instance, Handberg et al. [17] reported that sCD36 is up to 4.5-fold higher in plasma from obese T2DM pa- tients than in lean healthy control subjects and is closely associ- ated with insulin resistance [18]. Circulating CD36 was also shown to be associated with T2DM in chronic kidney disease patients [23] and was found to be increased in prediabetic con- ditions, such as in obese individuals and/or women with poly- cystic ovarian syndrome (PCOS), which often show progressive insulin resistance. In this regard, pioglitazone treatment has shown to reduce sCD36 while improving insulin-sensitivity in PCOS patients [17,18]. Our result corroborates previous find- ings that the plasma CD36 level increased according to state of glucose tolerance and insulin resistance, so sCD36 is considered to be useful surrogate marker of diabetes and metabolic disor- ders.
The mechanism underlying the positive association between the sCD36 index and T2DM is unclear, but evidences implicate CD36 (either membrane bound form or free form) contribute development of insulin resistance and diabetes. CD36 plays an important role in fatty acid transport in many cell types, and mainly expressed in hepatocyte, adipose tissue, and skeletal muscle. During obesity and T2DM, recruitment of CD36 is re- ported to be enhanced in cellular membrane [24-26] and cellular uptake of fatty acids also increased. Increased CD36-mediating fatty acids influx impair insulin sensitivity in liver and skeletal muscle, and it could lead to the development of T2DM [27].
Moreover, prolonged exposure to elevated levels of fatty acids causes lipotoxicity in pancreatic β-cells, leading to dysfunction and apoptosis [28]. Zhang et al. [29] found increased expres- sions of macrophage CD36 and increased levels of oxidized LDL (oxLDL) in a poorly controlled diabetic population com- pared with those in a controlled one. In addition, Kennedy and Table 3. OR for TyG Index, sCD36, and sCD36 Index on the Prevalence of Type 2 Diabetes Mellitus
Crude Model 1 Model 2
OR (95% CI) P value OR (95% CI) P value OR (95% CI) P value
TyG index 3.80 (2.29–6.30) <0.001 4.12 (2.33–7.28) <0.001 2.93 (0.88–9.75) 0.080 sCD36 1.03 (1.02–1.04) <0.001 1.03 (1.02–1.04) <0.001 1.02 (1.00–1.03) 0.012 sCD36 index 13.00 (6.06–27.92) <0.001 12.91 (5.82–28.59) <0.001 4.56 (1.45–14.34) 0.009 Model 1: adjusted for age, gender, body mass index, systolic and diastolic blood pressure, smoking, and alcohol drinking. Model 2: adjusted for model 1+non-high density lipoprotein cholesterol and high-sensitivity C-reactive protein.
OR, odds ratio; TyG, triglyceride-glucose; sCD36, soluble cluster determinant 36; CI, confidence interval.
1.0 0.8 0.6 0.4 0.2
Sensitivity
0 0.2 0.4 0.6 0.8 1.0 1-Sensitivity
sCD36 index TyG index Reference
Fig. 2. Receiver operating characteristic (ROC) curves of triglycer- ide-glucose (TyG) index and soluble cluster determinant 36 (sCD36) index in the identification of type 2 diabetes mellitus. The area under the ROC curve for each index is in parentheses.
Kashyap et al. [30] demonstrated that oxLDL-induced CD36- dependent changes in adipocytes are associated with important physiologic correlates of insulin resistance in vitro, including impaired glucose uptake, adiponectin secretion, and increased lipolysis. CD36 expression is also associated with hepatic ste- atosis, leading to the development of insulin resistance and both local and systemic, low-grade inflammation, adding to the risk of diabetes [31,32].
It is not still clear whether the increase in sCD36 is a cause or a result of metabolic disorders, but recent findings suggested the role of sCD36 involving the inflammation process. CD36 is lo- cated in the intracellular vesicles as an inactive form, and when exposed to a ligand, it is expressed to the cell membrane in an active form [33]. It has been reported that the level of cell de- rived microparticles is increased in diabetic conditions [34]. In accordance with this finding, recent studies suggested a possi- bility for shedding of the CD36 receptor in the soluble form from adipocyte, skeletal muscle, and renal tubular cells [35]. In- creased level of CD36 expression on macrophage was reported in abnormal glucose tolerance, and it was positively correlated with the pro-inflammatory cytokine interleukin 6 levels [36].
CD36 expression on monocyte surface was also increased in patients with T2DM. Another study reported that CD36 in- volved in inflammation process in proximal tubular cells of kid- ney [35]. Thus, elevated level of sCD36 from macrophage and monocyte might contribute the inflammatory process in diabetic conditions. Taken together, these findings are thought to be the cause of diabetes, not the result, and CD36 might be a therapeu- tic target as well as biomarker in the diabetes.
Consistent with previous results, in this study, the TyG index was elevated in patients with T2DM compared with that in pa- tients with NGT and prediabetes [8,37-39]. Despite its conve- nience from the clinical perspective, the accuracy of the TyG in- dex could be limited. For instance, although TG was suggested to be an independent risk factor for diabetes [40,41], TG levels are highly influenced by high carbohydrate diet, alcohol intake, and lifestyle factors such as physical activity. Nevertheless, in view of the convenience and relative low cost, TG measure- ments are widely performed in the clinical practice. In our study, the TyG index did not perform better than the HOMA-IR index, although its AUC was similar to that observed in a previous study [10]. In contrast, the sCD36 index showed better diagnos- tic performance and might be more useful than the TyG index in identifying individuals at a high risk of developing diabetes.
To the best of our knowledge, this is the first study proposing a prognostic formula that combines sCD36 and FPG to evaluate
the risk of T2DM. Moreover, sCD36 index found to have better performance than index using TG. However, our study has cer- tain limitations. First, the cross-sectional design of this study did not allow causal relationships to be determined. Second, some medications or medical conditions in our patient population may have affected the levels of sCD36, obscuring the actual im- pact of our findings [14,18]. Third, the cost-effectiveness of the method needs to be assessed. To validate the usefulness of this index, prospective, large-scale studies are needed for popula- tions at high risk for T2DM.
In conclusion, the sCD36 index was significantly increased in patients with T2DM than in peoples with normoglycemia or prediabetes. When compared with sCD36 alone or with the TyG index, the sCD36 index showed a better association with the risk of developing T2DM. These findings suggest that the sCD36 index might be useful to predict the development of dia- betes and the presence of metabolic disorders associated with insulin resistance in the general population.
CONFLICTS OF INTEREST
No potential conflict of interest relevant to this article was re- ported.
ACKNOWLEDGMENTS
This study was supported by research fund of Daegu-Gyeong- Buk Branch of Korean Endocrine Society (2016).
ORCID
Jun Sung Moon https://orcid.org/0000-0003-1569-3068
REFERENCES
1. Shaw JE, Sicree RA, Zimmet PZ. Global estimates of the prevalence of diabetes for 2010 and 2030. Diabetes Res Clin Pract 2010;87:4-14.
2. Wild S, Roglic G, Green A, Sicree R, King H. Global preva- lence of diabetes: estimates for the year 2000 and projec- tions for 2030. Diabetes Care 2004;27:1047-53.
3. Boyko EJ, Fujimoto WY, Leonetti DL, Newell-Morris L.
Visceral adiposity and risk of type 2 diabetes: a prospective study among Japanese Americans. Diabetes Care 2000;23:
465-71.
4. Ford ES. Body mass index, diabetes, and C-reactive protein
among U.S. adults. Diabetes Care 1999;22:1971-7.
5. Guerrero-Romero F, Simental-Mendia LE, Gonzalez-Ortiz M, Martinez-Abundis E, Ramos-Zavala MG, Hernandez- Gonzalez SO, et al. The product of triglycerides and glu- cose, a simple measure of insulin sensitivity. Comparison with the euglycemic-hyperinsulinemic clamp. J Clin Endo- crinol Metab 2010;95:3347-51.
6. Du T, Yuan G, Zhang M, Zhou X, Sun X, Yu X. Clinical usefulness of lipid ratios, visceral adiposity indicators, and the triglycerides and glucose index as risk markers of insulin resistance. Cardiovasc Diabetol 2014;13:146.
7. Abbasi F, Reaven GM. Comparison of two methods using plasma triglyceride concentration as a surrogate estimate of insulin action in nondiabetic subjects: triglycerides × glu- cose versus triglyceride/high-density lipoprotein cholesterol.
Metabolism 2011;60:1673-6.
8. Lee SH, Kwon HS, Park YM, Ha HS, Jeong SH, Yang HK, et al. Predicting the development of diabetes using the prod- uct of triglycerides and glucose: the Chungju Metabolic Disease Cohort (CMC) study. PLoS One 2014;9:e90430.
9. Simental-Mendia LE, Rodriguez-Moran M, Guerrero- Romero F. The product of fasting glucose and triglycerides as surrogate for identifying insulin resistance in apparently healthy subjects. Metab Syndr Relat Disord 2008;6:299- 304.
10. Vasques AC, Novaes FS, de Oliveira Mda S, Souza JR, Ya- manaka A, Pareja JC, et al. TyG index performs better than HOMA in a Brazilian population: a hyperglycemic clamp validated study. Diabetes Res Clin Pract 2011;93:e98-100.
11. Febbraio M, Hajjar DP, Silverstein RL. CD36: a class B scavenger receptor involved in angiogenesis, atherosclero- sis, inflammation, and lipid metabolism. J Clin Invest 2001;
108:785-91.
12. Moon JS, Karunakaran U, Elumalai S, Lee IK, Lee HW, Kim YW, et al. Metformin prevents glucotoxicity by allevi- ating oxidative and ER stress-induced CD36 expression in pancreatic beta cells. J Diabetes Complications 2017;31: 21- 30.
13. Kim YW, Moon JS, Seo YJ, Park SY, Kim JY, Yoon JS, et al. Inhibition of fatty acid translocase cluster determinant 36 (CD36), stimulated by hyperglycemia, prevents glucotoxici- ty in INS-1 cells. Biochem Biophys Res Commun 2012;420:
462-6.
14. Yoon JS, Moon JS, Kim YW, Won KC, Lee HW. The gluco- toxicity protecting effect of ezetimibe in pancreatic beta cells via inhibition of CD36. J Korean Med Sci 2016;31:
547-52.
15. Karunakaran U, Moon JS, Lee HW, Won KC. CD36 initiat- ed signaling mediates ceramide-induced TXNIP expression in pancreatic beta-cells. Biochim Biophys Acta 2015;1852:
2414-22.
16. Collot-Teixeira S, Martin J, McDermott-Roe C, Poston R, McGregor JL. CD36 and macrophages in atherosclerosis.
Cardiovasc Res 2007;75:468-77.
17. Handberg A, Levin K, Hojlund K, Beck-Nielsen H. Identifi- cation of the oxidized low-density lipoprotein scavenger re- ceptor CD36 in plasma: a novel marker of insulin resistance.
Circulation 2006;114:1169-76.
18. Glintborg D, Hojlund K, Andersen M, Henriksen JE, Beck- Nielsen H, Handberg A. Soluble CD36 and risk markers of insulin resistance and atherosclerosis are elevated in poly- cystic ovary syndrome and significantly reduced during pio- glitazone treatment. Diabetes Care 2008;31:328-34.
19. Inzucchi SE, Bergenstal RM, Buse JB, Diamant M, Ferran- nini E, Nauck M, et al. Management of hyperglycemia in type 2 diabetes, 2015: a patient-centered approach. Update to a position statement of the American Diabetes Associa- tion and the European Association for the Study of Diabetes.
Diabetes Care 2015;38:140-9.
20. Matthews DR, Hosker JP, Rudenski AS, Naylor BA,
Treacher DF, Turner RC. Homeostasis model assessment:
insulin resistance and beta-cell function from fasting plasma glucose and insulin concentrations in man. Diabetologia 1985;28:412-9.
21. Handberg A, Hojlund K, Gastaldelli A, Flyvbjerg A, Dekker JM, Petrie J, et al. Plasma sCD36 is associated with markers of atherosclerosis, insulin resistance and fatty liver in a non- diabetic healthy population. J Intern Med 2012;271:294-304.
22. Handberg A, Norberg M, Stenlund H, Hallmans G, Atter- mann J, Eriksson JW. Soluble CD36 (sCD36) clusters with markers of insulin resistance, and high sCD36 is associated with increased type 2 diabetes risk. J Clin Endocrinol Metab 2010;95:1939-46.
23. Chmielewski M, Bragfors-Helin AC, Stenvinkel P, Lind- holm B, Anderstam B. Serum soluble CD36, assessed by a novel monoclonal antibody-based sandwich ELISA, pre- dicts cardiovascular mortality in dialysis patients. Clin Chim Acta 2010;411:2079-82.
24. Han CY. Roles of reactive oxygen species on insulin resis- tance in adipose tissue. Diabetes Metab J 2016;40:272-9.
25. Bonen A, Tandon NN, Glatz JF, Luiken JJ, Heigenhauser GJ. The fatty acid transporter FAT/CD36 is upregulated in
subcutaneous and visceral adipose tissues in human obesity and type 2 diabetes. Int J Obes (Lond) 2006;30:877-83.
26. Aguer C, Mercier J, Man CY, Metz L, Bordenave S, Lam- bert K, et al. Intramyocellular lipid accumulation is associat- ed with permanent relocation ex vivo and in vitro of fatty acid translocase (FAT)/CD36 in obese patients. Diabetologia 2010;53:1151-63.
27. Paolisso G, Tataranni PA, Foley JE, Bogardus C, Howard BV, Ravussin E. A high concentration of fasting plasma non-esterified fatty acids is a risk factor for the development of NIDDM. Diabetologia 1995;38:1213-7.
28. Unger RH. Lipotoxicity in the pathogenesis of obesity-de- pendent NIDDM. Genetic and clinical implications. Diabe- tes 1995;44:863-70.
29. Zhang HM, Zhang XL, Zhou X, Li D, Gu JG, Wu JJ. Mech- anism linking atherosclerosis and type 2 diabetes: increased expression of scavenger receptor CD36 in monocytes. Chin Med J (Engl) 2005;118:1717-22.
30. Kennedy DJ, Kashyap SR. Pathogenic role of scavenger re- ceptor CD36 in the metabolic syndrome and diabetes. Metab Syndr Relat Disord 2011;9:239-45.
31. Zhou J, Febbraio M, Wada T, Zhai Y, Kuruba R, He J, et al.
Hepatic fatty acid transporter CD36 is a common target of LXR, PXR, and PPARgamma in promoting steatosis. Gas- troenterology 2008;134:556-67.
32. Koonen DP, Jacobs RL, Febbraio M, Young ME, Soltys CL, Ong H, et al. Increased hepatic CD36 expression contributes to dyslipidemia associated with diet-induced obesity. Diabe- tes 2007;56:2863-71.
33. Bonen A, Luiken JJ, Arumugam Y, Glatz JF, Tandon NN.
Acute regulation of fatty acid uptake involves the cellular redistribution of fatty acid translocase. J Biol Chem 2000;
275:14501-8.
34. Alkhatatbeh MJ, Enjeti AK, Acharya S, Thorne RF, Lincz LF. The origin of circulating CD36 in type 2 diabetes. Nutr Diabetes 2013;3:e59.
35. Shiju TM, Mohan V, Balasubramanyam M, Viswanathan P.
Soluble CD36 in plasma and urine: a plausible prognostic marker for diabetic nephropathy. J Diabetes Complications 2015;29:400-6.
36. Handberg A, Lopez-Bermejo A, Bassols J, Vendrell J, Ricart W, Fernandez-Real JM. Circulating soluble CD36 is associ- ated with glucose metabolism and interleukin-6 in glucose- intolerant men. Diab Vasc Dis Res 2009;6:15-20.
37. Navarro-Gonzalez D, Sanchez-Inigo L, Pastrana-Delgado J, Fernandez-Montero A, Martinez JA. Triglyceride-glucose index (TyG index) in comparison with fasting plasma glu- cose improved diabetes prediction in patients with normal fasting glucose: the Vascular-Metabolic CUN cohort. Prev Med 2016;86:99-105.
38. Janghorbani M, Almasi SZ, Amini M. The product of tri- glycerides and glucose in comparison with fasting plasma glucose did not improve diabetes prediction. Acta Diabetol 2015;52:781-8.
39. Lee SH, Yang HK, Ha HS, Lee JH, Kwon HS, Park YM, et al. Changes in metabolic health status over time and risk of developing type 2 diabetes: a prospective cohort study. Med- icine (Baltimore) 2015;94:e1705.
40. Ginsberg HN, Zhang YL, Hernandez-Ono A. Regulation of plasma triglycerides in insulin resistance and diabetes. Arch Med Res 2005;36:232-40.
41. Szapary PO, Bloedon LT, Foster GD. Physical activity and its effects on lipids. Curr Cardiol Rep 2003;5:488-92.