Evaluation of Femoral Neck Bone Mineral Density and Radiographic Hand and Knee Osteoarthritis
in a Korean Elderly Population
Kee Jeong Bae, MD, Hyun Sik Gong, MD*, Ki Woong Kim, MD
†, Tae Kyun Kim, MD*, Chong Bum Chang, MD, Hak Chul Jang, MD
‡, Goo Hyun Baek, MD
§Department of Orthopedic Surgery, Seoul National University Boramae Medical Center, Seoul,
Departments of *Orthopedic Surgery, †Neuropsychiatry, and ‡Internal Medicine, Seoul National University Bundang Hospital, Seongnam,
§Department of Orthopedic Surgery, Seoul National University Hospital, Seoul, Korea
Received October 10, 2013; Accepted November 23, 2013 Correspondence to: Hyun Sik Gong, MD
Department of Orthopedic Surgery, Seoul National University Bundang Hospital, Seoul National University College of Medicine, 82 Gumi-ro 173beon-gil, Bundang-gu, Seongnam 463-707, Korea
Tel: +82-31-787-7198, Fax: +82-31-787-4056 E-mail: [email protected]
Osteoporosis and osteoarthritis (OA) are common condi- tions in the elderly, and the incidences of both increase with age. However, it has been suggested that the simul- taneous occurrence of these two conditions in the same patient is uncommon, and that there may be an inverse
Background: Reports on the relationship between osteoporosis and osteoarthritis (OA) have tended to disagree, especially in non-weight bearing joints such as the hand joints. We aimed to investigate the relationship between bone mineral density (BMD) and hand and knee OA in a general Korean elderly population.
Methods: We evaluated femur neck BMD and the hand and knee radiographs of 143 men and 123 women over 65 years of age who participated in a population-based cohort study. The Kellgren-Lawrence criteria for grading OA were implemented, and grade 2 or higher were categorized as radiographic OA. BMD was compared according to the existence of radiographic OA in the hand and knee using analysis of covariance, and correlation analyses were performed to explore the relationship between BMD and radiographic OA grade.
Results: After controlling for age and body mass index, there was no significant difference in BMD between participants with and without hand OA (p = 0.717 in male and p = 0.862 in female), between those with and without knee OA (p = 0.974 in male and p = 0.563 in female), and between those with only hand OA and those with only knee OA (p = 0.920 in male and p = 0.961 in female).
Furthermore, there was no significant correlation between BMD and the radiographic OA grade of the hands (p = 0.182 in male and p = 0.897 in female) and knees (p = 0.245 in male and p = 0.098 in female).
Conclusions: In our cohort of the general Korean elderly population, no association was found between osteoporosis and OA, regardless of the weight bearing status of the joints.
Keywords: Osteoporosis, Osteoarthritis, Weight bearing, Bone mineral density, Korean population
relationship between osteoporosis and OA.1-3) Several epidemiologic studies have confirmed that high bone mineral density (BMD) is observed in patients with OA in the weight bearing joints, such as the hip and knee.4-8) As a possible mechanism, Radin et al.9) hypothesized that an increase in subchondral bone density would increase its stiffness, which may lead to an overload of the overlying cartilage to induce OA. Another hypothesis for the as- sociation of high BMD and OA is that the two conditions share common risk factors, such as more weight bearing activities.10)
In the non-weight bearing joints such as the hand,
Copyright © 2014 by The Korean Orthopaedic Association
This is an Open Access article distributed under the terms of the Creative Commons Attribution Non-Commercial License (http://creativecommons.org/licenses/by-nc/3.0) which permits unrestricted non-commercial use, distribution, and reproduction in any medium, provided the original work is properly cited.
Clinics in Orthopedic Surgery • pISSN 2005-291X eISSN 2005-4408
however, reports on the relationship between osteoporo- sis and OA have tended to disagree.6,11-20) Some earlier epidemiologic studies reported results similar to the hip and knee joints.6,11) However, recent studies suggested a contradictory relationship between BMD and OA in the hand.12-20) As for such opposite results, some authors sug- gested different resistance to mechanical loading in the hand joints,16,18) while others proposed that inflammatory pathways involved in hand OA might induce osteopo- rosis, as in systemic OA.17) The partly contradictory data between the different studies may be due to differences in the diagnostic criteria regarding OA, presence of multiple digits and joints in the hand, or ethnic or genetic differ- ences in the study participants.
There have been only a few studies that simultane- ously analyzed the relationship between BMD and OA of both the weight bearing and non-weight bearing joints in the same population.6,14,15) In one epidemiologic study about premenopausal women, authors reported that a high BMD was associated with OA in both the hand and knee.6) In contrast, another epidemiologic study found that higher bone loss was observed only in hand OA of women, not in knee OA.15) However, in a study done on Japanese women, the association of peripheral bone mass with knee and hand OA was less clear.14) No study looking at BMD and OA of both the hand and knee has been performed in Koreans as of yet. As such, we conducted this population based cross-sectional study in elderly Koreans, and exam- ined the relationship between BMD and hand and knee OA.
METHODS
Subjects
This study was conducted as a sub-study of a population- based prospective cohort study of health, aging, and com- mon geriatric diseases in elderly Koreans, and baseline data were collected from September 2005 to August 2006 on residents of Seongnam city, South Korea. The baseline data set were used for this cross-sectional study. Candi- dates were randomly drawn from a roster of all individuals aged 65 years or older in Seongnam city using a computer- generated list of resident registration numbers. A total of 1,118 residents were invited to participate in the study by letter and telephone, of which 696 residents agreed to participate (a response rate of 62.3%). Among them, par- ticipants with a past history of trauma or surgery around the hand, knee, and hip joints were excluded. Participants with history of rheumatoid arthritis were also excluded.
Finally, the remaining 266 subjects were enrolled, and had completed hand and knee radiographs and BMD mea- surement. The mean age was 70.8 ± 4.4 years (range, 65 to 87 years), and the study population was composed of 143 men (53.8%) and 123 women (46.2%). There were no sig- nificant differences in the age and body mass index (BMI) distribution between the men and women (Table 1). This study was approved by the Institutional Review Board of the authors’ hospital, and informed consent was obtained from all participants.
Radiographic Assessments of Hand and Knee OA A standard posteroanterior radiograph of the dominant
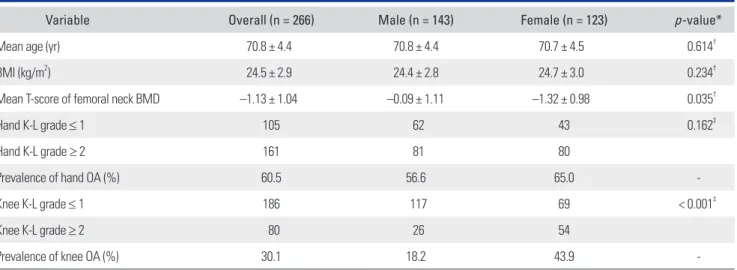
Table 1. Baseline Characteristics and Measurements of the Participants
Variable Overall (n = 266) Male (n = 143) Female (n = 123) p-value*
Mean age (yr) 70.8 ± 4.4 70.8 ± 4.4 70.7 ± 4.5 0.614†
BMI (kg/m2) 24.5 ± 2.9 24.4 ± 2.8 24.7 ± 3.0 0.234†
Mean T-score of femoral neck BMD –1.13 ± 1.04 –0.09 ± 1.11 –1.32 ± 0.98 0.035†
Hand K-L grade ≤ 1 105 62 43 0.162‡
Hand K-L grade ≥ 2 161 81 80
Prevalence of hand OA (%) 60.5 56.6 65.0 -
Knee K-L grade ≤ 1 186 117 69 < 0.001‡
Knee K-L grade ≥ 2 80 26 54
Prevalence of knee OA (%) 30.1 18.2 43.9 -
BMI: body mass index, BMD: bone mineral density, K-L: Kellgren-Lawrence, OA: osteoarthritis.
*Comparison between male and female. †Using Student t-test. ‡Using Fisher exact test.
hand was taken for all participants and evaluated for hand OA using a picture archiving and communication system (IMPAX, Impax: Agfa, Antwerp, Belgium). Fifteen joints of the dominant hand (4 distal interphalangeal joints, 4 proximal interphalangeal joints, 5 metacarpophalangeal joints, the first interphalangeal joint, and the first carpo- metacarpal joint) were graded from 0 to 4 for OA using the Kellgren-Lawrence (K-L) criteria. According to this grading scale, grade 0 indicates no OA; grade 1 (doubtful OA), possible osteophytes only; grade 2 (minimal OA), definite osteophytes and possible cysts; grade 3 (moder- ate OA), moderate osteophytes with definite joint space narrowing and some sclerosis; grade 4 (severe OA), large osteophytes and bony sclerosis with severe joint space nar- rowing. The worst grade overall among the fifteen joints of the dominant hand was chosen as the radiographic hand OA grade for each participant, and those participants with grade 2 or higher were categorized as having radiographic hand OA. Two kinds of radiographs for both knee joints (a weight bearing anteroposterior radiograph and a postero- anterior radiograph made with the knee in 45° of flexion) were evaluated for knee OA. The radiographs of each knee were graded separately according to the K-L criteria, and the worse grade of the two was chosen as the radiographic knee OA grade. Participants with grade 2 or higher were categorized as having radiographic knee OA.
Radiographs were evaluated by two of the authors, who are orthopedic surgeons and were blinded to all other subject information, such as age, sex, BMI, status of the other joints, and the value of BMD. Intraobserver reliability was evaluated by having the examiner repeat all radiographic assessments after 3 weeks. Interobserver reliability was evaluated by having all radiographs assessed by two examiners. The intraobserver and interobserver reliabilities were tested by Cohen kappa coefficients. The kappa coefficient for the intraobserver reliability was 0.899 (p = 0.031), and for interobserver reliability was 0.831 (p
= 0.029). Thus, the radiographic assessments of only one examiner were used in the analysis, given the high interob- server reliability.
Measurements of BMD
Femoral neck BMD was measured in the all participants by dual-energy X-ray absorptiometry (DXA; GE Lunar Prodigy, Prodigy encore software ver. 10.50.086, Madison, WI, USA). T-scores were calculated by using the differ- ence between the measured BMD and the mean BMD of healthy young adults matched for sex and ethnicity, divided by the standard deviation (SD) of the young adult population.
Data Analysis
A minimum sample size of 84 participants was required to detect a correlation of greater than r = 0.3 between the T-score of the BMD and the radiographic OA grades of the hand and knee, with a power of 80% (meaning that the chance that a true correlation would be overlooked is less than 20%) at a significant level of p < 0.05.
Baseline demographic data, such as age and BMI, were compared according to the presence or absence of radiographic OA of the hand and knee using the Student t-test. Analysis of covariance, adjusting for age and BMI, was performed to compare the BMD according to the presence or absence of radiographic OA of the hand and knee. The adjusted BMD was also compared between those with OA only in the hand, and those with OA only in the knee. Partial correlation analysis was performed to evaluate the relationship between the BMD and the radiographic OA grade of the knee and hand, where age and BMI were adjusted for. A p-value less than 0.05 was considered statistically significant. All statistical analyses were performed using SPSS ver. 18.0 (SPSS Inc., Chicago, IL, USA).
RESULTS
Grade and Prevalence of Radiographic OA
According to the K-L criteria, the OA scores of the hand in the participants were determined at the following frequen- cies: grade 0 in 0.4% (1/266), grade 1 in 39.1% (104/266), grade 2 in 45.9% (122/266), grade 3 in 11.7% (31/266), and grade 4 in 3.0% (8/266). The overall prevalence of radio- graphic hand OA (K-L criteria ≥ 2) was 60.5% (161/266).
It occurred in 56.6% (81/143) of male participants and 65.0% (80/123) of female participants, but the difference was not statistically significant (p = 0.162). OA scores for the knee, according to the K-L criteria, were determined in the following frequencies: grade 0 in 18.8% (30/266), grade 1 in 51.1% (136/266), grade 2 in 9.4% (25/266), grade 3 in 10.9% (29/266), and grade 4 in 9.8% (26/266). The overall prevalence of radiographic knee OA (K-L criteria ≥ 2) was 30.1% (80/266). The prevalence was 18.2% (26/143) in male participants and 43.9% (54/123) in female partici- pants, which represented a statistically significant differ- ence (p < 0.001) (Table 1). Thirty-two percent (85/266) of participants had neither radiographic hand nor knee OA.
Thirty-eight percent (101/266) had radiographic OA only in the hand, and 7.5% (20/266) had radiographic OA only in the knee. The remaining 22.6% (60/266) had radio- graphic OA in both the hand and knee.
Comparison of BMD According to Radiographic OA Status
In male participants, the mean T-score was –0.82 ± 1.01 in those with radiographic hand OA and –0.59 ± 1.06 in those without radiographic hand OA, which had no sig- nificant difference after adjustment for age and BMI (p = 0.717). In female participants, the mean T-score was –1.62
± 0.87 in those with hand OA and –1.58 ± 0.74 in those without OA, also with no significant difference (p = 0.862) (Table 2).
In male participants, the mean T-score was –0.70 ± 1.24 in those with radiographic knee OA and –0.73 ± 0.99 in those without radiographic knee OA, which had no significant difference in the age and BMI adjusted analysis (p = 0.974). In female participants, the mean T-score was –1.53 ± 0.91 in those with knee OA and –1.67 ± 0.77 in those without OA, also with no significant difference (p = 0.563) (Table 2).
In male participants, the mean T-score was –0.86 ±
0.97 in those with radiographic OA only in the hand OA, and –0.63 ± 1.52 in those only in the knee. In female par- ticipants, these values were –1.71 ± 0.76 and –1.48 ± 0.67.
There was no significant difference in the mean T scores between those with OA in only one of the locations (p = 0.920 in male and p = 0.961 in female) (Table 2).
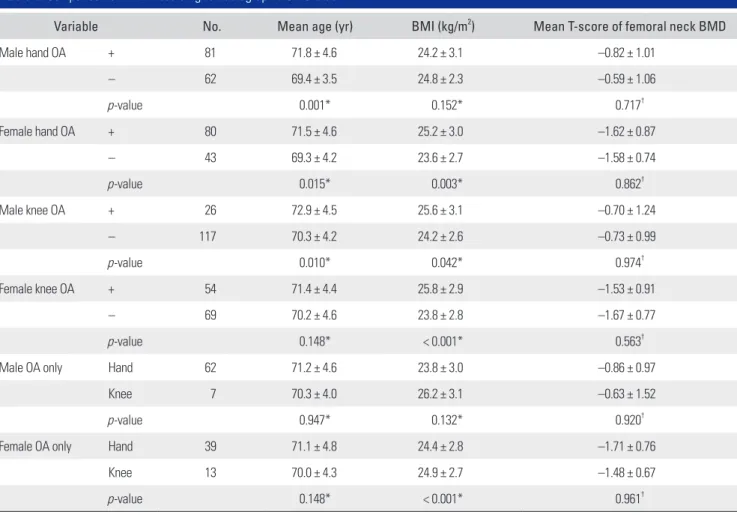
Table 2. Comparison of BMD According to Radiographic OA Status
Variable No. Mean age (yr) BMI (kg/m2) Mean T-score of femoral neck BMD
Male hand OA + 81 71.8 ± 4.6 24.2 ± 3.1 –0.82 ± 1.01
– 62 69.4 ± 3.5 24.8 ± 2.3 –0.59 ± 1.06
p-value 0.001* 0.152* 0.717†
Female hand OA + 80 71.5 ± 4.6 25.2 ± 3.0 –1.62 ± 0.87
– 43 69.3 ± 4.2 23.6 ± 2.7 –1.58 ± 0.74
p-value 0.015* 0.003* 0.862†
Male knee OA + 26 72.9 ± 4.5 25.6 ± 3.1 –0.70 ± 1.24
– 117 70.3 ± 4.2 24.2 ± 2.6 –0.73 ± 0.99
p-value 0.010* 0.042* 0.974†
Female knee OA + 54 71.4 ± 4.4 25.8 ± 2.9 –1.53 ± 0.91
– 69 70.2 ± 4.6 23.8 ± 2.8 –1.67 ± 0.77
p-value 0.148* < 0.001* 0.563†
Male OA only Hand 62 71.2 ± 4.6 23.8 ± 3.0 –0.86 ± 0.97
Knee 7 70.3 ± 4.0 26.2 ± 3.1 –0.63 ± 1.52
p-value 0.947* 0.132* 0.920†
Female OA only Hand 39 71.1 ± 4.8 24.4 ± 2.8 –1.71 ± 0.76
Knee 13 70.0 ± 4.3 24.9 ± 2.7 –1.48 ± 0.67
p-value 0.148* < 0.001* 0.961†
BMD: bone mineral density, OA: osteoarthritis, BMI: body mass index.
*Student t-test. †Analysis of covariance adjusting for age and BMI.
Table 3. Correlation between BMD and Radiographic OA Grade
Radiographic OA grade
BMD
Male (n = 143) Female (n = 123)
r p-value r p-value
Hand –0.113* 0.182* –0.012* 0.897*
Knee 0.098* 0.245* 0.150* 0.098*
BMD: bone mineral density, OA: osteoarthritis.
*Partial correlation analysis adjusting for age and body mass index.
Correlation between BMD and Radiographic OA Grade Radiographic hand OA grades were not found to be cor- related with the T-scores of femoral neck BMD in male participants (r = –0.113, p = 0.182) nor in female partici- pants (r = –0.012, p = 0.897). Furthermore, radiographic knee OA grades were not found to be correlated with the T-scores of femoral neck BMD in male participants (r = 0.098, p = 0.245) nor in female participants (r = 0.150, p = 0.098) (Table 3).
DISCUSSION
In the present study done on a community-dwelling el- derly Korean population, we examined the relationship between BMD and OA in the hand and knee. The results of this study indicated that there is no association between BMD and radiographic OA of the hand and knee.
Our results do not correspond with most of the ear- lier studies on Caucasians, which reported the relationship between osteoporosis and OA. After Foss and Byers1) first reported abnormally high BMD in the forearm of patients with hip OA, this association between high BMD and OA, especially in the hip and knee joints, has been confirmed by several studies.2-5,7,8) Regarding hand OA, there have been several contradictory reports about the relationship between osteoporosis and OA.12-20) For example, a Finnish population based cross-sectional and longitudinal study demonstrated that distal interphalangeal and basal joint OA is directly related with low cortical bone mineral mass, in proportion to the severity of OA.16) Another case-con- trol study indicated that phalangeal BMD is significantly reduced in Caucasian women with hand OA, and is related to radiologic severity.18)
Meanwhile, there have been relatively few studies performed in Asians.14,19,21-23) Moon and Lee23) studied 297 Korean women with knee osteoarthritis and found that hip BMD and radiographic knee OA were negatively cor- related, although the mechanism remains unclear. Another study done on 180 Korean women with hand joint pain and swelling found that the BMD levels of the distal radius were significantly lower in those with hand OA compared to those of controls.19) However, these two studies were done on a hospital-based population.19,23) In a study done in 567 community-dwelling Japanese women, similar to our study population, the authors reported that appen- dicular BMD was not associated with OA of the knee, distal interphalangeal and proximal interphalangeal joints, which is consistent with our findings.14) Although only a few studies are available, we speculate that there may be differences between Asians and Caucasians, and between
hospital-based and community-based populations, which caused the different epidemiologic results.
More than half of the participants in this study were male (53.8%). Many studies have focused primar- ily on women, while relatively few have been performed on men.4,7,13,15,16) One epidemiologic study reported that men with hand OA have a higher BMD, while women with hand OA have lower BMD.13) Another study also suggested that men with hand OA do not lose their BMD, although women with hand OA experience BMD loss over time.15) In our study, we could not find such an association between BMD and OA. However, by including the male participants, we believe this study explored the relation- ship between OA and osteoporosis more comprehensively.
In this study, the T-scores of femoral neck area were used as BMD measurements. The formation of osteo- phytes and subchondral bone remodeling occurring near osteoarthritic joints may alter BMD measured around local bones.24) Spinal BMD measurements were also ex- cluded, because relatively high BMD may be a false mea- sure, caused by the presence of osteophytes, joint space narrowing, and sclerosis in elderly subjects.25,26) Femoral BMD has been known to be much less affected by osteo- phytes, because the regions of interest usually studied are distal to the sites of hip joint OA.25) Moreover, it has been reported that proximal femur BMD measurements consis- tently outperform lumbar spine measurements for global fracture prediction, which is the most concerning factor in the management of osteoporosis.27,28)
The strengths of our study are that we analyzed the association between BMD and OA of both weight bearing and non-weight bearing joints simultaneously, focused on aged people including male participants in a community- based population, and measured femoral neck BMD.
However, several limitations of the present study should be noted. First, although age and BMI were adjusted as covariates, other possible confounding factors were not included due to the lack of information. Hormonal status has been well known as one of the determinants of BMD, especially in elderly women. In addition, degree of physi- cal activity, which might play an important role between osteoporosis and OA, was not adjusted for either. Second, although the sample was large enough for correlation analysis between BMD and radiographic OA grade, analy- sis of covariance for comparison of the BMD according to OA status was under-powered. In comparison of BMD ac- cording to hand OA status in male participants, the mean difference of BMD between two groups was 0.23, and the SDs were 1.01 and 1.06, respectively. As a meaningful dif- ference of mean BMD with a power of 80%, the adequate
sample size would be 638, with 319 subjects in each group.
In conclusion, in our cohort of the general Korean elderly population, we found no association between os- teoporosis and OA, regardless of the weight bearing status of the joints. Further studies with a larger population and more relevant variables are required to further examine
the relationship between osteoporosis and OA.
CONFLICT OF INTEREST
No potential conflict of interest relevant to this article was reported.
REFERENCES
bone mineral density, and osteoporotic fractures in elderly women. Osteoporos Int. 1995;5(5):382-8.
12. Hochberg MC, Lethbridge-Cejku M, Scott WW Jr, Plato CC, Tobin JD. Appendicular bone mass and osteoarthritis of the hands in women: data from the Baltimore Longitudinal Study of Aging. J Rheumatol. 1994;21(8):1532-6.
13. Schneider DL, Barrett-Connor E, Morton DJ, Weisman M.
Bone mineral density and clinical hand osteoarthritis in el- derly men and women: the Rancho Bernardo study. J Rheu- matol. 2002;29(7):1467-72.
14. Yahata Y, Aoyagi K, Yoshida S, et al. Appendicular bone mass and knee and hand osteoarthritis in Japanese wom- en: a cross-sectional study. BMC Musculoskelet Disord.
2002;3:24.
15. Hochberg MC, Lethbridge-Cejku M, Tobin JD. Bone min- eral density and osteoarthritis: data from the Baltimore Lon- gitudinal Study of Aging. Osteoarthritis Cartilage. 2004;12 Suppl A:S45-8.
16. Haara MM, Arokoski JP, Kroger H, et al. Association of radiological hand osteoarthritis with bone mineral mass:
a population study. Rheumatology (Oxford). 2005;44(12):
1549-54.
17. Zoli A, Lizzio MM, Capuano A, Massafra U, Barini A, Fer- raccioli G. Osteoporosis and bone metabolism in postmeno- pausal women with osteoarthritis of the hand. Menopause.
2006;13(3):462-6.
18. El-Sherif HE, Kamal R, Moawyah O. Hand osteoarthritis and bone mineral density in postmenopausal women; clini- cal relevance to hand function, pain and disability. Osteoar- thritis Cartilage. 2008;16(1):12-7.
19. Kim SK, Park SH, Choe JY. Lower bone mineral density of forearm in postmenopausal patients with radiographic hand osteoarthritis. Rheumatol Int. 2010;30(5):605-12.
20. Guler-Yuksel M, Bijsterbosch J, Allaart CF, et al. Acceler- ated metacarpal bone mineral density loss is associated with radiographic progressive hand osteoarthritis. Ann Rheum Dis. 2011;70(9):1625-30.
21. Naitou K, Kushida K, Takahashi M, Ohishi T, Inoue T. Bone 1. Foss MV, Byers PD. Bone density, osteoarthrosis of the hip,
and fracture of the upper end of the femur. Ann Rheum Dis.
1972;31(4):259-64.
2. Roh YS, Dequeker J, Mulier JC. Bone mass in osteoarthrosis, measured in vivo by photon absorption. J Bone Joint Surg Am. 1974;56(3):587-91.
3. Cooper C, Cook PL, Osmond C, Fisher L, Cawley MI.
Osteoarthritis of the hip and osteoporosis of the proximal femur. Ann Rheum Dis. 1991;50(8):540-2.
4. Hannan MT, Anderson JJ, Zhang Y, Levy D, Felson DT.
Bone mineral density and knee osteoarthritis in elderly men and women: the Framingham Study. Arthritis Rheum.
1993;36(12):1671-80.
5. Nevitt MC, Lane NE, Scott JC, et al. Radiographic osteo- arthritis of the hip and bone mineral density: the Study of Osteoporotic Fractures Research Group. Arthritis Rheum.
1995;38(7):907-16.
6. Sowers MF, Hochberg M, Crabbe JP, Muhich A, Crutchfield M, Updike S. Association of bone mineral density and sex hormone levels with osteoarthritis of the hand and knee in premenopausal women. Am J Epidemiol. 1996;143(1):38- 47.
7. Burger H, van Daele PL, Odding E, et al. Association of ra- diographically evident osteoarthritis with higher bone min- eral density and increased bone loss with age: the Rotterdam Study. Arthritis Rheum. 1996;39(1):81-6.
8. Hart DJ, Cronin C, Daniels M, Worthy T, Doyle DV, Spector TD. The relationship of bone density and fracture to inci- dent and progressive radiographic osteoarthritis of the knee:
the Chingford Study. Arthritis Rheum. 2002;46(1):92-9.
9. Radin EL, Paul IL, Rose RM. Role of mechanical fac- tors in pathogenesis of primary osteoarthritis. Lancet.
1972;1(7749):519-22.
10. Amin S. Osteoarthritis and bone mineral density: what is the relation and why does it matter? J Rheumatol. 2002;
29(7):1348-9.
11. Marcelli C, Favier F, Kotzki PO, Ferrazzi V, Picot MC, Si- mon L. The relationship between osteoarthritis of the hands,
mineral density and bone turnover in patients with knee os- teoarthritis compared with generalized osteoarthritis. Calcif Tissue Int. 2000;66(5):325-9.
22. Iwamoto J, Takeda T, Ichimura S. Forearm bone mineral density in postmenopausal women with osteoarthritis of the knee. J Orthop Sci. 2002;7(1):19-25.
23. Moon WN, Lee KS. Correlation between bone mineral den- sity and knee osteoarthritis. J Korean Orthop Assoc. 2002;
37(6):718-22.
24. Antoniades L, MacGregor AJ, Matson M, Spector TD. A cotwin control study of the relationship between hip os- teoarthritis and bone mineral density. Arthritis Rheum.
2000;43(7):1450-5.
25. Knight SM, Ring EF, Bhalla AK. Bone mineral density and osteoarthritis. Ann Rheum Dis. 1992;51(9):1025-6.
26. El Miedany YM, Mehanna AN, El Baddini MA. Altered bone mineral metabolism in patients with osteoarthritis.
Joint Bone Spine. 2000;67(6):521-7.
27. Leslie WD, Tsang JF, Caetano PA, Lix LM; Manitoba Bone Density Program. Effectiveness of bone density measure- ment for predicting osteoporotic fractures in clinical prac- tice. J Clin Endocrinol Metab. 2007;92(1):77-81.
28. Leslie WD, Lix LM, Tsang JF, Caetano PA; Manitoba Bone Density Program. Single-site vs multisite bone density mea- surement for fracture prediction. Arch Intern Med. 2007;
167(15):1641-7.