This is an Open Access article distributed under the terms of the Creative Commons At- tribution Non-Commercial License (http://creativecommons.org/licenses/by-nc/3.0/) which permits unrestricted non-commercial use, distribution, and reproduction in any medium, provided the original work is properly cited.
The Relationship between the Level of Fatness and Fitness during Adolescence and the Risk Factors of Metabolic Disorders in Adulthood
Yoonsuk Jekal1, Ji Eun Yun2, Sang Wook Park1, Sun Ha Jee2, Justin Y Jeon1
1Department of Sport and Leisure Studies, 2Graduate School of Public Health, Yonsei University, Seoul, Korea
Background: The purpose of the current study was to investigate the association between the level of obesity and physical fit- ness (PF) during adolescence and the risk factors of metabolic disorders during adulthood.
Methods: In the current analysis, 3,993 Korean adults (mean age, 38.70 ± 1.69 years) were recruited. The level of body index (BI) and PF were examined during adolescence through high school record, and their health examination data, including systol- ic blood pressure (SBP), diastolic blood pressure (DBP), fasting glucose (FG), total cholesterol (TC), and current body mass in- dex (BMI) were obtained from National Health Insurance Corporation Data. Gender-specific analyses were administered to compare health exam data across the level of BI, the level of PF, and a mixed level of BI and PF.
Results: Most obese males during high school had statistically higher SBP, DBP, FG, and BMI in adulthood, and most obese fe- males had higher BMI, as compared to most lean males or females. Least fit males during high school had statistically higher BMI in adulthood, and least fit females had statistically higher SBP, DBP, FG, TC, and BMI, as compared to most fit males or fe- males. There was a significant relationship between the mixed level of BI and PF and SBP, DBP, TC and current BMI in both gen- ders.
Conclusion: Maintaining a healthy level of body weight and PF during adolescence is recommended to prevent the develop- ment of metabolic diseases in adulthood.
Keywords: Adolescent; Adulthood; Body index; Body mass index; Metabolic disorder; Physical fitness
Corresponding author: Justin Y Jeon
Department of Sport and Leisure Studies, Yonsei University, 134 Shinchon-dong, Seodaemun-gu, Seoul 120-749, Korea E-mail: [email protected]
INTRODUCTION
Recently, a worldwide epidemic of obesity in adulthood as well as childhood is progressing at an alarming rate, and conse- quently, a majority of countries worldwide have made obesity prevention a priority in the area of public health. From the 1960s to 2000s, the number of obese people increased 2.5 times in the US and more than 2 times in Korea. The prevalence of child obesity has also been increasing, similar to adulthood obe- sity [1-4].
Child or teenage obesity can lead to a development of meta-
bolic disorders, including type 2 diabetes, hyperlipidemia, fat- ty liver disease, and atherosclerosis. Previous investigations re- ported that obesity in childhood or adolescence is more likely to have a higher relative risk of metabolic-related disease and cardiovascular disease (CVD), since obese youths show dan- gerous levels of blood pressure (BP), fasting glucose (FG), trig- lycerides (TG), total cholesterol (TC), insulin, insulin resistance, inflammatory markers (tumor necrosis factor-α, interleukin-6, high sensitivity C-reactive protein), intima-media thickness, and CVD risk score, as compared to youth with normal body weight [5-9].
pISSN 1976-9180 · eISSN 2093-2650
Furthermore, youth obesity often continues into adult obe- sity, and can eventually lead to type 2 diabetes, hypertension, CVD, metabolic disorders, and certain cancers [10,11]. Baker et al. [12] determined that the body mass index (BMI) at 7 to 13 years of age was significantly associated with morbidity and mortality of CVD at 25 years of age or older.
Recent studies reported that not only prevention of obesity but also improvement of physical fitness (PF) is important to prevent and treat type 2 diabetes and CVD. Jekal et al. [13] in- vestigated relationship between PF and obesity levels and CVD risk factors using PF test administered at most school in Korea, health exam data, and additional anthropometrics (per- cent body fat), serum analysis in adolescence. They concluded that there were significant relationships between the level of PF, percent body fat, insulin resistance, TG and metabolic disease risk factors. Longitudinal analysis by Blair et al. [14] reported that decreased level of cardio-respiratory fitness (CRF) yielded increased mortality of CVD as well as all causes.
Latest studies demonstrated that a mixed level of PF and obesity was significantly associated with CVD, type 2 diabetes and metabolic syndrome. Eisenmann et al. [15] examined a mixed effect of cardio-respiratory fitness (CRF) and obesity (CRF X obesity) on risk factors of CVD with 1,615 US adoles- cents aged 9 to 15 years. Study population was classified into 4 groups by level of CRF and obesity (high fat and low fit; high fat and high fit; low fat and low fit; low fat and high fit), and mean values of CVD risk factors between 4 groups. The result of this study there were significant differences in the values of BP, TG, high density lipoprotein cholesterol (HDL-C) and low density lipoprotein cholesterol (LDL-C) between groups. Jekal et al.
[8] demonstrated that out of obese adolescents, those with higher levels of CRF had decreased CVD risk score compared to counterparts in lower levels of CRF. They also found among normal weight adolescents, those with lower fitness levels had increased CVD risk score compared to those with higher fit- ness level.
Numerous studies have been administered to determine the relationship between youth obesity and the incidence rate of adult obesity and the prevalence of chronic disease; however there is little evidence to determine a relationship between a mixed level of PF and obesity in adolescence and the level of obesity and risk factors of metabolic disorders in adulthood, especially in the Korean population. The purpose of the cur- rent investigation was to examine the relationship between a mixed level of PF and obesity during adolescence and obesity and risk factors of metabolic disorders in adulthood.
METHODS
Study population
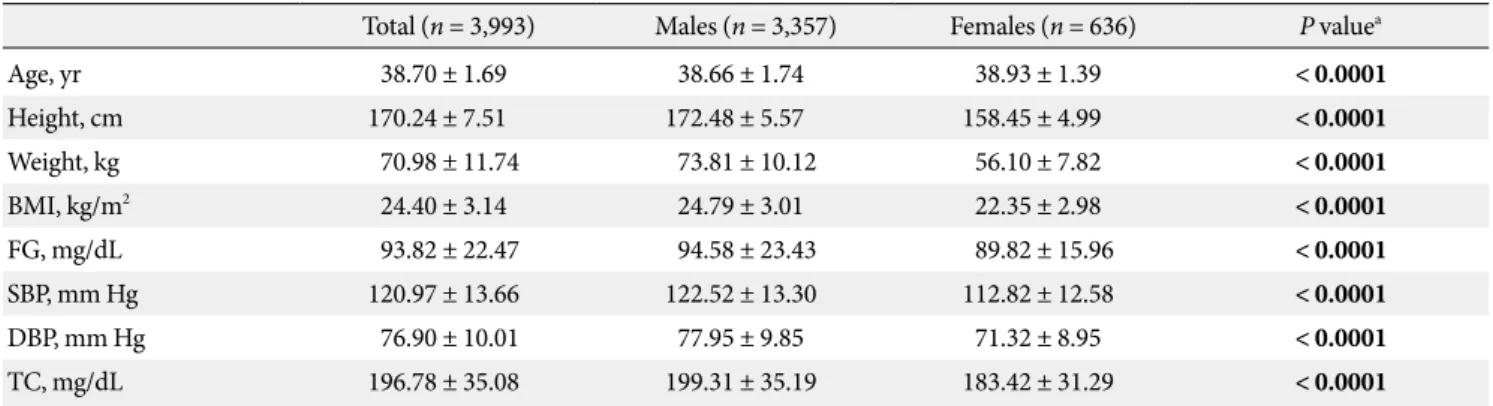
In the current study, 15,896 young adults who graduated from 1 of the 10 high schools (5 male schools) located in the city of Seoul or Gyeong-Gi Province were recruited. Out of the total population, only 3,993 young adults who had PF test results and a health exam while in the 11th grade, and participated in the primary national health exam during adulthood were in- cluded in the analysis. The current study was approved by the Korean Department of Health and Human Services and Na- tional Health Insurance Corporation. The characteristics of study population are presented in (Table 1).
Table 1. Participants characteristics
Total (n = 3,993) Males (n = 3,357) Females (n = 636) P valuea
Age, yr 38.70 ± 1.69 38.66 ± 1.74 38.93 ± 1.39 < 0.0001
Height, cm 170.24 ± 7.51 172.48 ± 5.57 158.45 ± 4.99 < 0.0001
Weight, kg 70.98 ± 11.74 73.81 ± 10.12 56.10 ± 7.82 < 0.0001
BMI, kg/m2 24.40 ± 3.14 24.79 ± 3.01 22.35 ± 2.98 < 0.0001
FG, mg/dL 93.82 ± 22.47 94.58 ± 23.43 89.82 ± 15.96 < 0.0001
SBP, mm Hg 120.97 ± 13.66 122.52 ± 13.30 112.82 ± 12.58 < 0.0001
DBP, mm Hg 76.90 ± 10.01 77.95 ± 9.85 71.32 ± 8.95 < 0.0001
TC, mg/dL 196.78 ± 35.08 199.31 ± 35.19 183.42 ± 31.29 < 0.0001
Data presented as the mean ± standard deviation.
BMI, body mass index; FG, fasting glucose; SBP, systolic blood pressure; DBP, diastolic blood pressure; TC, total cholesterol.
aComparison between genders.
Data collection
Data of PF level and obesity during adolescence were evaluat- ed in current study participants. The body index (BI) was con- sidered as the level of obesity during adolescence, and the equa- tion for the calculation is shown below:
BI = body weight/(height)3 x 10000
The value of BI calculated was classified into 5 groups (1st- 5th), with the 1st group defined as the most lean body weight and the 5th group defined as the most fat body weight.
The PF test during high school utilized the 100 m sprint for agility, 1,600 m long-distance run for cardio-respiratory en- durance, sit-ups, chin-ups and push-ups for muscular endur- ance, the standing jump for muscular strength, and sit-and- reach for flexibility assessment. Each test result was converted to a score, and the individual PF test score was summed. The total PF score was classified into 1 of 6 groups (0-5 fitness grades), with 0 grade defined as the most fit and 5th grade defined as the least fit.
The National Health Insurance Corporation was asked to provide the 1st health examination data, including FG, systolic blood pressure (SBP), diastolic blood pressure (DBP), TC, and current BMI.
Statistical analysis
SAS 9.1 version program (SAS Institute Inc., Cary, NC, USA) was employed to perform gender-specific analysis. Using one way-ANOVA, the mean values of BMI and risk factors of met- abolic disorder in adulthood were compared by the level of obesity (5 groups) and the level of PF (3 groups) in adoles- cence. Across the mixed level of obesity and PF (high fat and low fit; high fat and high fit; low fat and low fit; low fat and high fit), the mean values of BMI and risk factors of metabolic disor- der in adulthood were compared. Logistic Regression analysis was utilized to determine relative risk (95% confidence interval [CI]) of abnormal values for each risk factor and relative risk of being obese (BMI ≥ 25 kg/m2) in adulthood across the levels of obesity (5 groups), PF (3 groups) and a levels of obesity and PF combined (4 groups). Statistical significance was set at P <
0.05.
RESULTS
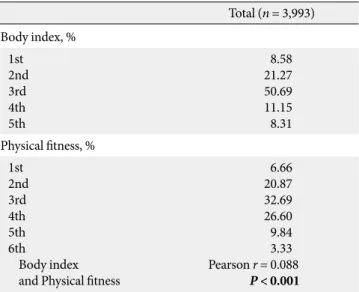
Table 2 shows the distribution of BI and PF, the correlation be-
tween the level of obesity and the level of PF while in high school and the Pearson correlation r value of 0.088 (P < 0.001) Table 3 shows the effects of fatness levels during adoles- cence on metabolic disease risk factors during adulthood. In males, there were significant differences in the value of FG, SBP, DBP, and BMI in adulthood across the level of BI in ado- lescence. Males in the most fat group had higher values of FG and BMI than those in the other 4 groups, and males in the most fat group had higher values of SBP and DBP than those in the 1st to 3rd groups.
Among females, there was a significant difference in adult- hood BMI across BI levels during adolescent. However, there was no relationship between the level of obesity while in high school and the value of FG, SBP, DBP, and TC in adulthood.
Table 4 presents the relative risks of the abnormality in BP (SBP ≥ 130 mm Hg or DBP ≥ 85 mm Hg), FG (≥ 100 mg/dL), TC (≥200 mg/dL), and BMI (≥25 kg/m2) in adulthood. Males in the most fat group were more likely to have an abnormal val- ue in FG (2.3 times), BP (1.9 times), TC (1.4 times), and BMI (19.0 times) in adulthood, as compared to males in the most lean group. Female in the most fat group were 18.7 times more likely to have abnormal values in BMI in adulthood, as com- pared to females in the most least group; however, there were no significant results in FG, BP, or TC.
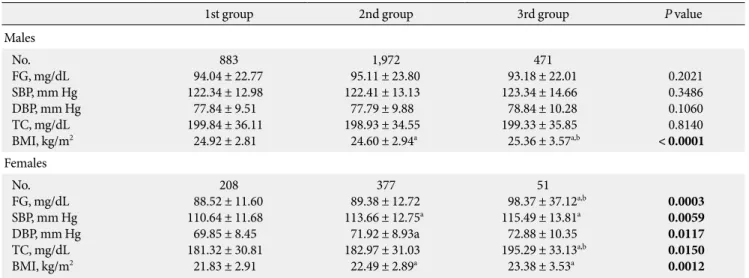
Table 5 reports the results of the comparison of the mean val- ues of metabolic disease risk factors and BMI in adolescence across the PF levels in adulthood. Males in the lowest level of PF during high school had higher BMI in adulthood than counter- Table 2. Prevalence of the level of obesity and physical fitness at adolescence
Total (n = 3,993) Body index, %
1st 2nd 3rd 4th 5th
8.58 21.27 50.69 11.15 8.31 Physical fitness, %
1st 2nd 3rd 4th 5th 6th
Body index and Physical fitness
6.66 20.87 32.69 26.60 9.84 3.33 Pearson r = 0.088
P < 0.001
parts in the other 2 groups (most fit and moderately fit). In ad- dition, females in the least fit during adolescence had higher FG and TC in adulthood than counterparts in the most fit and moderately fit participants and had higher SBP and BMI in adulthood than the most fit participants.
Table 6 presents the results of the comparison of the relative risks of abnormal values in the adulthood risk factors accord- ing to the level PF while in high school. Males in the lowest fit
group during adolescence were 1.3 times more likely to be obese in adulthood, as compared to counterparts in the most fit group; however, there were no significant results for FG, BP, and TC. Females in the least fit level were more likely to have abnormal values in the FG (3.1 times) and BMI (2.4 times) in adulthood, as compared to females in the most fit level group, however, there were no differences in BP and TC.
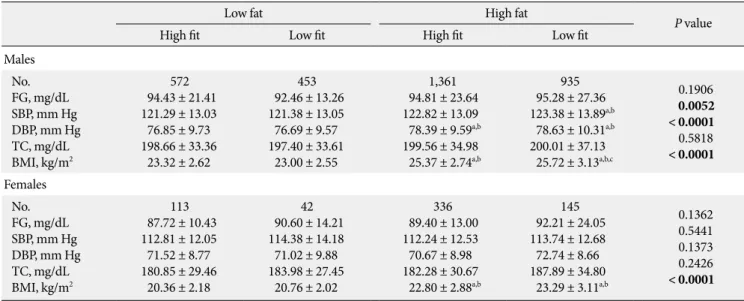
Table 7 shows comparisons of the value of metabolic disor- Table 4. Relative risk for the high level of blood pressure, glucose, total cholesterol and being obese in adulthood across the level of body index during adolescence
1st group 2nd group 3rd group 4th group 5th group
Males No.
FG (≥ 110)
BP (SBP ≥ 130 or DBP ≥ 85) TC (≥ 200)
BMI (≥ 25)
1.00288 1.001.00 1.00
1.01 (0.62 to 1.63)743 0.94 (0.70 to 1.26) 1.38 (1.04 to 1.84) 1.16 (0.83 to 1.61)
1,722 1.04 (0.67 to 1.62) 1.14 (0.87 to 1.49) 1.39 (1.07 to 1.81) 2.95 (2.19 to 3.99)
1.29 (0.76 to 2.17)339 1.56 (1.28 to 2.15) 1.32 (0.96 to 1.82) 8.96 (6.23 to 12.88)
2.26 (1.35 to 3.79)245 1.91 (1.35 to 2.70) 1.44 (1.02 to 2.02) 18.96 (12.25 to 29.36) Females
No.
FG (≥ 110)
BP (SBP ≥ 130 or DBP ≥ 85) TC (≥ 200)
BMI (≥ 25)
1.0053 1.001.00 1.00
0.95 (0.23 to 3.93)102 0.76 (0.31 to 1.86) 0.86 (0.43 to 1.74) 2.22 (0.46 to 10.65)
1.26 (0.36 to 4.41)292 0.71 (0.32 to 1.57) 0.80 (0.43 to 1.50) 4.78 (1.12 to 20.31)
0.38 (0.06 to 2.34)104 0.90 (0.36 to 2.24) 1.07 (0.52 to 2.20) 12.58 (2.87 to 55.16)
1.98 (0.50 to 7.85)85 1.76 (0.73 to 4.26) 1.30 (0.62 to 2.71) 18.65 (4.23 to 82.35) Data presented as the relative risk (95% confidence interval).
1st group, most lean; 5th group, most fat.
FG, fasting glucose BP, blood pressure; SBP, systolic blood pressure; DBP, diastolic blood pressure; TC, total cholesterol; BMI, body mass index.
Table 3. Metabolic parameters in adulthood across the level of body index during adolescence
1st group 2nd group 3rd group 4th group 5th group P value
Males No.
FG, mg/dL SBP, mm Hg DBP, mm Hg TC, mg/dL BMI, kg/m2
94.28 ± 22.04288 121.87 ± 13.46 76.82 ± 9.43 200.30 ± 36.43
22.74 ± 2.62
93.25 ± 16.56743 121.15 ± 12.83 76.75 ± 9.73 197.27 ± 32.11
23.35 ± 2.55a
1,722 94.25 ± 22.58 122.25 ± 12.91b
78.04 ± 9.67 199.51 ± 35.92 24.91 ± 2.62a,b
94.44 ± 19.82339 124.88 ± 14.44a,b 79.17 ± 9.90a,b,c 198.96 ± 35.39 26.84 ± 2.81a,b,c
101.79 ± 44.02245 a,b,c,d 126.09 ± 14.86a,b,c
80.84 ± 11.19a,b,c 202.67 ± 37.20
27.94 ± 3.14a,b,c,d
< 0.0001
< 0.0001
< 0.0001 0.2830
< 0.0001 Females
No.
FG, mg/dL SBP, mm Hg DBP, mm Hg TC, mg/dL BMI, kg/m2
89.30 ± 12.5753 111.49 ± 11.92 70.49 ± 7.46 186.58 ± 28.03
19.81 ± 2.24
88.08 ± 11.10102 114.15 ± 12.95 71.85 ± 9.78 179.16 ± 29.11
20.82 ± 2.01
90.26 ± 13.06292 112.16 ± 11.84 70.97 ± 8.31 184.78 ± 30.82 22.41 ± 2.78a,b
87.43 ± 11.01104 111.83 ± 12.65 70.79 ± 8.77 181.63 ± 31.31 23.19 ± 2.75a,b
93.64 ± 30.2385 115.55 ± 14.55 73.01 ± 10.86 184.06 ± 36.93
24.53 ± 3.23a,b,c,d
0.0692 0.1262 0.3243 0.5001
< 0.0001 Data presented as the mean ± standard deviation.
1st group, most lean; 5th group, most fat.
FG, fasting glucose; SBP, systolic blood pressure; DBP, diastolic blood pressure; TC, total cholesterol; BMI, body mass index.
a Significantly different from 1st group, b Significantly different from 2nd group, c Significantly different from 3rd group, d Significantly different from 4th group.
Table 5. Metabolic parameters in adulthood across the level of physical fitness during adolescence
1st group 2nd group 3rd group P value
Males No.
FG, mg/dL SBP, mm Hg DBP, mm Hg TC, mg/dL BMI, kg/m2
94.04 ± 22.77883 122.34 ± 12.98 77.84 ± 9.51 199.84 ± 36.11
24.92 ± 2.81
1,972 95.11 ± 23.80 122.41 ± 13.13 77.79 ± 9.88 198.93 ± 34.55
24.60 ± 2.94a
93.18 ± 22.01471 123.34 ± 14.66 78.84 ± 10.28 199.33 ± 35.85 25.36 ± 3.57a,b
0.2021 0.3486 0.1060 0.8140
< 0.0001 Females
No.
FG, mg/dL SBP, mm Hg DBP, mm Hg TC, mg/dL BMI, kg/m2
88.52 ± 11.60208 110.64 ± 11.68 69.85 ± 8.45 181.32 ± 30.81
21.83 ± 2.91
89.38 ± 12.72377 113.66 ± 12.75a
71.92 ± 8.93a 182.97 ± 31.03 22.49 ± 2.89a
98.37 ± 37.1251 a,b 115.49 ± 13.81a
72.88 ± 10.35 195.29 ± 33.13a,b
23.38 ± 3.53a
0.0003 0.0059 0.0117 0.0150 0.0012 Data presented as the mean ± standard deviation.
1st group, most fit; 3rd group, least fit.
FG, fasting glucose; SBP, systolic blood pressure; DBP, diastolic blood pressure; TC, total cholesterol; BMI, body mass index.
a Significantly different from 1st group, b Significantly different from 2nd group.
Table 6. Relative risk for the high level of blood pressure, glu- cose, total cholesterol and being obese in adulthood across the level of physical fitness during adolescence
1st group 2nd group 3rd group
Males No.
FG (≥ 110) BP (SBP ≥ 130 or DBP ≥ 85) TC (≥ 200) BMI (≥ 25)
1.00883
1.00 1.001.00
1,972 1.02 (0.78 to 1.32) 1.03 (0.87 to 1.21) 0.93 (0.80 to 1.10) 0.87 (0.74 to 1.02)
0.76 (0.51 to 1.12)471
1.15 (0.92 to 1.45) 0.91 (0.73 to 1.14) 1.30 (1.04 to 1.63) Females
No.
FG (≥ 110) BP (SBP ≥ 130 or DBP ≥ 85) TC (≥ 200) BMI (≥ 25)
1.00208
1.00 1.001.00
1.69 (0.74 to 3.89)377
1.52 (0.89 to 2.58) 1.01 (0.69 to 1.49) 1.27 (0.79 to 2.05)
3.11 (1.00 to 9.65)51
2.09 (0.92 to 4.72) 1.46 (0.76 to 2.83) 2.36 (1.15 to 4.86) Data presented as the relative risk (95% confidence interval).
1st group, most fit; 3rd group, least fit.
FG, fasting glucose; BP, blood pressure; SBP, systolic blood pressure; DBP, diastolic blood pressure; TC, total cholesterol; BMI, body mass index.
der risk factors and BMI in adulthood across the combined levels of obesity and PF (high fat and low fit; high fat and high fit; low fat and low fit; low fat and high fit) in adolescence.
Males in the high fat and low fit group had higher values of SBP than males in the low fat and high fit or low fat and low fit group. In addition, males in the high fat and low fit or high fat
and high fit groups had higher DBP values than males in the low fat and high fit or low fat and low fit group. Males in the high fat and low fit group had higher BMI than those in the other 3 groups, and males in the high fat and high fit group had higher BMI than those in the low fat and high fit or low fat and low fit group. However, there were no significant differences in the value of FG and TC in adulthood across the mixed level of obesity and PF in adolescence.
Females in the high fat and low fit or high fat and high fit group during adolescence had higher BMI in adulthood than females in the low fat and high fit or low fat and low fit group;
however, there were no significant differences in the values of FG, SBP, DBP, and TC across the mixed level of obesity and PF.
Fig. 1 shows the relative risks of abnormality in adulthood risk factors across a mixed level of obesity and PF in adoles- cence. Males in the high fat and low fit group while in high school were more likely to have an abnormal value of BP (1.6 times; 95% CI, 1.24 to 1.98) and BMI (4.1 times; 95% CI, 3.18 to 5.18) in adulthood, as compared to those in the low fat and high fit group, and male in the high fat and high fit group were more likely to have an abnormal value of BP (1.3 times; 95%
CI, 1.08 to 1.54), TC (1.2 times; 95% CI, 1.02 to 1.44) and BMI (3.8 times; 95% CI, 3.13 to 4.57) in adulthood, as compared to males in the low fat and high fit group.
Females in the high fat and low fit group during adolescence were more likely to have an abnormal value of BP (2.0 times;
95% CI, 1.01 to 4.05), TC (2.0 times; 95% CI, 1.15 to 3.50) and BMI (7.9 times; 95% CI, 3.20 to 19.37), and females in the high fat and high fit group during high school were more likely to be obese (5.5 times; 95% CI, 2.32 to 12.97), and those in the low fat and low fit group were more likely to have an abnormal val- ue of BP (2.5 times; 95% CI, 1.01 to 6.12) and TC (4.6 times;
95% CI, 2.18 to 9.53), as compared to females in the low fat and high fit group in adolescence.
DISCUSSION
Over the last decades, the obese population in the world has been increasing dramatically. The US obese population had in- creased more than 2.5 times from 12.8% in the early 1960s to 32.2% in the early 2000s [1,2]. Interestingly, in 2003-2004, the prevalence of overweight or obese (BMI ≥ 25 kg/m2) among African American female adults was 81.6% [1,2]. As in the US, the prevalence of Korean obesity has dramatically increased, Table 7. Metabolic parameters in adulthood across the level of mixed physical fitness and body index during adolescence
Low fat High fat
High fit Low fit High fit Low fit P value
Males No.
FG, mg/dL SBP, mm Hg DBP, mm Hg TC, mg/dL BMI, kg/m2
94.43 ± 21.41572 121.29 ± 13.03 76.85 ± 9.73 198.66 ± 33.36
23.32 ± 2.62
92.46 ± 13.26453 121.38 ± 13.05 76.69 ± 9.57 197.40 ± 33.61
23.00 ± 2.55
1,361 94.81 ± 23.64 122.82 ± 13.09 78.39 ± 9.59a,b 199.56 ± 34.98
25.37 ± 2.74a,b
95.28 ± 27.36935 123.38 ± 13.89a,b
78.63 ± 10.31a,b 200.01 ± 37.13 25.72 ± 3.13a,b,c
0.1906 0.0052
< 0.0001 0.5818
< 0.0001 Females
No.
FG, mg/dL SBP, mm Hg DBP, mm Hg TC, mg/dL BMI, kg/m2
87.72 ± 10.43113 112.81 ± 12.05 71.52 ± 8.77 180.85 ± 29.46
20.36 ± 2.18
90.60 ± 14.2142 114.38 ± 14.18 71.02 ± 9.88 183.98 ± 27.45
20.76 ± 2.02
89.40 ± 13.00336 112.24 ± 12.53 70.67 ± 8.98 182.28 ± 30.67
22.80 ± 2.88a,b
92.21 ± 24.05145 113.74 ± 12.68 72.74 ± 8.66 187.89 ± 34.80
23.29 ± 3.11a,b
0.1362 0.5441 0.1373 0.2426
< 0.0001 Data presented as the mean ± standard deviation.
FG, fasting glucose; SBP, systolic blood pressure; DBP, diastolic blood pressure; TC, total cholesterol; BMI, body mass index.
a Significantly different from low fat and high fit, b Significantly different from low fat and low fit, c Significantly different from high fat and high fit.
Fig. 1. Relative risk for the high level of risk factors of metabolic disorder in adulthood across the level of mixed physical fitness and body index during adolescence. (A) Males, (B) Females. FG (≥110 mg/dL), fasting glucose; BP (SBP ≥ 130 mm Hg or DBP ≥ 85 mm Hg), blood pressure; TC (≥ 200 mg/dL), total cholesterol; BMI (≥ 25), body mass index.
5 4 3 2 1 0
FG BP TC BMI
High fit Low fit High fit Low fit Low fat High fat
10 8 6 4 2 0
FG BP TC BMI
High fit Low fit High fit Low fit Low fat High fat
A B
and the National Health and Nutrition Survey reported that the number of obese people had increased more than 2 times from 13.9% in 1995 to 30.6% in 2001 [3].
Furthermore, the child and adolescent obesity has also pro- gressively increased. In the US, the prevalence of children and adolescents at risk of being overweight or obese increased from 13.9% in 1999-2000 to 17.1% in 2003-2004, and in Ko- rea, the prevalence of adolescents at risk of being overweight or obese increased from 12.0% in 1997 to 19.0% in 2005 [1,4].
The current study identified the relationship between the level of obesity and fitness during adolescence and the risk fac- tors of metabolic disorders and the level of BMI in 40s adult- hood. This study suggests a strong relationship between the level of obesity while in high school and the level of obesity in adulthood. In both genders, a higher level of BI in adolescence was associated with a higher level of BMI in adulthood. In males, BMI among study participants in the 2nd or 3rd levels of BI (the leaner level group) while in high school was 23 to 25 kg/m2, but BMI among those in the 4th or 5th levels (the high- er fat levels) of BI while in high school was 25 kg/m2 or higher.
The prevalence in females was similar to males, and females in the 4th or 5th level were overweight or obese in adulthood.
The results of previous studies were in agreement with the cur- rent finding in the association between the level of youth obe- sity and the level of adult obesity. Freedman et al. [16] deter- mined the correlation coefficient between the obesity level in childhood or adolescence and the obesity level in adulthood was 0.64 in males, and 0.58 in females.
In a previous study comparing the obesity level during child- hood, the level while in high school (similar to current partici- pants) was significantly correlated with the level at adulthood.
The study examined the association between the obesity level at 7, 11, and 16 years of age, and the obesity level at 33 years or age, (young adulthood) [17]. The study identified that 79.6%
of males and 70.5% of females among people who were over- weight (upper 95th percentile) at 7 years of age remained over- weight or obese at 33 years of age, while 93.1% of males and 89.2% of females among people who were overweight or obese at 16 years of age became overweight or obese at 33 years old.
Furthermore, Guo et al. [18] demonstrated that people who were overweight or obese while in elementary school were 4.6 to 7.9 times more likely to become overweight or obese in adult- hood, whereas people who were overweight or obese while in high school were 57.8 times more likely to become overweight or obese in adulthood.
There were significant associations between the level of ad- olescent obesity and the level of FG, BP, and TC. Freedman et al. [16] showed that, compared to people who were normal or lean in childhood, people who were overweight or obese were more likely to have higher values of TC, TG, LDL-C, SBP and DBP, and a lower value of HDL-C. Wright et al. [19] also found that the level of obesity at 9 years of age was significantly asso- ciated with the level of fat or glucose metabolism in adult- hood.
The associations between the level of youth obesity and the level of adulthood risk factors of metabolic disease were ob- served as different according to gender; a significant associa- tion existed in males but not in females. In the present study and other studies, since the probability of being obese from adolescence to adulthood was relatively higher in males com- pared to females, the probability of abnormal values in adult- hood risk factors of metabolic disease was increased in males [17,18]. In addition, at 40 years of age, the prevalence of obesi- ty was relatively higher in males and; therefore, adulthood obesity independently and directly influences the abnormality of metabolic disorder risk factors. In conclusion, due to the sig- nificant probability of obesity in childhood continuing into adulthood, the higher prevalence of adulthood obesity in males, and the prevalence of obesity and the mean values of FG, BP, and TC being significantly higher in males, as shown in (Table 1), maintaining a healthy body weight in childhood, as well as in adolescence, is important, especially among males.
The current study identified that PF promotion also plays a significant role in preventing obesity and abnormality in risk factors of metabolic disorders in adulthood, as well. The in- creased level of PF while in high school was associated with the decreased level of BMI in adulthood in both genders. In particular, people in the 4th or 5th group of PF level had a mean BMI value of 25 or higher (obese) in males and 23 or higher (overweight) in females in adulthood. There was no statistically significant association in males, but the decreased level of PF in adolescence was significantly associated with ab- normal values of FG, BP, and TC. Kvaavik et al. [20] in the Oslo Youth Study, found that the level of PF at 13 years of age was negatively related to the level of obesity in the 40s, and Carnethon et al. [21] in the longitudinal investigation with PF and chronic disease, determined that those in the low range of PF were more likely to be diagnosed with hypertension (2.2 times), type 2 diabetes (1.8 times) and metabolic syndrome (1.9 times), as compared to people in the high level of PF. The
findings established that not only maintaining healthy body weight but also increasing PF levels while in school is recom- mended to prevent obesity and metabolic disorders in adult- hood. For females, high school is often the last opportunity to participate in physical activity and promote PF, while most males are able to go into the mandatory military service and have another opportunity to increase PF levels. The current finding reported that a more significant association between the level of high school PF and the level of obesity and risk fac- tors in adulthood existed among females, as compared to males, and this finding supports our recommendation to increase PF levels during childhood and adolescence, especially for fe- males.
Additional investigation demonstrated an association be- tween the level of PF while in high school and height in adult- hood. The mean value of adulthood height in males was 173.2 cm and 159.4 cm in females for people in the 1st level of PF, 172.4 cm in males and 158.1 cm in females for people in the 2nd to 3rd level of PF, and 171.7 cm in males and 157.1 cm in females for people in the 4th to 5th level of PF. The increased level of PF in adolescence was significantly related to the in- creased value of adulthood height (respectively, P < 0.001, P = 0.001). Currently, many Koreans are interested in physical de- velopment programs or growth exercise programs to increase height in adulthood, and the findings from the present study suggest a positive correlation for healthy physical growth and development by increasing PF level.
In analysis of the mixed effect of obesity and PF in adoles- cence on the level of obesity in adulthood, the level of adoles- cence obesity is a significant predictor of adulthood obesity other than PF level in adolescence. People in both genders in the high fat group while in high school were more likely to be obese (males 4.1 times; females 7.9 times), irrespective of the PF level while in high school, as compared to those in the lean group. Other analysis in the current study demonstrated that the level of obesity, as well as the level of PF while in high school, was independently associated with the level of obesity in adulthood. However, the comparison between the 2 predic- tors identified that the obesity level is a more important predic- tor of the adulthood obesity level, independent of the fitness level. The current finding is not similar to a previous study by Lee et al. [22]. In Lee’s study, people in the low fat and low fit group were more likely to increase mortality rate by CVD or all-causes, as compared to those in the high fat and high fit group. Lee’s and the current study examined the long-term as-
sociation between the mixed level of obesity and PF and mor- tality or risk factors related to metabolic disease. However, Lee analyzed only CRF as the PF, and the current analysis exam- ined total fitness score, including cardio-respiratory, muscular strength, endurance and flexibility. Additionally, Lee utilized percent body fat, and the current study used the BI from 1980 to 1990 in Korea. Similar to the current finding, Jekal et al. [8]
in the cross-sectional study investigating the association of the obesity level and PF into the CVD risk score calculated with BP, insulin resistance, HDL-C, waist circumference and TG among high school students, identified that independent of the level of PF, an increased BMI was significantly associated with an increased CVD risk score.
There were gender-differences in the findings, and in females, there was a greater association between the PF level in adoles- cence and risk factors in adulthood. In both genders there was no significant association with FG, however, there were signifi- cant associations between BP and TC in adulthood, and the obesity level while in high school for males and significant as- sociations between BP and TC and the PF level while in high school for females. The different gender findings were due to the long-term opportunity while in their early 20s for males only to improve their PF through military service.
Due to the low participation rate of the national health ex- amination, only 25% (almost 4,000 people) among the total population (almost 16,000 people) data were included in the final analysis. The limitation of the current study was using to- tal PF scores kept for high school graduates other than individ- ual values of the PF test such as 100 m sprint, sit-ups or 1,600 m long-distance run, and BI kept for high school graduates other than BMI. Other limitations of the current study were the ab- sence of health behavior data, such as smoking, drinking and socio-economic status data in adulthood, which could be a mediator of adulthood health status [23]. In addition, the cur- rent study was not an actual longitudinal investigation.
However, the current study was the first investigation exam- ining the association between the level of obesity and PF in adolescence and the obesity level and risk factors in adulthood (40-year age group) in the Korean population. The current in- vestigation suggests that maintaining a healthy body weight, as well as increasing PF levels during school, play significant roles in preventing obesity or abnormalities in metabolic dis- ease risk factors in adulthood in Korea.
ACKNOWLEDGEMENT
This study was supported by the National Research Founda- tion of Korea Postdoctoral followship Grant funded by the Korean Government (NRF-2009-351-G00138), Korea Science and Engineering Founda-tion (KOSEF) grant funded by the Korean government (MOST) (No. 2009-0073910), and the Seoul City R & BD program (grant no. 10526).
REFERENCES
1. Ogden CL, Carroll MD, Curtin LR, McDowell MA, Tabak CJ, Flegal KM. Prevalence of overweight and obesity in the United States, 1999-2004. JAMA 2006;295:1549-55.
2. Flegal KM, Carroll MD, Kuczmarski RJ, Johnson CL. Over- weight and obesity in the United States: prevalence and trends, 1960-1994. Int J Obes Relat Metab Disord 1998;22:39-47.
3. Kim DM, Ahn CW, Nam SY. Prevalence of obesity in Korea.
Obes Rev 2005;6:117-21.
4. Oh K, Jang MJ, Lee NY, Moon JS, Lee CG, Yoo MH, Kim YT.
Prevalence and trends in obesity among Korean children and adolescents in 1997 and 2005. Korean J Pediatr 2008;51:950-5.
5. Lee MK, Jekal YS, Kim ES, Lee SH, Jeon JY. BMI, muscular en- durance, and cardiovascular disease risk factors in overweight and obese children. Korean J Phys Educ 2009;48:535-43.
6. Yom HW, Shin JS, Lee HJ, Park SE, Jo SJ, Seo JW. The metabol- ic syndrome in obese children. Korean J Pediatr Gastroenterol Nutr 2004;7:228-38.
7. Kim ES, Im JA, Kim KC, Park JH, Suh SH, Kang ES, Kim SH, Jekal Y, Lee CW, Yoon YJ, Lee HC, Jeon JY. Improved insulin sensitivity and adiponectin level after exercise training in obese Korean youth. Obesity (Silver Spring) 2007;15:3023-30.
8. Jekal Y, Kim ES, Im JA, Park JH, Lee MK, Lee SH, Suh SH, Chu SH, Kang ES, Lee HC, Jeon JY. Interaction between fatness and fitness on CVD risk factors in Asian youth. Int J Sports Med 2009;30:733-40.
9. Sung EJ, Shin TS. The effect of overweight to cardiovascular risk factors among Korean adolescents. J Korean Acad Fam Med 2003;24:1017-25.
10. Singh AS, Mulder C, Twisk JW, van Mechelen W, Chinapaw MJ. Tracking of childhood overweight into adulthood: a sys- tematic review of the literature. Obes Rev 2008;9:474-88.
11. Dietz WH. Childhood weight affects adult morbidity and mortality. J Nutr 1998;128:411S-4S.
12. Baker JL, Olsen LW, Sørensen TI. Childhood body-mass index and the risk of coronary heart disease in adulthood. N Engl J Med 2007;357:2329-37.
13. Jekal YS, Kim ES, Park JH, Jeon JY, Im JA. The relationship be- tween fitness and insulin resistance and cardiovascular risk factors in Korean male adolescents. Korean J Phys Educ 2008;
47:485-93.
14. Blair SN, Kohl HW 3rd, Barlow CE, Paffenbarger RS Jr, Gib- bons LW, Macera CA. Changes in physical fitness and all-cause mortality: a prospective study of healthy and unhealthy men.
JAMA 1995;273:1093-8.
15. Eisenmann JC, Welk GJ, Ihmels M, Dollman J. Fatness, fitness, and cardiovascular disease risk factors in children and adoles- cents. Med Sci Sports Exerc 2007;39:1251-6.
16. Freedman DS, Khan LK, Dietz WH, Srinivasan SR, Berenson GS. Relationship of childhood obesity to coronary heart dis- ease risk factors in adulthood: the Bogalusa Heart Study. Pedi- atrics 2001;108:712-8.
17. Power C, Lake JK, Cole TJ. Body mass index and height from childhood to adulthood in the 1958 British born cohort. Am J Clin Nutr 1997;66:1094-101.
18. Guo SS, Roche AF, Chumlea WC, Gardner JD, Siervogel RM.
The predictive value of childhood body mass index values for overweight at age 35 y. Am J Clin Nutr 1994;59:810-9.
19. Wright CM, Parker L, Lamont D, Craft AW. Implications of childhood obesity for adult health: findings from thousand families cohort study. BMJ 2001;323:1280-4.
20. Kvaavik E, Klepp KI, Tell GS, Meyer HE, Batty GD. Physical fitness and physical activity at age 13 years as predictors of car- diovascular disease risk factors at ages 15, 25, 33, and 40 years:
extended follow-up of the Oslo Youth Study. Pediatrics 2009;
123:e80-6.
21. Carnethon MR, Gidding SS, Nehgme R, Sidney S, Jacobs DR Jr, Liu K. Cardiorespiratory fitness in young adulthood and the development of cardiovascular disease risk factors. JAMA 2003;290:3092-100.
22. Lee CD, Blair SN, Jackson AS. Cardiorespiratory fitness, body composition, and all-cause and cardiovascular disease mortal- ity in men. Am J Clin Nutr 1999;69:373-80.
23. Lee WY, Jung CH, Park JS, Rhee EJ, Kim SW. Effects of smok- ing, alcohol, exercise, education, and family history on the metabolic syndrome as defined by the ATP III. Diabetes Res Clin Pract 2005;67:70-7.