D I A B E T E S & M E T A B O L I S M J O U R N A L
This is an Open Access article distributed under the terms of the Creative Commons At- tribution Non-Commercial License (http://creativecommons.org/licenses/by-nc/3.0/) which permits unrestricted non-commercial use, distribution, and reproduction in any medium, provided the original work is properly cited.
Therapeutic Target Achievement in Type 2 Diabetic Patients after Hyperglycemia, Hypertension,
Dyslipidemia Management
Ah Young Kang1, Su Kyung Park2, So Young Park2, Hye Jeong Lee3, Ying Han4, Sa Ra Lee5, Sung Hwan Suh6, Duk Kyu Kim2,4, Mi Kyoung Park2,4
1Department of Internal Medicine, Choon Hae Hospital,
2Division of Endocrinology and Metabolism, Department of Internal Medicine, Dong-A University Medical Center,
3Department of Pharmacology, Dong-A University College of Medicine,
4Diabetes Center, Dong-A University Medical Sciences Research Institute,
5Department of Internal Medicine, Sevrance UVA Surgery, Busan,
6Division of Endocrinology and Metabolism, Department of Internal Medicine, Samsung Medical Center, Sungkyunkwan University School of Medicine, Seoul, Korea
Background: Our study group established “3H care” in 2002. The meaning of “3H care” attain and maintain adequate controls over hypertension, hyperlipidemia, and hyperglycemia in type 2 diabetic patients. This study evaluated the achievement of target goals after one year or more of “3H care” by specialists in our diabetic clinic.
Methods: This was a retrospective study of 200 type 2 diabetic patients who received “3H care” for one year or more in our dia- betic clinic. We evaluated achievement of target goals for metabolic controls as suggested by the American Diabetes Association.
Results: Overall, 200 type 2 diabetes patients were enrolled, of whom 106 were males (53%) and 94 were females (47%). After one year of “3H care,” the mean HbA1c was 7.2±1.5% and the percentage of patients achieving glycemic control (HbA1c <7%) was 51.8%. However only 32.2% of hypertensive patients achieved the recommended target. After one year of “3H care,” the per- centages of those who achieved the target value for dyslipidemia were 80.0% for total cholesterol, 66.3% for low density lipopro- tein cholesterol, 57.9% for triglyceride, and 51.8% for high density lipoprotein cholesterol. The percentage that achieved all three targets level was only 4.4% after one year and 14.8% after two years.
Conclusion: The results of this study demonstrate that only a minor proportion of patients with type 2 diabetes achieved the recommended goals despite the implementation of “3H care.” It is our suggestion that better treatment strategies and methods should be used to control hypertension, hyperlipidemia and hyperglycemia.
Keywords: Diabetes mellitus, type 2; Disease management; Treatment outcome
Corresponding author: Mi Kyoung Park
Division of Endocrinology and Metabolism, Department of Internal Medicine, Dong-A University Medical Center, Dong-A University College of Medicine, 3-1 Dongdaesin-dong, Seo-gu, Busan 602-715, Korea
INTRODUCTION
Cardiovascular disease is the leading cause of morbidity and mortality in diabetic patients, and among risk factors of car- diovascular disease, diabetes is considered to be comparable to cardiovascular disease [1-6]. One large-scale prospective study
on diabetes, the UK Prospective Diabetes Study (UKPDS), re- ported that aggressive blood glucose control resulted in a de- crease in microvascular complications, and though macrovas- cular complications were not significantly reduced and showed that the prevention of cardiovascular disease through blood glucose control alone was insufficient [7-9]. Additionally, in pISSN 2233-6079 · eISSN 2233-6087
The Action to Control Cardiovascular Risk in Diabetes (AC- CORD) and The Action in Diabetes and Vascular Disease (ADVANCE) studies, strict blood glucose control reduced the incidences of microvascular complications, particularly dia- betic nephropathy. Although this reduction was significant, and reduces the risk of cardiovascular disease, we concluded that there were relatively fewer contributing risk factors of car- diovascular disease [10,11]. Steno-2 study results showed that the risk of microvascular complications and macrovascular complications can be reduced through integrated diabetes management [12]. When the results of the above study were summarized, the prevention of diabetic complications was shown to require integrated management that maintained car- diometabolic risk factors such as dyslipidemia and hyperten- sion, in addition to fundamental blood glucose management.
Starting in 2002, our research group established the “3H care”
concept in order to ideally manage hypertension, hyperlipid- emia, and hyperglycemia in type 2 diabetic patients. Based on these concepts, the accompaniment of hypertension and dys- lipidemia with the diagnosis of diabetes was confirmed. In ad- dition, when hypertension and dyslipidemia existed in combi- nation, combination that were treated equally hyperglycemia maintenance, patient education were perfomed, and necessary drugs were administered. During follow-up, the two associat- ed conditions were managed to hyperglycemia identically. The importance of managing the aforementioned risk factors is al- ready known, and it has been reported that the actual treat- ment of individual risk factors does not result in the satisfacto- ry achievement of target goals [13-17]. Our research group performed “3H care” on type 2 diabetic patients for one year, and analyzed blood glucose, blood pressure, and the goal lipid levels at the end of the study period. Additionally, to analyze patients who were tracked for two years, a performance evalu- ation of 3H care was performed, from which it was determined that additional data to complement the maintenance method is required. It has been reported that the prevalence of meta- bolic syndrome is high in type 2 diabetic patients, and type 2 diabetes in combination with metabolic syndrome is known to increase mortality [18-20]. In this study, the prevalence of metabolic syndrome was investigated. This study was not based on specifically established guidelines or algorithms, and two endocrinology specialists performed treatment based on their own discretion and the clinical circumstances of each in- dividual patient.
METHODS
Objective
This study was performed for three years from September 1, 2004 to August 8, 2007 at a university hospital diabetes center.
The patients who were registered as having type 2 diabetes and excluding those with chronic renal failure, malignant tumors, 1,892 participants visited the outpatient clinic and received medical care for one year. During the one year follow-up peri- od with the applicable patients at least three outpatient visits were performed, during which blood pressure, HbA1c, lipid levels, and weight were measured. A total of 200 patients were analyzed (106 men, 94 women). All clinical data was from medical records and was used to conduct a retrospective study.
Study methods
Subject gender, age, body mass index (BMI), duration of dia- betes, cardiovascular disease history, diabetes treatment meth- od, and the number of blood pressure control drugs used were analyzed, and the measured glycated hemoglobin (HbA1c), blood pressure, and lipid conditions were examined in the ini- tial and most recent visits, based on these results each goal was investigated after one year. High blood pressure patients were defined as drug therapy recipients with a blood pressure ≥130/
80 mm Hg, hyperlipidemia was defined as total cholesterol
≥200 mg/dL, low density lipoprotein cholesterol (LDL-C) was defined at levels ≥100 mg/dL, high density lipoprotein choles- terol (HDL-C) in men was defined as a level ≤40 mg/dL, and in women as a level ≤50 mg/dL in patients receiving drug treatment. Additionally, regardless of the number of visits to the outpatient clinic, in order to compare the indicators from the 135 (67.5%) patients who were followed for two years, the success percentage was investigated each year. Height and weight were measured directly by trained nurses after patients disrobed and removed their shoes, and BMI was calculated during the hospital visit by dividing the measured weight (kg) by the squared height (m2). After allowing the blood pressure to stabilize for ten minutes, a mercury sphygmomanometer was used on the seated patients to measure their systolic and diastolic blood pressure. The diabetes treatment methods were separated into four parts: diet, oral hypoglycemic agents, insu- lin monotreatment, insulin and oral hypoglycemic agents. Hy- perglycemia management goals were HbA1c less than 7%, sys- tolic blood pressure <130 mm Hg, and diastolic blood pressure
<80 mm Hg. Total cholesterol less than 200 mg/dL, LDL-C
less than 100 mg/dL, triglycerides less than 150 mg/dL, HDL- C greater than 40 mg/dL in men, and over 50 mg/dL in wom- en were set. In this study total cholesterol and HDL-C were measured using the enzymatic colorimetry test method, tri- glycerides were measured using the glycerol elimination method, and LDL-C was measured using the homogenous en- zymatic colorimetric test. Glycated hemoglobin was measured using high performance liquid chromatography (Tosoh, To- kyo, Japan); the normal range in our hospital was 3.9% to 6.1%.
During the initial patent visit, insulin was measured in 62.5%
(125) patients, and C-peptide was measured in 70.5% (141) patients. Those figures could not be investigated one or two years later. The patient management goals were established in accordance with the guidelines of the American Diabetes As- sociation [21]. Since this study was a retrospective study of routine medical care circumstances, the differences in patient compliance to treatment were objectified and, could not be stated clearly.
Statistical methods
All data was expressed as mean±standard deviation, and SPSS version 14.0 (SPSS Inc., Chicago, IL, USA) was used to perform all statistical analysis. The comparison among the blood glu- cose, blood pressure, and lipid control groups, were analyzed using t-tests and chi-square tests; treatment success compari- sons were analyzed using ANOVA repeated measurements with a significance level was set at P<0.05.
Diagnosis of metabolic syndrome
The National Cholesterol Education Program (NCEP)-ATP III criteria [22] were used to diagnose metabolic syndrome, and instead of measuring waist circumference, the World Health Organization (WHO) [23] criteria for BMI were in ad- dition to the standard Asian obesity criteria, BMI ≥25 kg/m2. Because this study is one among many studies on type 2 diabe- tes patients, when the NCEP-ATP III diagnostic criteria [22]
for hyperglycemia were assumed to be satisfied, and when more than two of other NCEP-ATP III criteria were met, patients were diagnosed with metabolic syndrome.
RESULTS
Patient characteristics
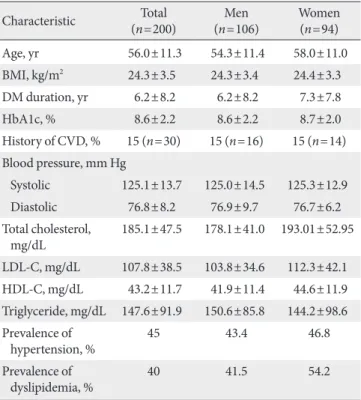
Among the 200 patients analyzed in this study, 106 were male, and 94 were female. The mean patient age was 56.0±11.3, and
the mean BMI was 24.3±3.5 kg/m2. Among the participants, 43.0% were classified as obese, possessing a BMI greater than 25 kg/m2. Among the patients, 29.0% were first diagnosed with diabetes during this study, and 27.0% had been diagnosed with diabetes duration more than ten years prior. In addition 45.0% of patients had been diagnosed with hypertension, 40.0%
of patients had been diagnosed with hyperlipidemia, and 20.5%
of patients had been diagnosed with both. Initially 30.0% of the patients did not have hypertension or hyperlipidemia and 20.0% of patients had an HbA1c level greater than 10.0% at the first visit (Table 1). This study was conducted for one year by diabetes specialists on 200 patients who were receiving diabe- tes treatment. After two years, 135 patients had been retained for follow up.
Blood glucose control
Of the original 135 patients who had followed-up, 51.8% had reached their goal of maintaining an HbA1c level less than 7.0% after one year (Fig. 1), at which time, 25.5% of patients had the necessary glycated hemoglobin level needed to estab-
Table 1. Characteristics of the study subjects Characteristic Total
(n=200) Men
(n=106) Women
(n=94)
Age, yr 56.0±11.3 54.3±11.4 58.0±11.0
BMI, kg/m2 24.3±3.5 24.3±3.4 24.4±3.3
DM duration, yr 6.2±8.2 6.2±8.2 7.3±7.8
HbA1c, % 8.6±2.2 8.6±2.2 8.7±2.0
History of CVD, % 15 (n=30) 15 (n=16) 15 (n=14) Blood pressure, mm Hg
Systolic 125.1±13.7 125.0±14.5 125.3±12.9
Diastolic 76.8±8.2 76.9±9.7 76.7±6.2
Total cholesterol,
mg/dL 185.1±47.5 178.1±41.0 193.01±52.95 LDL-C, mg/dL 107.8±38.5 103.8±34.6 112.3±42.1 HDL-C, mg/dL 43.2±11.7 41.9±11.4 44.6±11.9 Triglyceride, mg/dL 147.6±91.9 150.6±85.8 144.2±98.6 Prevalence of
hypertension, % 45 43.4 46.8
Prevalence of
dyslipidemia, % 40 41.5 54.2
Data are presented as mean±standard error.
BMI, body mass index; DM, diabetes mellitus; CVD, cardiovascular disease; LDL-C, low density lipoprotein cholesterol; HDL, high den- sity lipoprotein cholesterol.
lish blood glucose control (greater than 8%). Among these pa- tients, the percentage with glycated hemoglobin levels greater than 10% had increased to 7.5%. There were no differences in age and BMI based on analyzed results of patient characteris- tics under the target 7% HbA1c. Among the 106 male partici- pants, 62 (58.4%) reached their treatment goal, and among the 94 female participants, 42 (44.6%) reached their treatment goal, demonstrating that male patients had a higher rate of success (P=0.035). Additionally, as glycated hemoglobin levels were lower initially, the treatment goal success rate increased (P<0.001). The average time since diagnosis of the patient group who reached their treatment goal was 4.6±7.1 years and the average time since diagnosis of the patient group who failed to reach their treatment goal was 8.0±8.9 years. The shorter was the time since diagnosis, the higher was the treatment success rate (P=0.003) (Table 2). In this study, diet, oral hypo-
glycemic agents, insulin monotherapy, and insulin and oral hypoglycemic agent combination therapy were divided into four groups, and the mean glycated hemoglobin levels of each group were compared. The mean level of the diet group was 6.0±0.4%, that of the oral hypoglycemic agent group was 6.8±
2.2%, that of the insulin monotherapy group was 7.9±2.5%, and that of the insulin and oral hypoglycemic agent combina- tion therapy group was 8.3±4.1%. When the treatment meth- ods of the 58 (29.0%) type 2 diabetes patients who were diag- nosed with diabetes for the first time were examined, the re- sults for diet, oral hypoglycemic agents, insulin monotherapy, and insulin and oral hypoglycemic agent combination therapy, were 1.7%, 69.0%, 15.5%, and 13.8%, respectively (Table 3).
Blood pressure control
Among the participants in this study, 45% (n=90) had hyper- tension, and 32.2% of these patients had reached their treat- ment goals after one year, and 64% of the participants were Table 2. Characteristics of the study subjects according to
their achievement of glycemic control
Characteristic HbA1c
P value
<7% ≥7%
Sex Male 62 44 0.035
Female 42 52
Age, yr 55.7±11.3 56.4±11.4 0.626
BMI, kg/m2 23.9±3.0 24.7±3.9 0.295
Duration, yr 4.6±7.1 8.0±8.9 0.003
Initial HbA1c, % 7.8±2.2 9.7±1.8 <0.001 Data are presented as mean±standard error or number.
BMI, body mass index.
Table 3. Diabetes management of study subjects with newly diagnosed diabetes
Type of diabetes
treatment No.(%) Antihyperten-
sive agent Lipid lowering agent
Diet 1 (1.7) 1 (100.0) 1 (100.0)
OHA 40 (69.0) 19 (47.5) 20 (50.0)
Insulin 9 (15.5) 1 (11.1) 6 (66.7)
Insulin+OHA 8 (13.8) 2 (25.0) 2 (25.0) Data are presented as number (%).
OHA, oral hypoglycemic agent.
Fig. 1. Proportion of patients reaching the therapeutic goals at baseline and one and two years later. Baseline in- cludes only patients who were fol- lowed-up until the end of the second year. BP, blood pressure; TC, total cho- lesterol; LDL-C, low density lipoprotein cholesterol; TG, >triglyceride; HDL-C, high density lipoprotein cholesterol (HDL-C >40 mg/dL [male], HDL-C
>50 mg/dL [female]). aP<0.001.
Basal 1 yr later 2 yr later
HbA1c<7.0
BP<130/80 mm Hg
TC<200 mg/dL
L DL-C<100 mg/dL
TG<150 mg/dL HDL
3H goal 90
80 70 60 50 40 30 20 10 0
a a
a a
a a
(%)
taking one type of antihypertensive drugs, 32% were taking two types of antihypertensive drugs, and 4% were taking three or more antihypertensive drugs. The percentage of treatment success in patients who were taking only one type of antihy- pertensive drug was high. After one year, 32.2% of patients had reached their treatment goals. Among the 46 male partici- pants, 11 (23.9%) reached their treatment goals, and among the 44 female participants, 18 (40.9%) reached their treatment goals. Females were more likely to achieve their treatment goals (P=0.025). In addition, success rates appeared to be indepen- dent of age, BMI, HbA1c levels, and lipid treatment goals (Ta- ble 4).
Lipid control
Initially, 40% (n=80) of the participants had dyslipidemia, and during the one year observation period, 7.5% (n=15) were newly diagnosed with dyslipidemia. The types of therapeutic drugs used to achieve lipid control were statin (n=67), fenofi- brate (n=12), and statin and ezetimibe (n=1). Also, there were two cases in which treatment was changed from fenofibrate to statin during the observation period. In patients with dyslipid- emia, the management goal success rate after one year was 80% for total cholesterol (<200 mg/dL), while those of LDL-C (<100 mg/dL), triglycerides (<150 mg/dL), and HDL-C (>40 mg/dL in males, >50 mg/dL) were 66.3%, 57.9%, and 51.8%,
respectively. The percentage of patients who reached their se- rum lipid level goals after one year were 78.0%, 63.0%, 67.0%, and 50% in each group, respectively. When the characteristics of the patients who had reached their treatment goals were ex- amined, as age increased, success rate increased, and treatment goals were relatively unaffected by gender, BMI, and hyperten- sion. The average HbA1c of patients who had reached their target was 6.8±1.0%, and the mean HbA1c of patients who had failed to reach their goal was 7.2±1.4%. The average HbA1c of patients who had reached their goal was lower than those who had failed to reach their goal, indicating that the number of patients who had good blood glucose or hyperlipidemia con- trol was not statistically significant (P=0.197) (Table 4).
Annual follow-up results
Of the total 200 participants, 135 (67.5%) were followed-up for a two year period. Comparing the indicators of the 135 pa- tients at the start of the treatment with those, one and two years after, the average HbA1c improved from 8.7±2.2% at the start of treatment to 7.2±1.5% after one year, and to 7.4±2.2% after two years (P<0.001) (Table 5). Compared to the changes in HbA1c, BMI, and systolic blood pressure showed no signifi- cant changes, diastolic blood pressure, total cholesterol, and LDL-C were reduced, and HDL-C increased significantly. How- ever, triglyceride levels increased in the 135 patients who un- Table 4. Characteristics of study subjects according to their achievement of blood pressure and lipid control
Characteristic Blood pressure Lipid level
≥130/80 mm Hg <130/80 mm Hg P value Goal ( -) Goal ( +) P value
No. 61 29 66 29
Sex Male 35 11 0.025 29 15 0.316
Female 26 18 37 14
Age, yr 61.7±9.9 57.4±8.7 0.073 54.2±10.6 59.1±10.7 0.044
SBP, mm Hg 132.5±9.7 113.6±8.3 <0.001 122.2±12.5 123.8±12.1 0.272
DBP, mmHg 80.6±6.7 67.8±7.2 <0.001 73.1±9.3 75.7±7.5 0.572
HbA1c, % 7.2±1.4 7.5±1.5 0.407 7.2±1.4 6.8±1.0 0.197
BMI, kg/m2 25.1±3.5 25.4±3.1. 0.647 25.5±2.7 25.9±3.0 0.526
Total cholesterol, mg/dL 172.7±31.9 168.9±37.6 0.259 176.4±41.1 154.7±21.7 0.009
Triglyceride, mg/dL 130.2±55.3 138.5±51.0 0.860 167.0±79.5 102.1±26.0 <0.001
HDL-C, mg/dL 43.3±8.8 45.4±11.0 0.228 43.3±9.3 51.9±7.3 <0.001
LDL-C, mg/dL 89.6±27.6 92.0±27.4 0.701 96.0±30.7 75.9±18.8 <0.001
Data are presented as mean±standard error or number.
SBP, systolic blood pressure; DBP, diastolic blood pressure; BMI, body mass index; HDL-C, high density lipoprotein cholesterol; LDL-C, low density lipoprotein cholesterol.
derwent two years of follow-up (Table 5). Two years after the
“3H care,” 57% of the 135 follow-up patients had reached their blood pressure goals, which was an improvement from that at the one year mark. The dyslipidemia success results showed that the cholesterol goal (<200 mg/dL) was achieved in 85.1%
of patients and that for LDL-C (<100 mg/dL) was reached by 71.8%. The percentages of patients achieving triglyceride (<150 mg/dL) and HDL-C goals were 64.5% and 64%, respec- tively, and the two year follow-up showed a much higher achievement percentage than that at the one year follow up.
The percentage of patients who had reached their goals for blood pressure and dyslipidemia were higher after two years than they were after one year, and patients who had reached their HbA1c goals were 51.8% after one year, and 43.7% after two years, showing a decreasing pattern. In addition, 4.4%
(n=6) of patients had combination hyperglycemia, hyperten- sion, and dyslipidemia after one year compared to 14.8% (n=
20) after two years (Fig. 1).
The prevalence and control of metabolic syndrome
Of the type 2 diabetes patients in this study, through 127 (63.5%) were diagnosed with metabolic syndrome according to the NCEP-ATP III (using BMI instead of waist circumfer- ence for diagnostic criteria). The prevalence of metabolic syn- drome in males was 59.4% in male and 68.0% in females. When all patients were analyzed, the mean number of metabolic syn- drome elements were 1.8±1.1, and only 12% of patients had only diabetes elements, while 25.5% had one element, 34.5%
had two elements, 22.0% had three elements, and 6.0% had four elements. In patients with metabolic syndrome, the prev- alence of each component of metabolic syndrome was: 49.5%
for hypertension, 37.5% for hypertriglyceridemia, 56.0% for low HDL-C hyperlipidemia, 43.0% for Obese. Low HDL-C hyperlipidemia was the most common element of metabolic syndrome. Hypertension and hypertriglyceridemia were more prevalent in male patients, and low HDL-C hyperlipidemia had a higher prevalence in females. There was no difference in HbA1c level between the two groups based on the presence of metabolic syndrome. The prevalence of metabolic syndrome based on the duration of diabetes showed that prevalence in- creased with duration, although the association was not statis- tically significant. After one year, the HbA1c levels in the met- abolic syndrome group and non-metabolic syndrome group were reduced from 8.6±1.8% to 7.4±1.4%, and from 8.6±2.7%
to 7.1±1.8%, respectively. Blood pressure, triglyceride level, total cholesterol, and LDL-C were all reduced but HDL-C showed no change in the metabolic syndrome group. In the non-metabolic syndrome group, LDL-C was reduced or showed no significant change, and the triglyceride level increased (P<0.001).
DISCUSSION
Due to the increase in blood glucose levels and cardiometa- bolic risk factors in type 2 diabetes patients, the risk of devel- oping microvascular and macrovascular complications tend to increase. To prevent complications from diabetes in addition to blood glucose control, the importance of the management of cardiometabolic risk factors such as dyslipidemia and hy- pertension has been emphasized. However, there are not many studies on how well it has actually been managed, and several studies have reported that actual medical care goal percentages could not be satisfied. In this study, 51.8% of patients reached their HbA1c goal of less than 7.0%, a lower number than was expected. When this study was compared with studies from other countries, the results reported by Harris et al. [24] showed that 44.6% of patients had reached the target of and HbA1c less than 7.0%. In the American National Health and Nutri- tion Examination Survey (NHANES) [25], 57.1% of patients had reached the target HbA1c of less than 7.0%. In a reports by Liebl et al. [26] involving data from eight countries based on the European Diabetes Policy Group Guidelines, 31% had an HbA1c less than 6.5% and in reports by Sone et al. [27] from Table 5. Therapeutic target achievement at baseline and one
and two years later
Variable Baseline 1 year later 2 years later
HbA1c, % 8.7±2.2 7.2±1.5 a 7.4±2.2 a
SBP, mm Hg 123.0±19.0 121.0±15.2 122.4±17.7 DBP, mm Hg 76.2±10.4 74.0±10.3 71.3±11.7 a
BMI, kg/m2 24.3±3.5 24.7±3.3 24.6±3.3
Total cholesterol, mg/dL 178.6±47.1 168.6±37.6 169.0±33.8 Triglyceride, mg/dL 142.3±93.3 140.1±81.0 154.3±149.3 HDL-C, mg/dL 42.9±11.0 44.7±10.4 49.1±11.2 a LDL-C, mg/dL 105.1±38.7 88.6±28.0 a 85.2±11.2 a Data are presented as mean±standard error.
SBP, systolic blood pressure; DBP, diastolic blood pressure; BMI, body mass index; HDL-C, high density lipoprotein cholesterol: LDL, low density lipoprotein cholesterol.
aP<0.05 compared to the group of baseline.
Japan, 29.3% had an HbA1c less than 7.0%. In a South Korean study performed by Park et al. [17], 35.7% of patients reached their goal of an HbA1c less than 7.0%, and Lee et al. [28] re- ported a success rate of 49.2%. These results were similar to or lower than the results in the presenting study.
When the characteristics of patients who had reached their target for glycemic control and patients who had not reached their target for glycemic control were compared, the target success rate in males in this study was high, unlike that report- ed by Lee et al. [28], while other studies have shown no differ- ences between men and women, regarding increases in BMI or increasing effect of smoking on HbA1c [17,25-27]. Despite strict intensive care, HbA1c increased over time, in a previous study [8]. In the present study, the mean duration of diabetes in patients who successfully reached their treatment goals was 4.6±7.1 years, and the mean duration in patients who did not reached their treatment goal was 8.0±8.9 years. The shorter was the duration of diabetes, the higher was the treatment suc- cess rate (P=0.003) (Table 2).
When the level of glycemic control based on diabetes treat- ment was examined, the investigation of type 2 diabetes treat- ment in the European CODE-II study [26] reported that the mean glycated hemoglobin levels of the diet and exercise, ad- ministration of oral hypoglycemic agents, and insulin monotreat- ment and insulin and hypoglycemic agent groups were 6.7%, 7.5%, and 8.1%, respectively. In the present study, diet, oral hypoglycemic agents, insulin monotherapy, and insulin and oral hypoglycemic agent combination therapy were consid- ered as four individual trait groups. When the mean glycated hemoglobin values of each was compared, the results showed that the diet group had a value of 6.0±0.4%, that of the oral hypoglycemic agents group was 6.8±2.2%, that of the insulin monotherapy group was 7.9±2.5%, and that of the insulin and oral hypoglycemic agents combination therapy group was 8.3±4.1%. Glycemic control becomes more difficult as diabe- tes progresses, and the necessity for additional drug actions can be seen. Of the total participants 45% (n=90) had hyper- tension, and similarly, 20% to 60% of patients had diabetes with hypertension. In the one year follow-up focused on target success among hypertension patients, 32.2% reached their tar- get. In the reports of the tertiary hospital-based study of Lim et al. [13], 43.2% of patients who had taken antihypertensive drugs had a blood pressure below the target 130/85 mm Hg, a lower than expected result which prompted consideration of target lower in. In the present study 44.5% of all patients had
under 130/80 mm Hg, which was similar to the 45.5% report- ed by the NHANES. When the two year follow-up results were examined, 57% of patients had achieved their two year “3H care.” These results were compared with the one year follow- up results, to determine whether a higher success rate had been achieved, based on management efforts and demonstrat- ed that the target blood pressure was more achievable.
In patients with dyslipidemia, after one year of management, the success rate for total cholesterol in patients was 80%, and those of LDL-C, triglycerides, HDL-C were 66.3%, 57.9%, and 51.8%, respectively. These results were higher than the 56.6%
for total cholesterol and 35.7% for LDL-C reported by Lim et al. [13] in their study on dyslipidemia patients at a tertiary hospital. After one year, the plasma lipid levels in all patient groups were 78.0%, 63.0%, 67.0%, and 50.0%, respectively, which were higher than that reported by the NHANES [25]:
46.5% LDL-C, 46.6% triglycerides, and 58.0% HDL-C. The LDL-C success rate in our study was also greater than that of the NHANES, which was 51.0%. Due to the nature of the par- ticipants in the present study, the use of aggressive lipid-lower- ing drugs and appropriate monitoring devices from the diabe- tes clinic specialist is believed to have contributed to this suc- cess rate. Despite undergoing aggressive drug therapies for hy- perglycemia, hypertension, and dyslipidemia during the two year experimental period, the final results are not significantly different from the reports after one year of treatment. There- fore, after a maximum of one year of close observation, the in- troduction of more aggressive therapy is thought to be neces- sary for patients who are unable to reach their targets. In addi- tion, the success rate of hypertension, dyslipidemia, and high blood sugar treatments was only 4.4% (n=6) after one year, and 14.8% (n=20) after two years. In order to reduce mortality from microvascular and macrovascular complications, these three conditions must be simultaneously managed, and to achieve target levels, various treatment may be necessary. Ad- ditionally, 32.5% (n=65) of the original participants in this study did not finish the study, which was similar to the drop- out rate from another studies [27]. Such high dropout rates make continuous integrated treatments impossible, and since this deteriorates the quality of diabetes management, encour- aging patients to continue with their treatment is important.
The components of metabolic syndrome typically accom- pany type 2 diabetes, which is clinically important due to the increased risk of cardiovascular disease in patients with diabe- tes [18-20]. The prevalence of metabolic syndrome in the par-
ticipants of this study was 63.5%, lower than the 82.6% found using the International Diabetes Federation (IDF) criteria in German type 2 diabetes patients [29] and that of the preva- lence of metabolic syndrome in diabetes patients older than 50 years from the NHANES [25], and similar to the 65.9% preva- lence of metabolic syndrome in Hong Kong diabetes patients [30]. In a study performed in 2006 by Kim et al. [31] on Kore- an metabolic syndrome patients, the prevalence of metabolic syndrome in type 2 diabetes patients was 77.9%, which was higher than what was reported by the present study. Tong et al.
[30] reported that diabetes patients with metabolic syndrome are more at risk for cardiovascular disease than diabetes pa- tients without metabolic syndrome. Therefore, identifying the presence of metabolic syndrome in type 2 diabetes patients is an important step in treatment.
There were several limitations in this study. This study was performed at one center and the study did not include a large variety or a large number of patients. In addition in the two year follow-up, 65 patients dropped out and their data could not be used. Therefore, in the future, a larger scale study will be required to establish the success rates and complications of metabolic syndrome in type 2 diabetes patients. In conclusion, this study showed the current situation of type 2 diabetes pa- tients who are receiving treatment from endocrinologists at a single university hospital, and the results of the one year of
“3H care” show that 48.2% of cases with hyperglycemia, 55.5%
of cases with hypertension, and 32% to 50% of cases with dys- lipidemia had not reached their targets. The results from two years of “3H care” yielded similar results. The results were slight- ly improved compared to those of several previous studies however, the improvement did not reach a satisfactory level.
Also, more research and clinical effort will be requied to achieve the targets of hyperglycemia, hypertension, and dyslipidemia.
CONFLICTS OF INTEREST
No potential conflict of interest relevant to this article was re- ported.
REFERENCES
1. Savage PJ. Cardiovascular complications of diabetes mellitus:
what we know and what we need to know about their preven- tion. Ann Intern Med 1996;124(1 Pt 2):123-6.
2. Barrett-Connor EL, Cohn BA, Wingard DL, Edelstein SL. Why
is diabetes mellitus a stronger risk factor for fatal ischemic heart disease in women than in men? The Rancho Bernardo Study.
JAMA 1991;265:627-31.
3. Haffner SM, Lehto S, Ronnemaa T, Pyorala K, Laakso M. Mor- tality from coronary heart disease in subjects with type 2 dia- betes and in nondiabetic subjects with and without prior myo- cardial infarction. N Engl J Med 1998;339:229-34.
4. Kannel WB, McGee DL. Diabetes and cardiovascular disease.
The Framingham study. JAMA 1979;241:2035-8.
5. Comaschi M, Coscelli C, Cucinotta D, Malini P, Manzato E, Nicolucci A; SFIDA Study Group--Italian Association of Dia- betologists (AMD). Cardiovascular risk factors and metabolic control in type 2 diabetic subjects attending outpatient clinics in Italy: the SFIDA (survey of risk factors in Italian diabetic subjects by AMD) study. Nutr Metab Cardiovasc Dis 2005;15:
204-11.
6. Reichard P, Nilsson BY, Rosenqvist U. The effect of long-term intensified insulin treatment on the development of microvas- cular complications of diabetes mellitus. N Engl J Med 1993;
329:304-9.
7. Stratton IM, Adler AI, Neil HA, Matthews DR, Manley SE, Cull CA, Hadden D, Turner RC, Holman RR. Association of gly- caemia with macrovascular and microvascular complications of type 2 diabetes (UKPDS 35): prospective observational study.
BMJ 2000;321:405-12.
8. UK Prospective Diabetes Study (UKPDS) Group. Intensive blood-glucose control with sulphonylureas or insulin compared with conventional treatment and risk of complications in pa- tients with type 2 diabetes (UKPDS 33). Lancet 1998;352:837-53.
9. UK Prospective Diabetes Study (UKPDS) Group. Effect of in- tensive blood-glucose control with metformin on complica- tions in overweight patients with type 2 diabetes (UKPDS 34).
Lancet 1998;352:854-65.
10. ADVANCE Collaborative Group, Patel A, MacMahon S, Chalmers J, Neal B, Billot L, Woodward M, Marre M, Cooper M, Glasziou P, Grobbee D, Hamet P, Harrap S, Heller S, Liu L, Mancia G, Mogensen CE, Pan C, Poulter N, Rodgers A, Wil- liams B, Bompoint S, de Galan BE, Joshi R, Travert F. Intensive blood glucose control and vascular outcomes in patients with type 2 diabetes. N Engl J Med 2008;358:2560-72.
11. Action to Control Cardiovascular Risk in Diabetes Study Group, Gerstein HC, Miller ME, Byington RP, Goff DC Jr, Bigger JT, Buse JB, Cushman WC, Genuth S, Ismail-Beigi F, Grimm RH Jr, Probstfield JL, Simons-Morton DG, Friedewald WT. Effects of intensive glucose lowering in type 2 diabetes. N Engl J Med
2008;358:2545-59.
12. Park SW, Kim DJ, Min KW, Baik SH, Choi KM, Park IB, Park JH, Son HS, Ahn CW, Oh JY, Lee J, Chung CH, Kim J, Kim H.
Current status of diabetes management in Korea using nation- al health insurance database. J Korean Diabetes Assoc 2007;31:
362-7.
13. Lim DJ, Kwon HS, Kim HS, Lee JH, Ko SH, Lee JM, Kim SR, Lee WC, Son HS, Cha BY, Lee KW, Son HY, Kang SK, Yoon KH. Clinical characteristics of the diabetic patients managed at the different medical institutions in Seoul and Gyeonggi province. Korean J Med 2006;71:173-81.
14. Rhee SY, Kim YS, Oh S, Choi WH, Park JE, Jeong WJ. Diabcare Asia 2001--Korea country report on outcome data and analy- sis. Korean J Intern Med 2005;20:48-54.
15. Kim SA, Park WS, Ohrr HC, Kang HY, Lee DH, Yi SW, Kwak YH, Song JS. Prevalence and management status of diabetes mellitus in Korea. Korean J Med 2005;68:10-7.
16. Lee YS. The current status of type 2 diabetes management at a university hospital. Korean Diabetes J 2009;33:241-50.
17. Park JH, Kim KW, Kang EJ, Kim TY, Lee SR, Bae SC, Kim MK, Choi SY, Park JH. Evaluation of glycemic control in type 2 dia- betic patients have been treated in general hospital. J Korean Diabetes Assoc 2004;28:208-18.
18. Bonora E, Targher G, Formentini G, Calcaterra F, Lombardi S, Marini F, Zenari L, Saggiani F, Poli M, Perbellini S, Raffaelli A, Gemma L, Santi L, Bonadonna RC, Muggeo M. The Metabolic Syndrome is an independent predictor of cardiovascular dis- ease in type 2 diabetic subjects. Prospective data from the Ve- rona Diabetes Complications Study. Diabet Med 2004;21:52-8.
19. Ford ES. Risks for all-cause mortality, cardiovascular disease, and diabetes associated with the metabolic syndrome: a sum- mary of the evidence. Diabetes Care 2005;28:1769-78.
20. Alexander CM, Landsman PB, Teutsch SM, Haffner SM; Third National Health and Nutrition Examination Survey (NHANES III); National Cholesterol Education Program (NCEP). NCEP- defined metabolic syndrome, diabetes, and prevalence of coro- nary heart disease among NHANES III participants age 50 years and older. Diabetes 2003;52:1210-4.
21. American Diabetes Association. Standards of medical care in diabetes--2008. Diabetes Care 2008;31 Suppl 1:S12-54.
22. Expert Panel on Detection, Evaluation, and Treatment of High Blood Cholesterol in Adults. Executive Summary of the Third
Report of The National Cholesterol Education Program (NCEP) Expert Panel on Detection, Evaluation, and Treatment of High Blood Cholesterol In Adults (Adult Treatment Panel III). JAMA 2001;285:2486-97.
23. Alberti KG, Zimmet PZ. Definition, diagnosis and classifica- tion of diabetes mellitus and its complications. Part 1: diagno- sis and classification of diabetes mellitus provisional report of a WHO consultation. Diabet Med 1998;15:539-53.
24. Harris MI, Eastman RC, Cowie CC, Flegal KM, Eberhardt MS.
Racial and ethnic differences in glycemic control of adults with type 2 diabetes. Diabetes Care 1999;22:403-8.
25. Cheung BM, Ong KL, Cherny SS, Sham PC, Tso AW, Lam KS.
Diabetes prevalence and therapeutic target achievement in the United States, 1999 to 2006. Am J Med 2009;122:443-53.
26. Liebl A, Mata M, Eschwege E; ODE-2 Advisory Board. Evalua- tion of risk factors for development of complications in type II diabetes in Europe. Diabetologia 2002;45:S23-8.
27. Sone H, Kawai K, Takagi H, Yamada N, Kobayashi M. Outcome of one-year of specialist care of patients with type 2 diabetes: a multi-center prospective survey (JDDM 2). Intern Med 2006;
45:589-97.
28. Lee JE, Park HA, Kang JH, Lee SH, Cho YG, Song HR, Kim SW, Lee JS. State of diabetes care in Korean adults: according to the American Diabetes Association Recommendations. J Korean Acad Fam Med 2008;29:658-67.
29. Koehler C, Ott P, Benke I, Hanefeld M; DIG Study Group.
Comparison of the prevalence of the metabolic syndrome by WHO, AHA/NHLBI, and IDF definitions in a German popu- lation with type 2 diabetes: the Diabetes in Germany (DIG) Study. Horm Metab Res 2007;39:632-5.
30. Tong PC, Kong AP, So WY, Yang X, Ho CS, Ma RC, Ozaki R, Chow CC, Lam CW, Chan JC, Cockram CS. The usefulness of the International Diabetes Federation and the National Cho- lesterol Education Program’s Adult Treatment Panel III defini- tions of the metabolic syndrome in predicting coronary heart disease in subjects with type 2 diabetes. Diabetes Care 2007;30:
1206-11.
31. Kim TH, Kim DJ, Lim S, Jeong IK, Son HS, Chung CH, Koh G, Lee DH, Won KC, Park JH, Park TS, Ahn J, Kim J, Park KG, Ko SH, Ahn YB, Lee I. Prevalence of the metabolic syndrome in type 2 diabetic patients. Korean Diabetes J 2009;33:40-7.