Printed in the Republic of Korea http://dx.doi.org/10.5012/jkcs.2014.58.1.80
Optimizing Oily Wastewater Treatment Via Wet Peroxide Oxidation Using Response Surface Methodology
Jianzhong Shi, Xiuqing Wang, and Xiaoyin Wang†,*
College of Environmental Engineering, Wuhan Textile University, Wuhan 430073, China
†College of Science, Huazhong Agricultural University, Wuhan 430070, China.
*E-mail: [email protected]
(Received December 20, 2013; Accepted December 30, 2013)
ABSTRACT. The process of petroleum involves in a large amount of oily wastewater that contains high levels of chemical oxygen demand (COD) and toxic compounds. So they must be treated before their discharge into the receptor medium. In this paper, wet peroxide oxidation (WPO) was adopted to treat the oily wastewater. Central composite design, an experimental design for response surface methodology (RSM), was used to create a set of 31 experimental runs needed for optimizing of the operating conditions. Quadratic regression models with estimated coefficients were developed to describe the COD removals.
The experimental results show that WPO could effectively reduce COD by 96.8% at the optimum conditions of temperature 290 °C, H2O2 excess (HE) 0.8, the initial concentration of oily wastewater 3855 mg/L and reaction time 9 min. RSM could be effectively adopted to optimize the operating multifactors in complex WPO process.
Key words: Wet peroxide oxidation, Oily wastewater, COD removal, Response surface methodology, Process optimization INTRODUCTION
The oily wastewater is generated by various oil, petro- leum industries, oil refineries, chemical and petrochem- ical plants, metal working plants, oil terminals during washing of reserving tanks. The emulsion consists of water (up to 90%), oil (mineral, organic and synthetic) and sur- factant.1,2 The discharge of oily wastewater into the natural environment creates a major ecological problem through- out the world.3−5 It is necessary to purify this water so that it can be reused to save water resources and to protect the environment. It was reported that more than 2000 million tons of wastewater is produced by oil refineries only in the Middle East and European Union countries.6,7 Water qual- ity of the oily wastewater is highly fluctuated depending on the crude oil extraction process, oil in water separation and subsequent preliminary treatment.8 Therefore, oily wastewater treatment is urgently needed in today’s field of environmental engineering problems. Consequently, there is a need for environmentally benign technologies capable to effectively neutralize the oily wastewater and reduce its adverse impacts on the environment.
Of the various processes that can be used to treat oily wastewater, advanced oxidation processes (AOPs) with the capability of exploiting the high reactivity of hydroxyl radicals in driving oxidation have emerged a promising technology for refractory organic compounds treatment.9 Several technologies such as Fenton, photo-Fenton, wet
oxidation, ozonation, photocatalysis, etc. are included in the AOPs and their main differences are the source of rad- icals. Wet peroxide oxidation (WPO) is a kind of AOPs developed on the basis of wet oxidation and it is devel- oped in order to decrease the running cost, which is effi- cient under severe temperature and pressure conditions.10 It has gained wide attentions of many scholars in recent years.11−15 Single-factor analysis is employed in the cur- rent study of WPO process, but it does not predict the opti- mum conditions well and does not also reveal the interaction between the various operating parameters. In this paper, important factors and the interaction between the factors for WPO of oily wastewater by RSM optimization are investigated. RSM is a product of the integration of math- ematics and statistics,16−20 which has been widely applied to professional research in biology and statistics, but it is rarely reported in environmental governance especially in the WPO process optimization. RSM can draw the response surface according to some of point value and obtain optimal operating point through the analysis of mathematical model.
But the optimal point obtained from traditional methods is only the relatively optimal point of each group in orthog- onal table and is not the optimal overall value of the real.
MATERIALS AND METHODS
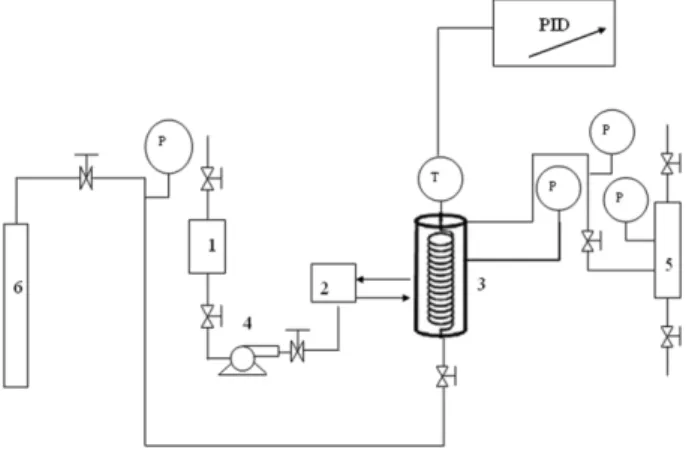
Experimental Apparatus and Experimental Materials The flow diagram of the experimental setup is shown in
Fig. 1. The reactor is made from 1Cr18Ni9Ti, and its vol- ume is 500 milliliter. It is subjected to a maximum tem- perature of 600oC, a maximum pressure of 40 MPa. Oily wastewater is selected from a plant of China and the wastewater contains 37% crude oil, 61% water and 2%
sediment. Oxidant is commercial H2O2 (analysis purity, 35 wt% aqueous solution).
Experimental Method
WPO of the oily wastewater was conducted in a labo- ratory-scale, batch reactor. The stirrer was used to keep from the formation of char resulting from thermal cracking of oily wastewater at the walls of the reactor.
The speed of the stirrer is 1150 r/min. The electric fur- nace was used as heater. The heating wires of electric fur- nace were placed below and around the reactor. The reaction temperature was monitored directly using thermocouple (inserted inside the reactor) and controlled within 1oC by a temperature controller (Shanghai Yatai Instrumentation Co., N-8000 Digital Controller). Before the experiment, the reactor was loaded with oily wastewater and deionized water to bring the total volume of liquid to 90–110 mL and concentration of oily wastewater is approximately corre- sponding to initial COD of 1000–5000 mg/L. Then, nitrogen gas was used to purge the reactor for 10 min. After purg- ing, the reactor was heated for about 50 min. Upon reach- ing the reaction condition of reaction temperatures from 250 to 330oC, reaction temperature remained stable within 1oC, then the specified amount of H2O2 was pressured and fed into the reactor using a syringe pump within 2 s at room temperature. The reaction was conducted for a given reaction time from 1 to 9 min. After the reaction, the sample valve of reactor was opened and the effluent was cooled
rapidly in a shell and tube heat exchanger and then depres- surized to ambient condition. The product stream was then separated into liquid and vapor phases. The liquid products were collected in a graduated cylinder. Liquid sam- ples (ca.15 mL) were periodically withdrawn from the reac- tor and analyzed.
Analytical Methods
The diluted wastewater and COD of the collected liquid are measured by potassium dichromate method of Chi- nese Standard 11914-89. The HE is defined as equation 1.
HE = H2O2,Excess= × 100
(1)
Experimental Design
The central composite design, an experimental design for RSM, was used to create a set of designed experiments by MINITAB software (version 14). In this paper, the cen- tral composite design is selected for 4 factors, i.e., tem- perature (X1), initial concentration of oily wastewater (X2), reaction time (X3) and HE (X4).
Table 1 shows the levels of original and coded factors using central composite design. Table 2 shows central compos- ite design and response value. Given the four main variables and five test levels, thirty-one experiments were designated by MINITAB software.
RESULTS AND DISCUSSION RSM Model Establishment
To perform response surface regression analysis, exper- imental data were fitted to a full quadratic model, providing regression coefficients. The full quadratic model used in the response (COD removal) was described as the following:
COD Removal = 0.915743 – 0.024033X1+ 0.030608X2
+ 0.003667X3+ 0.009083X4– 0.001952X12 – 0.009002X22 – 0.005177X32– 0.006115X42 + 0.031775X1X2 – 0.014212X1X3– 0.012025X1X4 + 0.003600X2X3 + 0.024787X2X4 + 0.007775X3X4
Table 3 shows estimated regression coefficient of COD (H2O2)in− (H2O2)stoichiometric
(H2O2)in Figure 1. Schematic diagram of the experimental setup. 1. Oxidant
container 2. Heater 3. High-pressure Autoclave 4. High-pressure pump 5. Gas-liquid separator 6. Nitrogen Cylinder
Table 1. Factor level
Factor level −2 −1 0 1 2
X1/°C 250 270 290 310 330
X2/mg/L 1000 2000 3000 4000 5000
X3/min 1 3 5 7 9
X4 0 0.2 0.4 0.6 0.8
removal and Table 4 shows the results of variance anal- ysis for COD removal. From Table 4, it is seen that the influence of each independent factor on the models was tested for its level of statistical significance by analyzing the variance. These results show that the effects of all terms on COD removal are statistical significant at the 5%
level. So it is concluded that the affecting factors for COD removal are more complex and it is joint action by many factors.
Interaction by RSM
The surface plot of objective function is drawn by Minitab in order to more directly reflect the interaction between the various factors that affect the COD removal and the role of strength for interaction between the var- ious experimental factors.
Figs. 2, 3, 4, 5, 6 and 7 show the response surface plots for the variations of COD removal according to temper- Table 2. Central composite design and response value
Number X1 X2 X3 X4 COD Removal / %
1 1 1 −1 −1 90.59
2 2 0 0 0 86.67
3 −2 0 0 0 95.33
4 0 0 0 0 91.33
5 1 −1 1 −1 80.00
6 −1 1 −1 1 94.00
7 0 0 0 0 92.00
8 0 0 −2 0 88.00
9 −1 −1 −1 −1 89.75
10 0 0 0 0 91.44
11 −1 1 −1 −1 90.15
12 0 0 0 0 91.46
13 −1 −1 −1 1 87.00
14 −1 −1 1 1 95.00
15 0 −2 0 0 86.00
16 −1 −1 1 −1 91.85
17 1 1 1 1 96.70
18 0 0 2 0 91.42
19 0 0 0 −2 84.00
20 1 1 −1 1 96.50
21 0 0 0 0 91.30
22 1 −1 −1 −1 89.00
23 0 0 0 0 92.13
24 1 −1 −1 1 76.00
25 −1 1 1 −1 90.40
26 0 0 0 2 94.67
27 0 2 0 0 90.36
28 1 −1 1 1 73.00
29 −1 1 1 1 96.00
30 1 1 1 −1 92.00
31 0 0 0 0 91.36
Table 3. Estimated regression coefficient of COD removal Designate Coefficients Standard error of
coefficients t-value p Constant 0.915743 0.011783 77.717 0.000
X1 −0.024033 0.006364 −3.777 0.002
X2 0.030608 0.006364 4.810 0.000
X3 0.003667 0.006364 0.576 0.572
X4 0.009083 0.006364 1.427 0.173
X1*X1 −0.001952 0.005830 −0.335 0.742 X2*X2 −0.009002 0.005830 −1.544 0.142 X3*X3 −0.005177 0.005830 −0.888 0.388 X4*X4 −0.006115 0.005830 −1.049 0.310 X1*X2 0.031775 0.007794 4.077 0.001 X1*X3 −0.014212 0.007794 −1.824 0.087 X1*X4 −0.012025 0.007794 −1.543 0.142 X2*X3 0.003600 0.007794 0.462 0.650 X2*X4 0.024787 0.007794 3.180 0.006 X3*X4 0.007775 0.007794 0.998 0.333
Table 4. The results of variance analysis for COD removal Source Degree of
freedom
Sum of squares
Adjusted
mean squaresF-value p Regression 14 0.074848 0.005346 5.50 0.001 Interaction 6 0.032705 0.005451 5.61 0.003 Residual error 16 0.015550 0.000972 132.31 0.000 Lack-of-fit 10 0.015480 0.001548
Pure error 6 0.000070 0.000012
Total 30 0.090398
Figure 2. Response surface plots of the interaction between tem- perature and initial concentration of oily wastewater on COD removal.
ature, initial concentration of oily wastewater, reaction time, HE. In each plot, two factors are varied, while the rest is kept constant.
For Fig. 2, it is shown that temperature and initial con- centration have obvious effects on COD removal. When temperature is closed to 330oC and initial concentration of oily wastewater is about 1000 mg/L, COD removal is about 70%. However, temperature is closed to 250oC and initial concentration of oily wastewater is about 5000 mg/L, COD removal is above 90%. For Fig. 3, it is shown that higher HE is, more obvious COD removal is. When HE is closed to 0.8, COD removal is about 93%. Effect of reac- tion time on COD removal changes little. For Fig. 4, it is seen that there is strong interaction between initial con- centration of oily wastewater and HE. When HE increases, COD removal increases. However, COD removal reduces when initial concentration of oily wastewater increases.
For Fig. 5, it is shown that COD removal increases when initial concentration of oily wastewater and reaction time
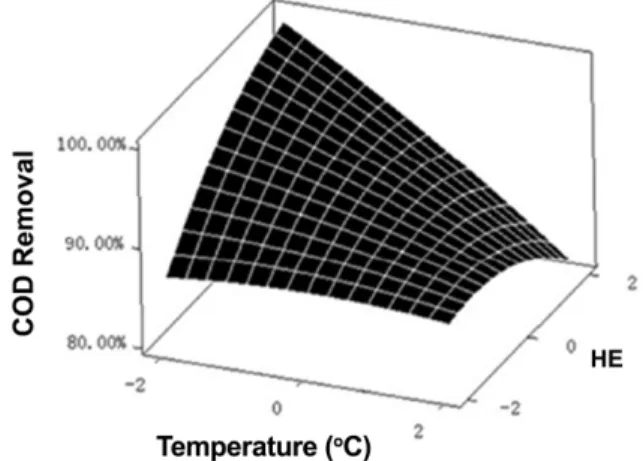
both increase. Increased range of reaction time on COD removal is not very obvious. For Fig. 6, it is seen that there is strong interaction between temperature and HE. HE plays the main role in COD removal when temperature changes little. For Fig. 7, it is shown that there is interaction between temperature and reaction time. Increased range of reac- tion time on COD removal is not very obvious.
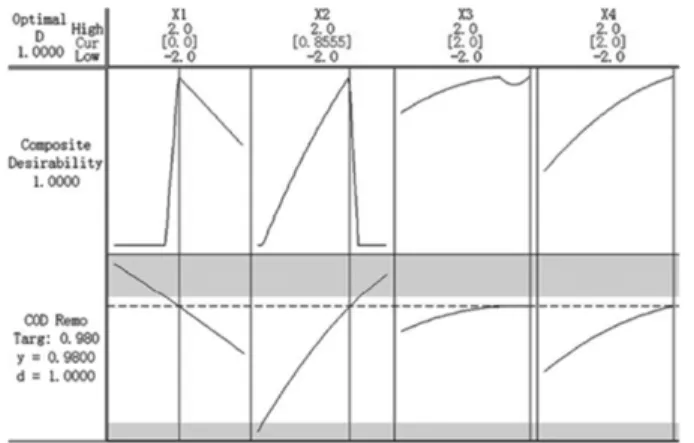
Optimization of Process Parameters Using RSM Objective function of Minitab’s response surface pro- vides an intuitive tool for objective optimization and its unique response optimizer is a powerful tool for multi- objective problem to the solution encountered in the experimental design. And the target function is optimized by Minitab’s response optimizer. The result is shown in Fig. 8. It is calculated that the optimized conditions are that temperature is 290oC, HE is 0.8, the initial concen- Figure 3. Response surface plots of the interaction between reac-
tion time and HE on COD removal.
Figure 4. Response surface plots of the interaction between initial concentration of oily wastewater and HE on COD removal.
Figure 5. Response surface plots of the interaction between ini- tial concentration of oily wastewater and reaction time on COD removal.
Figure 6. Response surface plots of the interaction between tem- perature and HE on COD removal.
tration of oily wastewater is 3855 mg/L and reaction time is 9 min.
CONCLUSIONS
This study demonstrates that the WPO process is effec- tive in reducing COD by 96.8%. Therefore, the WPO pro- cess is possibly suitable for a primary treatment for oily wastewater. Central composite design provides suffi- cient data to fit the quadratic models for COD removals.
The optimization of the models provides the optimum conditions: temperature is 290oC, HE is 0.8, the initial concentration of oily wastewater is 3855 mg/L and reac- tion time is 9 min. RSM could be effectively adopted to optimize the operating multifactor in complex WPO process.
Acknowledgments. This work was supported by Hubei Provincial Department of Education “Evaluation of textile fiber dust explosion performance and explosion danger grade” (D20121706), (T201207). Young and Mid-aged Sci- entific and Technical Innovation Team of Colleges and Universities in Hubei (ID: T201207). And the publication cost of this paper was supported by the Korean Chemical Society.
REFERENCES
1. Kong, J.; Li, K. Sep. Purif. Technol. 1999, 16, 83.
2. Noshadi, I.; Salahi, A.; Hemmati, M.; Rekabdar, F.; Moham- madi, T. Asia-Pacific J. Chem. Eng. 2013, 8, 527.
3. Salahi, A.; Mohammadi, T.; Nikbakht, M.; Golshenas, M.;
Noshadi, I. Desalin. Water Treat. 2012, 48, 27.
4. Oatley, L. D.; Cassey, B.; Jones, P.; Bowen, W. R. Chem.
Eng. Sci. 2005, 60, 1953.
5. Salahi, A.; Mohammadi, T. Water Sci. Technol. 2010, 62, 245.
6. Sarkar, D.; Datta, D.; Sen, D.; Bhattacharjee, C. Chem.
Eng. Sci. 2011, 66, 2554.
7. Wake, H. Estuarine Coast. Shelf. Sci. 2005, 62, 131.
8. Rezvanpour, A.; Roostaazad, R.; Hesampour, M.; Nyström, M.; Ghotbi, C. J. Hazard. Mater. 2009, 16, 1216.
9. Glaze, W. H.; Kang, J. W.; Chapin, D. H. Ozone-Sci. Eng.
1987, 9, 335.
10. García-Molina, V.; López-Arias, M.; Florczyk, M.; Chamarro, E.; Esplugas, S. Water Res. 2005, 39, 795.
11. Lopes, R. J. G.; Perdigoto, M. L. N.; Quinta-Ferreira, R.
M. Appl. Catal., B 2012, 292, 117–118.
12. Domínguez, C. M.; Ocón, P.; Quintanilla, A.; Casas, J. A.;
Rodriguez, J. J. Appl. Catal., B 2013, 663, 140–141.
13. Galeano, L. A.; Vicente, M. Á.; Gil A. Chem. Eng. J. 2011, 178, 146−153.
14. García-Molina, V.; López-Arias, M.; Florczyk, M.; Chamarro, E.; Esplugas, S. Water Res. 2005, 39, 795.
15. Ribeiro, R. S.; Fathy, N. A.; Attia, A. A.; Silva, A. M. T.;
Faria, J. L.; Gomes, H. T. Chem. Eng. J. 2012, 112, 195–196.
16. Muhamad, M. H.; Abdullah, S. R. S.; Mohamad, A. B.;
Rahman, R. A.; Kadhum, A. A. H. J. Environ. Manage. 2013, 121, 179.
17. Li, J.; Peng, J. H.; Guo, S. H.; Zhang, L. B. J. Alloys Compd.
2013, 574, 504.
18. Hazime, R.; Nguyen, Q. H.; Ferronato, C.; Huynh, T. K.
X.; Jaber, F.; Chovelon, J. M. Appl. Catal., B 2013, 519, 132–133.
19. Noshadi, I.; Amin, N. A. S.; Parnas, R. S. Fuel 2012, 94, 156.
20. Zhao, X. H.; Jiang, R.; Zu, Y. G.; Wang, Y.; Zhao, Q.; Zu, B. S.; Zhao, D. M.; Wang, M. X.; Sun, Z. Q. Appl. Surf.
Sci. 2012, 258, 2000.
Figure 7. Response surface plots of the interaction between tem- perature and reaction time on COD removal.
Figure 8. The optimized result for COD removal by response optimizer.