J Korean Soc Radiol 2015;73(6):357-366 http://dx.doi.org/10.3348/jksr.2015.73.6.357
INTRODUCTION
Lung adenocarcinoma is the most common histological sub- type of lung cancer worldwide, accounting for almost half of all lung cancers (1). Recently, the International Association for the Study of Lung Cancer, American Thoracic Society, and Europe- an Respiratory Society introduced a new classification for lung adenocarcinoma (1). The term bronchioloaveolar carcinoma should no longer be used for pure ground-glass nodule (GGN) or part-solid GGN with a predominant ground-glass opacity
(GGO) component found on computed tomography (CT).
These tumors are classified under the new terms of adenocarci- noma in situ (AIS), minimally invasive adenocarcinoma (MIA), lepidic predominant invasive adenocarcinoma (LPA), other subtype predominant adenocarcinoma having lepidic compo- nent and invasive mucinous adenocarcinoma (2).
Of special interest to thoracic surgeons are the new categories AIS and MIA, which are small (< 3 cm), solitary adenocarcino- mas of purely lepidic growth without invasion for AIS or < 0.5 cm invasion for MIA. This conceptual change was because AIS
Ground-Glass Nodule on Thin-Section CT: Differentiation among Adenocarcinoma In Situ, Minimally Invasive Adenocarcinoma and Lepidic Predominant Invasive Adenocarcinoma
세절편 전산화단층촬영에서의 젖빛유리음영 결절 중 폐의 제자리선암종, 최소 침습선암종, 비늘 모양 중심의 침습선암종의 감별
Man Ho Lee, MD
1, Dae Shick Ryu, MD
1*, Do Young Kim, MD
1, Jae Hong Ahn, MD
1, Soo Jung Choi, MD
1, Gil Hyeon Gang, MD
2, Dong Gon Yoo, MD
3, Dong Rock Shin, MD
1Departments of 1Radiology, 2Pathology, 3Thoracic and Cardiovascular Surgery, Gangneung Asan Hospital, College of Medicine, University of Ulsan, Gangneung, Korea
Purpose: To investigate different computed tomography (CT) features among ade- nocarcinoma in situ (AIS), minimally invasive adenocarcinoma (MIA), and lepidic predominant invasive adenocarcinoma (LPA) that appeared as ground-glass nodules (GGN). We also analyzed different CT findings between Group A (AIS and MIA) and Group B (LPA).
Materials and Methods: We evaluated 19 AIS, 4 MIA, and 9 LPA images that were histologically confirmed and manifested as GGN on thin-section CT scans. CT scans were assessed for lesion characteristics: size, shape, solid portion, internal air densi- ty, marginal irregularity and pleural tag. CT findings of Group A and Group B were analyzed using the Kruskal-Wallis test or Fisher’s exact test.
Results: A significant statistical difference was seen between AIS and LPA for lesion characteristics (p < 0.05). No significant difference was observed between AIS and MIA. Round or polygonal shape with smooth margin was significantly associated with Group A, and complex shape with marginal irregularity was associated with Group B.
Conclusion: Group A (AIS and MIA) could be distinguished from Group B (LPA) by smaller lesion size, round or polygonal shape, smaller solid portion and smooth margin.
Index terms Lung Neoplasm Ground-Glass Nodule Computed Tomography
Received May 12, 2015 Revised June 13, 2015 Accepted August 5, 2015
*Corresponding author: Dae Shick Ryu, MD
Department of Radiology, Gangneung Asan Hospital, Col- lege of Medicine, University of Ulsan, 38 Bangdong-gil, Gangneung 25440, Korea.
Tel. 82-33-610-3483 Fax. 82-33-610-3111 E-mail: [email protected]
This is an Open Access article distributed under the terms of the Creative Commons Attribution Non-Commercial License (http://creativecommons.org/licenses/by-nc/3.0) which permits unrestricted non-commercial use, distri- bution, and reproduction in any medium, provided the original work is properly cited.
has 100% disease-free survival, and MIA has near 100% dis- ease-free survival with proper surgical intervention (3-6). Lim- ited resection can be an appropriate option for AIS and MIA, but the results of prospective trials are needed to determine the precise incidence of local recurrence (6). Therefore, if we can accurately diagnose AIS, MIA, and LPA through imaging prior to surgery, we might be able to select patients who are suitable for sublobar resection.
CT features of AIS, MIA, and LPA containing lepidic compo- nents are reported to be pure or part-solid GGN. Recently, Lee et al. (7) reported differentiation using CT features between in- vasive pulmonary adenocarcinoma, including lepidic and non- lepidic growth and preinvasive lesions (AIS, atypical adenoma- tous hyperplasia) appearing as GGN. To our knowledge, no studies have attempted to differentiate CT features among AIS, MIA and LPA. Therefore, the purpose of our study was to ret- rospectively investigate the CT features that differentiate among AIS, MIA and LPA that appeared as GGN in 32 patients.
MATERIALS AND METHODS
This retrospective study was approved by the Institutional Review Board of Gangneung Asan Hospital, which waived the requirement for informed consent from patients.
Patients
Between November 2006 and April 2013, AIS was pathologi- cally confirmed in 19 patients at our institution, with 18 patients receiving video-assisted thoracic surgery (VATS). One patient had a lobectomy without biopsy because of the central location of the nodule in the lung. MIA was pathologically proven in 4 patients with wedge resection by VATS (n = 3) and lobectomy (n = 1). LPA was pathologically proven in 9 patients with direct lobectomy (n = 5) and lobectomy after wedge resection by VATS (n = 4).
Clinical Features of the Patients
We reviewed the patients’ medical records at our hospital.
The patients’ recorded clinical features of patients were: age, multiplicity, smoking history, and past history of diseases in- cluding any malignancies. Two patients had multiple lesions:
one patient with breast cancer showed AIS in the right middle
lobe with a similar lesion in the left lower lobe on CT scans, and one patient with colon cancer showed LPA in the right up- per lobe with two similar lesions in the left upper and left lower lobes on CT scans. Only the largest GGN was pathologically confirmed in the case that had multiple GGN. Other smaller GGN were not included in the material.
CT Scanning
In all individuals, a thin-section CT (GE Medical System, Mil- waukee, WI, USA) was performed once during follow-up. Scan- ning parameters were 120 kVp and 400 mAs, pitch 0.87, and collimation 1.25 mm. Images were reconstructed with 1.25–2.5 mm thickness. Before surgery, each patient underwent chest CT examination. All patients except 5 LPA patients received fol- low-up chest CT. The interval between the initial CT scan and the last scan before surgery was an average of 548 days for AIS, 507 days for MIA, and 488 days for LPA. When multiple CT scans were available for CT morphological analysis, we selected the last scan before surgery or biopsy. The mean interval be- tween CT and surgery or biopsy was 19.0 days (range, 1–87 days;
median 12 days).
Analysis of CT Features and Pathology
One radiologist (D.S.R.) and two radiology residents (D.Y.K.
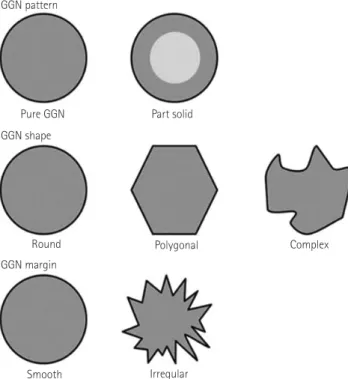
and M.H.L.) analyzed all CT images using the lung setting [window level of -700 Hounsfield units (HU) and a width 1500 HU]. Discrepancies were resolved by consensus. Recorded CT findings for each lesion were: 1) location of the lesion (central vs. subpleural), 2) Involved lobe, 3) shape (round, polygonal, and complex), 4) size, and 5) CT morphology as: (1) pure GGN vs.
part-solid GGN, (2) margin (smooth vs. irregularity), (3) pleu- ral tag, (4) internal air density, (5) any change in lesion on fol- low-up CT scans (Fig. 1) (8).
Subpleural location of the lesion was defined as the outer third of the lung. Pure GGN was defined as hazy opacity that did not obscure underlying pulmonary vessels (6). Pleural tag was de- fined as a linear strand that originated at the nodule surface and terminated at the pleural surface. Internal air density included pseudocavitation, bubble lucency and air bronchogram.
We measured the size of the solid portion of part-solid GGN as the maximum dimension of the solid component of the lung windows excluding GGO. We graded the area of the solid por-
tion of part-solid GGN on thin-section CT scans with a two- point scale: Grade 1 was a solid portion ≤ 5 mm (Fig. 2A), and Grade 2 was > 5 mm (Fig. 2B).
Lesions were microscopically evaluated by conventional he- matoxylin-eosin staining. Cases were diagnosed using the Inter- national Association for the Study of Lung Cancer, American Thoracic Society, and European Respiratory Society classifica- tions from 2011. Pathological sections of each resected lesion were compared with corresponding CT images. Comparisons were performed via consensus between a pathologist (G.H.G.) and a radiologist (D.S.R.).
Statistical Analysis
Statistical analyses were performed with SAS software (ver- sion 9.13; SAS Institute, Cary, NC, USA). Patient demographics (age, GGN multiplicity, presence of smoking history, and prior history of other malignancy) were compared among AIS, MIA, and LPA using Fisher’s exact test. Ages were compared using the Kruskal-Wallis test.
Morphological features regarding nodule size were compared among AIS, MIA, and LPA using the Kruskal-Wallis test. Shape, marginal characteristics, pleural tag, internal air density, and part-solid status were compared among AIS, MIA, and LPA us- ing Fisher’s exact test. A p value of less than 0.05 was considered to indicate a significant difference.
RESULTS
Clinical Features of Patients
The clinical backgrounds of the 32 patients are shown in Ta- ble 1. The 32 patients were 18 men and 14 women, aged 36 to 81 years (mean: 63.7 years), with 13 patients who were non-smok- ers and 13 with a history of previous cancer (40.6%). Two pa- tients had multiple GGN.
GGN pattern
Part solid
Polygonal
Irregular
Complex Pure GGN
GGN shape
Round GGN margin
Smooth
Fig. 1. The classification of ground-glass nodule (GGN): two GGN pat- terns, three GGN shapes and two GGN margins.
Fig. 2. Grade of part-solid ground-glass nodule.
A. Grade 1 was a solid portion ≤ 5 mm.
B. Grade 2 was a solid portion > 5 mm.
A B
Table 1. Patient Demographics
Characteristics of Patients (n = 32)
Age* 63.75 ± 10.20
Multiplicity 2/32 (6.3)
Smoking history 19/32 (59.3)
Cancer history 13/32 (40.6)
Follow-up period (day)* 526.31 ± 519.26
Number of performed CT scans* 3.16 ± 1.55 Numbers in parentheses are percentages.
*Data are mean ± standard deviation.
Table 2. CT Findings of Patients: Nodule Location
Nodule Location No. of Nodules (n = 32)
LLL 7 (21.9)
LUL 3 (9.4)
RLL 5 (15.6)
RML 3 (9.4)
RUL 14 (43.8)
Subpleural location 29 (90.6)
Wedge resection:lobectomy 25:7
Data are numbers of nodules, and numbers in parentheses are percentages.
LLL = left lower lobe, LUL = left upper lobe, RLL = right lower lobe, RML = right middle lobe, RUL = right upper lobe
Fig. 3. A 70-year-old woman with adenocarcinoma in situ.
A. Initial transverse 1.2 mm thin-section CT scan shows 6 mm pure ground-glass nodule (GGN) with round shape and smooth margin in the left upper lobe.
B. Serial transverse 1.2 mm thin-section CT scan after 10 months shows slow-growing pure GGN measuring 7.3 mm with round shape and smooth margin in the left upper lobe.
C. Photomicrograph (hematoxylin and eosin stain; magnification, × 1) shows round shaped tumor (arrows) of uniform cuboid cell proliferation in- volving alveolar walls.
A B C
Fig. 4. A 60-year-old woman with minimal invasive adenocarcinoma.
A. Initial transverse 1.2 mm thin-section CT scan shows 9 mm pure ground-glass nodule (GGN) with round shape and smooth margin in the right upper lobe.
B. Serial transverse 1.2 mm thin-section CT scan after 33 months shows slow-growing pure GGN 15 mm with round shape and smooth margin.
C. Photomicrograph (hematoxylin and eosin stain; magnification, × 1) demonstrates minimally invasive adenocarcinoma non-mucinous type with a round homogeneous nodule (arrows).
A B C
CT Findings of Patients
Lesion location was a subpleural portion of the lung (n = 29, 90.6%) in all 32 patients. Upper lobes (53.2%) were involved in
17 patients, especially the right upper lobe (43.8%) (Table 2).
No significant differences were seen between AIS (Fig. 3) and MIA (Fig. 4) in shape, marginal irregularity, pleural tag, inter- Table 3. Comparison of CT Morphology between AIS and MIA
AIS (n = 19) MIA (n = 4) p-Value Nodule size (mm)* 10.84 ± 3.96 14.00 ± 2.16 0.072†
Shape 0.051‡
Round 12/19 (63.2) 1/4 (25.0)
Polygonal 1/19 (5.3) 2/4 (50.0)
Complex 6/19 (31.6) 1/4 (25.0)
Characteristics
Part-solid portion 3/19 (15.8) 2/4 (50.0) 0.194‡ Internal air density 3/19 (15.8) 0/4 (0.0) 1.000‡ Marginal irregularity 7/19 (36.8) 1/4 (25.0) 1.000‡
Pleural tag 3/19 (15.8) 1/4 (25.0) 0.562‡
Interval growth 5/19 (26.3) 2/4 (50.0) 0.557‡ Except where indicated, data are numbers of nodules, and numbers in pa- rentheses are percentages.
*Data are mean ± standard deviation.
†Kruskal-Wallis test.
‡Fisher exact test.
AIS = adenocarcinoma in situ, MIA = minimal invasive adenocarcinoma
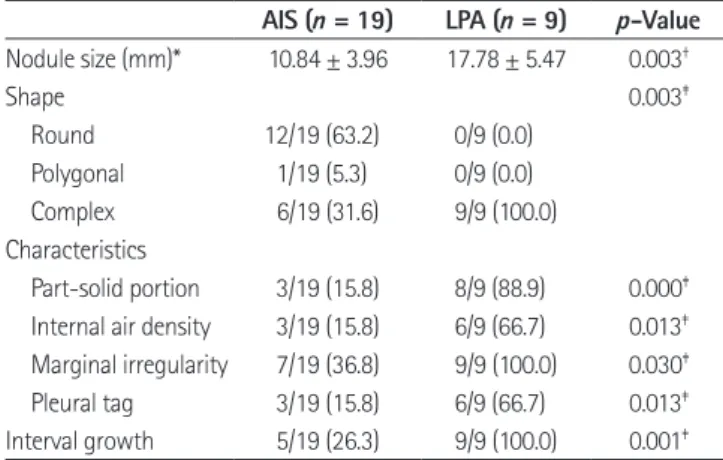
Table 4. Comparison of CT Morphology between AIS and LPA AIS (n = 19) LPA (n = 9) p-Value Nodule size (mm)* 10.84 ± 3.96 17.78 ± 5.47 0.003†
Shape 0.003‡
Round 12/19 (63.2) 0/9 (0.0)
Polygonal 1/19 (5.3) 0/9 (0.0)
Complex 6/19 (31.6) 9/9 (100.0)
Characteristics
Part-solid portion 3/19 (15.8) 8/9 (88.9) 0.000‡ Internal air density 3/19 (15.8) 6/9 (66.7) 0.013‡ Marginal irregularity 7/19 (36.8) 9/9 (100.0) 0.030‡
Pleural tag 3/19 (15.8) 6/9 (66.7) 0.013‡
Interval growth 5/19 (26.3) 9/9 (100.0) 0.001‡ Except where indicated, data are numbers of nodules, and numbers in pa- rentheses are percentages.
*Data are mean ± standard deviation.
†Kruskal-Wallis test.
‡Fisher exact test.
AIS = adenocarcinoma in situ, LPA = lepidic predominant invasive adeno- carcinoma
Fig. 5. A 61-year-old man with lepidic predominant invasive adenocarcinoma (LPA).
A. Initial transverse 1.2 mm thin-section CT scan shows 12 mm pure ground-glass nodule (GGN) with polygonal shape and smooth margin in the right middle lobe.
B. Serial transverse 1.2 mm thin-section CT scan after 30 months shows GGN increased in size. The lesion shows complex shape with marginal irregularity, pleural tag, and increased attenuation, suggesting a part-solid nodule (colored area). The solid portion measured 8 mm, Grade 2.
C. Photomicrograph (hematoxylin and eosin stain; magnification, × 1) of LPA non-mucinous type with complex shape and marginal irregularity (arrows).
A B C
nal air density, lesion size or solid portion (Table 3).
Significant differences were seen in lesion size, shape, solid portion, internal air density, marginal irregularity, and pleural
tag (p < 0.05) (Table 4) between AIS (Fig. 3) and LPA (Figs. 5, 6).
Complex shape and marginal irregularity were significantly different between MIA and LPA (Table 5).
Fig. 6. A 56-year-old man with lepidic predominant invasive adenocarcinoma (LPA).
A. Initial transverse 2.5 mm thin-section CT scan shows 14 mm pure ground-glass nodule (GGN) with complex shape and marginal irregularity in the left lower lobe with no interval change after a 12-month follow-up CT.
B. Photomicrograph (hematoxylin and eosin stain; magnification, × 1) demonstrates LPA non-mucinous type with complex shaped nodule (ar- rows) and 7 mm stromal invasion (arrows).
A B
Table 5. Comparison of CT Morphology between MIA and LPA MIA (n = 4) LPA (n = 9) p-Value Nodule size (mm)* 14.00 ± 2.16 17.78 ± 5.47 0.121†
Shape 0.012‡
Round 1/4 (25.0) 0/9 (0.0)
Polygonal 2/4 (50.0) 0/9 (0.0)
Complex 1/4 (25.0) 9/9 (100.0)
Characteristics
Part-solid portion 2/4 (50.0) 8/9 (88.9) 0.203‡ Internal air density 0/4 (0.0) 6/9 (66.7) 0.700‡ Marginal irregularity 1/4 (25.0) 9/9 (100.0) 0.014‡
Pleural tag 1/4 (25.0) 6/9 (66.7) 0.266‡
Interval growth 2/4 (50.0) 9/9 (100.0) 0.077‡ Except where indicated, data are numbers of nodules, and numbers in pa- rentheses are percentages.
*Data are mean ± standard deviation.
†Kruskal-Wallis test.
‡Fisher exact test.
LPA = lepidic predominant invasive adenocarcinoma, MIA = minimal inva- sive adenocarcinoma
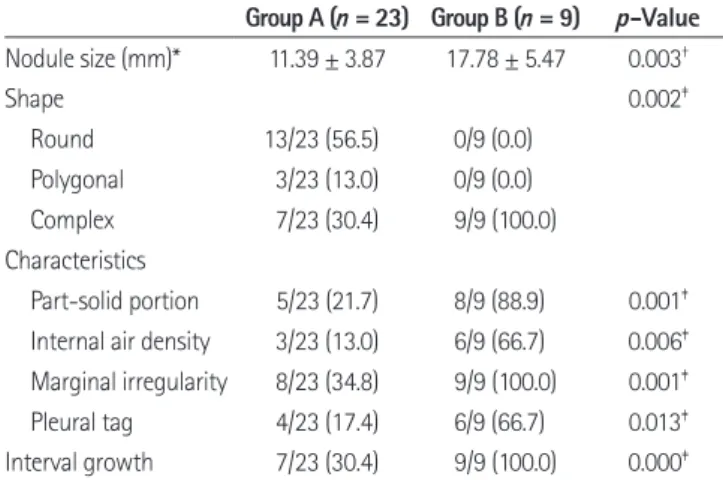
Table 6. Comparison of CT Morphology between a Group A and Group B Group A (n = 23) Group B (n = 9) p-Value Nodule size (mm)* 11.39 ± 3.87 17.78 ± 5.47 0.003†
Shape 0.002‡
Round 13/23 (56.5) 0/9 (0.0)
Polygonal 3/23 (13.0) 0/9 (0.0)
Complex 7/23 (30.4) 9/9 (100.0)
Characteristics
Part-solid portion 5/23 (21.7) 8/9 (88.9) 0.001‡ Internal air density 3/23 (13.0) 6/9 (66.7) 0.006‡ Marginal irregularity 8/23 (34.8) 9/9 (100.0) 0.001‡
Pleural tag 4/23 (17.4) 6/9 (66.7) 0.013‡
Interval growth 7/23 (30.4) 9/9 (100.0) 0.000‡ Group A = adenocarcinoma in situ and minimal invasive adenocarcinoma, Group B = lepidic predominant invasive adenocarcinoma.
Except where indicated, data are numbers of nodules, and numbers in pa- rentheses are percentages.
*Data are mean ± standard deviation.
†Kruskal-Wallis test.
‡Fisher exact test.
Comparison of CT Features in Group A and B
CT feature comparisons between Group A and B are shown in Table 6. Round or polygonal shape with smooth margin was significantly associated with Group A (Figs. 3, 4), and complex shape with marginal irregularity was associated with Group B (Figs. 5, 6). Groups A and B were significantly different in le- sion size (Fig. 7), shape, solid portion, margin and pleural tag (p
< 0.05). In Group A, 21.7% of lesions were part-solid GGN, and part-solid GGN except for mucinous AIS (Fig. 8) were classified as Grade 1. In Group B, 88.9% of lesions part-solid GGN, and all part-solid GGN were classified as Grade 2.
DISCUSSION
Van Schil et al. (6) reported that sublobar resection is gener- ally considered acceptable for GGO lesions or adenocarcino- mas with minimal invasion, so we classified AIS and MIA as Group A, suitable for sublobar resection. If we can accurately di- agnose Group A and Group B using imaging before surgery, we might be able to select patients who are suitable for sublobar re- section. Therefore, we investigated CT findings between Group
A and Group B.
The morphological CT features of a lobulated border and spiculated margin are predictive of malignant lesions in pure
30
25
20
15
10
5
0
Lesion size (mm)
Group A (mean: 11.39 ± 3.87) Group B (mean: 17.78 ± 5.47) Fig. 7. Lesion size in Group A and Group B. Mean lesion size was signifi- cantly larger in Group B than in Group A (p = 0.003). Box = 1st–3rd quar- tiles, Bold line = median, Whiskers = minimum and maximum values
Fig. 8. A 62-year-old man with mucinous adenocarcinoma in situ.
A. Initial transverse 2.5 mm thickness CT scan shows 7 mm pure ground-glass nodule (GGN) in right upper lobe.
B. Serial transverse 2.5 mm thin-section CT scan after 27 months shows persistent GGN with 90% solid portion and increased lesion size. The solid portion measured 7 mm, Grade 2.
C. Photomicrograph (hematoxylin and eosin stain; magnification, × 1) shows polygonal-shaped tumor (arrows) of uniform cuboid cell prolifera- tion involving alveolar walls with much stromal fibrosis.
A B C
GGN and part-solid GGN (9). A lobulated border in solid pul- monary nodules is associated with an increased probability of malignancy (10). Histologically, tumor margins can become lobulated, or scalloped pulling forces can originate from the des- moplastic reaction in lung cancer, directed towards tumor cen- ters. Fibroblastic stromal invasion is a characteristic histological feature of adenocarcinoma (11) and could be the cause of the lobulated border of malignant GGN. In our study, complex shape indicated a lobulated border, and marginal irregularity indicated a spiculated margin. Complex border and marginal ir- regularity were the most important CT findings in Group B.
Larger pulmonary nodules are more likely to be malignant than smaller nodules (12). The solid component of GGN usually represents areas of fibroblastic proliferation or invasive tumor components (10). Considering two previous studies (12, 13), smaller GGN with smaller solid portions might have a higher probability of being AIS or MIA. In Group B, 88.9% of lesions were part-solid GGN, and in 5 of these patients (63%) more than 5 mm of the solid portion of GGN was considered Grade 2. The size of GGN in Group B was a mean of 17.78 mm, ranging from 12 mm to 26 mm. The size of GGN in Group A (n = 23) was a mean of 11.39 mm, ranging from 7 mm to 22 mm. In Group A, 21.7% (n = 5) of lesions were part-solid nodules and consisted of non-mucinous type (n = 4) and mucinous type (n = 1). In Group A, non-mucinous part-solid GGN (n = 4) had equal to or less than 5 mm solid portion of GGN as Grade 1. Group B was differentiated from Group A by larger lesion size (Fig. 7).
One mucinous AIS case had more than 50% solid portion in spite of a small size of 7 mm because there was a great deal of stromal fibrosis without invasion on pathologic specimen (Fig.
8). Lee et al. (2) described a rare case of mucinous MIA with a part-soild GGN. Naidich et al. (14) reported that a rapid trans- formation of initial pure GGN to a predominantly part-solid GGN was mucinous adenocarcinoma. Therefore, we suggest that mucinous AIS and mucinous MIA might show different radiologic patterns compared with slow-growing, non-muci- nous AIS and non-mucinous MIA.
One case of LPA showed pure GGN with complex shape and marginal irregularity (Fig. 6). Theoretically, pure GGN on high- resolution CT (HRCT) should not have a nonaerated compo- nent because nonaerated components usually appear as focal solid portions on HRCT. However, because of the limited reso-
lution (200–300 µmm) of HRCT images, stromal or myofibro- blastic invasion of 5 mm in invasive adenocarcinoma can mani- fest as pure GGN on HRCT (15, 16). This discrepancy might have developed from partial volume averaging of relatively thick CT slices. Nakajima et al. (17) reported that 10% of pure GGN was adenocarcinoma with stromal invasion. Part-solid GGN occurred in 3 of 19 patients with AIS (15.8%). Scar tissue (fibrotic focus) without an invasive component within a pe- ripheral lung AIS occasionally presents as a solid component within a GGN on HRCT (18).
In our study of 32 patients, previous cancer history was seen in 40.6% (n = 13). Therefore, for a patient with a history of ex- trathoracic malignancy, GGN on CT suggests atypical adeno- matous hyperplasia (AAH), AIS, MIA, or LPA with lepidic growth pattern because of the rarity of pure metastatic GGN (19). Our study suggested that lepidic growth tumors might be prevalent in patients with a history of previous cancer.
The predilection of subpleural area (90.6%) and right upper lobe (43.8%) of the lesion with lepidic growth neoplasm was distinct, but the reason for this is not clear, although the most prevalent location of lung cancer is the right upper lobe, and the predilection of the upper lobe for AAH was distinct (20).
Wedge resection by VATS was performed in 91% of Group A GGN because of the subpleural lesion location.
In our study, 26% AISs, 50% MIAs, and 100% LPAs had in- terval growth that indicated growth potential. Naidich et al. (14) recommend that solitary pure GGN larger than 5 mm have an initial follow-up CT examination in 3 months to determine persistence, followed by yearly surveillance by CT for a mini- mum of 3 years if the disease is persistent and unchanged.
Our study had a number of limitations. First, the retrospec- tive design might have introduced selection bias. This study in- cluded only pathologically proven GGN, for which CT was more likely to find malignancies. Second, we retrospectively searched for patients with pulmonary GGN identified by CT using the medical records and the radiology information sys- tem at our hospital. GGN might have been unreported in origi- nal clinical readings and missed using this search method.
Third, in our study, CT morphological assessment for differen- tiating AIS and MIA from LPA was made by the consensus of three observers (one chest radiologist and two radiology resi- dents), and we did not analyze differentiating CT features based
on each observer’s assessment. Fourth, in GGN assessment, ob- taining CT with a section thickness of 1.0–1.5 mm or less is es- sential (9). However, in our study, CT images with a section thickness of 2.5 mm were included. Fifth, multivariate analysis could not be performed because of the small number of cases.
In conclusion, round or polygonal shape indicated Group A.
No significant difference between AIS and MIA was observed.
In Group A with part-solid GGN, except for mucinous AIS, maximum diameter of the solid component excluding GGO was equal to or less than 5 mm. Group A could be distinguished from Group B by smaller lesion size, round or polygonal shape, smaller solid portion, and smooth margin.
REFERENCES
1. Travis WD, Brambilla E, Noguchi M, Nicholson AG, Geisinger KR, Yatabe Y, et al. International association for the study of lung cancer/american thoracic society/european respira- tory society international multidisciplinary classification of lung adenocarcinoma. J Thorac Oncol 2011;6:244-285 2. Lee HJ, Lee CH, Jeong YJ, Chung DH, Goo JM, Park CM, et
al. IASLC/ATS/ERS International Multidisciplinary Classifi- cation of Lung Adenocarcinoma: novel concepts and ra- diologic implications. J Thorac Imaging 2012;27:340-353 3. Koike T, Togashi K, Shirato T, Sato S, Hirahara H, Sugawara
M, et al. Limited resection for noninvasive bronchioloalve- olar carcinoma diagnosed by intraoperative pathologic examination. Ann Thorac Surg 2009;88:1106-1111
4. Sakurai H, Dobashi Y, Mizutani E, Matsubara H, Suzuki S, Takano K, et al. Bronchioloalveolar carcinoma of the lung 3 centimeters or less in diameter: a prognostic assessment.
Ann Thorac Surg 2004;78:1728-1733
5. Watanabe S, Watanabe T, Arai K, Kasai T, Haratake J, Uraya- ma H. Results of wedge resection for focal bronchioloalveo- lar carcinoma showing pure ground-glass attenuation on computed tomography. Ann Thorac Surg 2002;73:1071-1075 6. Van Schil PE, Asamura H, Rusch VW, Mitsudomi T, Tsuboi
M, Brambilla E, et al. Surgical implications of the new IASLC/ATS/ERS adenocarcinoma classification. Eur Respir J 2012;39:478-486
7. Lee SM, Park CM, Goo JM, Lee HJ, Wi JY, Kang CH. Invasive pulmonary adenocarcinomas versus preinvasive lesions
appearing as ground-glass nodules: differentiation by us- ing CT features. Radiology 2013;268:265-273
8. Li F, Sone S, Abe H, Macmahon H, Doi K. Malignant versus benign nodules at CT screening for lung cancer: comparison of thin-section CT findings. Radiology 2004;233:793-798 9. Lee HJ, Goo JM, Lee CH, Park CM, Kim KG, Park EA, et al.
Predictive CT findings of malignancy in ground-glass nod- ules on thin-section chest CT: the effects on radiologist performance. Eur Radiol 2009;19:552-560
10. Ost D, Fein AM, Feinsilver SH. Clinical practice. The solitary pulmonary nodule. N Engl J Med 2003;348:2535-2542 11. Colby TV, Noguchi M, Henschke C, Vazquenz MF, Geisinger
K, Yokose T, et al. Adenocarinoma. In Travis WD, Brambilla E, Muller-Hermelink HK, Harris CC. World Health Organization Classification of Tumours: Pathology and Genetics, Tu- mours of the Lung, Pleura, Thymus and Heart. Lyon: IARC Press, 2003:35-44
12. Goo JM, Park CM, Lee HJ. Ground-glass nodules on chest CT as imaging biomarkers in the management of lung ad- enocarcinoma. AJR Am J Roentgenol 2011;196:533-543 13. Park CM, Goo JM, Lee HJ, Lee CH, Chun EJ, Im JG. Nodular
ground-glass opacity at thin-section CT: histologic correla- tion and evaluation of change at follow-up. Radiographics 2007;27:391-408
14. Naidich DP, Bankier AA, MacMahon H, Schaefer-Prokop CM, Pistolesi M, Goo JM, et al. Recommendations for the management of subsolid pulmonary nodules detected at CT: a statement from the Fleischner Society. Radiology 2013;266:304-317
15. Lim HJ, Ahn S, Lee KS, Han J, Shim YM, Woo S, et al. Per- sistent pure ground-glass opacity lung nodules ≥ 10 mm in diameter at CT scan: histopathologic comparisons and prognostic implications. Chest 2013;144:1291-1299 16. Lee HJ, Goo JM, Lee CH, Yoo CG, Kim YT, Im JG. Nodular
ground-glass opacities on thin-section CT: size change during follow-up and pathological results. Korean J Radiol 2007;8:22-31
17. Nakajima R, Yokose T, Kakinuma R, Nagai K, Nishiwaki Y, Ochiai A. Localized pure ground-glass opacity on high- resolution CT: histologic characteristics. J Comput Assist Tomogr 2002;26:323-329
18. Lee HY, Choi YL, Lee KS, Han J, Zo JI, Shim YM, et al. Pure
ground-glass opacity neoplastic lung nodules: histopa- thology, imaging, and management. AJR Am J Roentgenol 2014;202:W224-W233
19. Park CM, Goo JM, Kim TJ, Lee HJ, Lee KW, Lee CH, et al. Pul- monary nodular ground-glass opacities in patients with ex- trapulmonary cancers: what is their clinical significance and
how can we determine whether they are malignant or be- nign lesions? Chest 2008;133:1402-1409
20. Park CM, Goo JM, Lee HJ, Lee CH, Kim HC, Chung DH, et al. CT findings of atypical adenomatous hyperplasia in the lung. Korean J Radiol 2006;7:80-86
세절편 전산화단층촬영에서의 젖빛유리음영 결절 중 폐의 제자리선암종, 최소 침습선암종, 비늘 모양 중심의 침습선암종의 감별
이만호
1· 류대식
1* · 김도영
1· 안재홍
1· 최수정
1· 강길현
2· 유동곤
3· 신동락
1목적: 전산화단층촬영 영상에서 젖빛유리음영 결절로 보이는 폐의 제자리선암종(adenocarcinoma in situ), 최소 침습선 암종(minimally invasive adenocarcinoma), 비늘 모양 중심의 침습선암종(lepidic predominant invasive adenocarcinoma) 차이를 알아보고자 하였다. 또한 그룹 A (제자리선암종과 최소 침습선암종)와 그룹 B (비늘 모양 중심의 침습선암종)의 전산화단층촬영 소견의 차이에 대해서 분석하였다.
대상과 방법: 조직학적으로 확진된 19개의 제자리선암종, 4개의 최소 침습선암종, 9개의 비늘 모양 중심의 침습선암종 에 대하여 조사하였다. 전산화단층촬영된 병변의 특징(크기, 모양, 고형 부분, 내부 공기 음영, 불규칙한 경계 및 흉막 꼬 리)에 대하여 분석하였다. 그룹 A와 그룹 B의 전산화단층촬영 소견의 감별을 알기 위하여 Kruskal-Wallis test 또는 Fish- er’s exact test를 이용하여 분석하였다.
결과: 제자리선암종과 비늘 모양 중심의 침습선암종은 병변의 특징에 있어서 유의한 통계학적 차이를 보였다. 부드러운 경계의 구형 또는 다각형 모양은 그룹 A와 관계가 있었고 불규칙한 경계를 가진 복합 모양은 그룹 B와 관계가 있었다.
결론: 그룹 A (제자리선암종과 최소 침습선암종)는 작은 병변 크기, 구형 또는 다각형 모양, 적은 고형 부분, 부드러운 경 계로 그룹 B (비늘 모양 중심의 침습선암종)와 구분될 수 있다.
울산대학교 의과대학 강릉아산병원 1영상의학과, 2병리과, 3흉부외과