Prevalence of Chronic Kidney Disease in Korea: the Korean National Health and Nutritional Examination Survey 2011-2013
Chronic kidney disease is a leading public health problem related to poor quality of life and premature death. As a resource for evidence-informed health policy-making, we evaluated the prevalence of chronic kidney disease using the data of non-institutionalized adults aged ≥ 20 years (n = 15,319) from the Korean National Health and Nutrition Examination Survey in 2011-2013. Chronic kidney disease was defined as a urine albumin-to-creatinine ratio ≥ 30 mg/g or an estimated glomerular filtration rate < 60 mL/min/1.73 m2 using the Chronic Kidney Disease-Epidemiology Collaboration equation. The total prevalence estimate of chronic kidney disease for adults aged ≥ 20 years in Korea was 8.2%. By disease stage, the prevalence of chronic kidney disease was as follows: stage 1, 3.0%;
stage 2, 2.7%; stage 3a, 1.9%; stage 3b, 0.4%; and stages 4-5, 0.2%. When grouped into three risk categories according to the 2012 Kidney Disease: Improving Global
Outcomes guidelines, the proportions for the moderately increased risk, high risk, and very high risk categories were 6.5%, 1.2%, and 0.5%, respectively. Factors including older age, diabetes, hypertension, cardiovascular disease, body mass indexes of ≥ 25 kg/m2 and
< 18.5 kg/m2, and rural residential area were independently associated with chronic kidney disease. Based on this comprehensive analysis, evidence-based screening strategies for chronic kidney disease in the Korean population should be developed to optimize prevention and early intervention of chronic kidney disease and its associated risk factors.
Keywords: Renal Insufficiency, Chronic; Prevalence; Republic of Korea; Albuminuria;
Glomerular Filtration Rate Ji In Park,* Hyunjeong Baek,*
and Hae Hyuk Jung
Division of Nephrology, Department of Medicine, Kangwon National University Hospital, Kangwon National University School of Medicine, Chuncheon, Korea
* Ji In Park and Hyunjeong Baek contributed equally to this work.
Received: 25 November 2015 Accepted: 10 March 2016 Address for Correspondence:
Hae Hyuk Jung, MD
Division of Nephrology, Department of Medicine, Kangwon National University Hospital, Kangwon National University School of Medicine, 156 Baekryeong-ro, Chuncheon 24289, Korea
E-mail: [email protected]
http://dx.doi.org/10.3346/jkms.2016.31.6.915 • J Korean Med Sci 2016; 31: 915-923
INTRODUCTION
Chronic kidney disease (CKD) is increasingly recognized as a major global health problem. CKD has been identified as a risk factor for premature death (1,2) and as a predictor of worse quality of life (3,4). The World Health Organization Global Bur- den of Disease measures the overall burden of disease using the disability-adjusted life year (5). This time-based measure combines years of life lost due to premature mortality and years of life lost due to time lived in states of less-than-full health. In the 2010 Global Burden of Disease Study, CKD was ranked as the 17th cause of disability-adjusted life year in the United States (6). Measuring the burden of disease provides a critical resource for evidence-informed health policy-making. Precise estimates of the prevalence as well as the disability weight and mortality are required to reliably quantify the cause-specific disability- adjusted life year.
A high prevalence of CKD has been reported in a number of population-based studies from different countries. The overall prevalence of CKD among 13,233 non-institutionalized adults aged ≥ 20 years in the United States was 13.1% (7). A recent study performed in China reported that the prevalence of CKD
among 47,204 adults aged ≥ 18 years was 10.8% (8). The grow- ing elderly population and increasing rate of diabetes mellitus and hypertension may contribute to the high prevalence of CKD worldwide. The prevalence of CKD in Korea has been reported as 13.7% among 2,356 urban civilians aged ≥ 35 years (9).
CKD is defined based on markers of kidney damage (most often albuminuria) and a decreased glomerular filtration rate (GFR). Most population-based studies to date have defined CKD based on the estimated glomerular filtration rate (eGFR) using the Modification of Diet in Renal Disease Study (MDRD) equation. However, the 2012 Kidney Disease: Improving Global Outcomes (KDIGO) guidelines, which was an update from the original 2002 Kidney Disease Outcomes Quality Initiative guide- lines, recommends the CKD-Epidemiology Collaboration (CKD- EPI) creatinine equation for estimating GFR using creatinine assays with calibration traceable to standardized reference ma- terial (10).
The Korean National Health and Nutrition Examination Sur- vey (KNHANES) may provide a basis for estimating CKD preva- lence in the general population. This large, nationwide, repre- sentative survey conducted by the Korea Centers for Disease Control and Prevention (KCDC) includes laboratory examina- Nephrology
tions of urine albumin concentrations and serum creatinine levels standardized to isotope dilution mass spectrometry (IDMS), allowing for the identification and classification of CKD. The purpose of the present study was to provide nationally repre- sentative, population-based prevalence estimates of CKD among Korean adults in clinically relevant subpopulations from the KNHANES data.
MATERIALS AND METHODS Subjects
The KNHANES is a population-based, cross-sectional study on the health and nutritional status of the non-institutionalized Korean population. The KCDC conducted the survey using a stratified, multistage, clustered probability design to select a representative, nationwide sample. The KNHANES comprises a health questionnaire, physical/laboratory examinations, and a nutrition survey; to date, phase I (1998), II (2001), III (2005), IV (2007-2009), V (2010-2012), and VI (2013-2015) surveys have been conducted. The present study was based on the data ob- tained from KNHANES in 2011-2013 because urine albumin concentrations were measured since 2011, and complete data from KNHANES 2014-2015 had not yet been released when these analyses were conducted.
Of the 23,280 subjects participating in KNHANES 2011-2013, we excluded subjects younger than 20 years (n = 5,460) and adults in whom serum creatinine levels or urine albumin/cre- atinine concentrations were not measured (n = 2,494). After these exclusions, 15,319 subjects (6,891 men and 8,428 women) were included in the final analysis.
Anthropometric and laboratory data
Trained medical staff performed the physical examinations fol- lowing standardized procedures. Subjects’ body weight and height were measured to the nearest 0.1 kg and 0.1 cm, respec- tively, with subjects wearing light indoor clothing without shoes.
Blood pressure was measured manually three times at 30-sec- onds intervals after a minimum of 5 minutes of rest in a seated position, and recorded as an average value of the second and third measurements.
Blood samples were collected after at least an 8-hour fast, and random spot urine samples were obtained from the sub- jects. The samples were properly processed, immediately re- frigerated, and transported in cold storage to the central labora- tory within 24 hours. Serum and urine creatinine concentrations were measured by the colorimetric method using the Hitachi Automatic Analyzer 7600 (Hitachi, Tokyo, Japan) in KNHANES 2011 and 2012, and by the Jaffe rate-blanked and compensated method using the COBAS 8000 C702 (Roche, Mannheim, Ger- many) in KNHANES 2013. Serum glucose concentrations were measured by the enzymatic method. Urinary albumin concen-
trations were measured by the turbidimetric immunoassay us- ing the Hitachi Automatic Analyzer 7600 (Hitachi).
Kidney function
The eGFR was calculated from the serum creatinine level stan- dardized to IDMS using the CKD-EPI creatinine equation (11).
The urine albumin-to-creatinine ratio (ACR) was calculated in mg of albumin per g of creatinine (mg/g). We used five eGFR categories (G1, eGFR ≥ 90 mL/min/1.73 m2; G2, eGFR 60-89 mL/min/1.73 m2; G3a, eGFR 45-59 mL/min/1.73 m2; G3b, eGFR 30-44 mL/min/1.73 m2; G4-5, eGFR < 30 mL/min/1.73 m2) and three albuminuria categories (A1, ACR < 30 mg/g; A2, ACR 30- 300 mg/g; A3, ACR > 300 mg/g) according to the KDIGO stag- ing system (10).
We ascertained kidney damage as an ACR ≥ 30 mg/g and a decreased GFR as an eGFR < 60 mL/min/1.73 m2. Hence, CKD was defined as an ACR ≥ 30 mg/g or an eGFR < 60 mL/min/
1.73 m2. In populations with CKD, the eGFR and albuminuria categories were grouped with similar relative risk for adverse outcomes into three risk categories: moderately increased risk, G3a-A1 or G1-2A2; high risk, G3b-A1, G3a-A2, or G1-2A3; very high risk, G4-5A1, G3b-5A2, or G3a-5A3 (10). We also classified CKD according to the conventional staging system: stage 1, G1- A2-3; stage 2, G2-A2-3; stage 3a, G3a-A1-3; stage 3b, G3b-A1-3;
and stages 4-5, G4-5-A1-3.
Demographic and clinical characteristics
The analyzed sociodemographic characteristics included age, sex, education level (middle school or lower/high school or high- er), household income (the lower fourth/three higher fourths) and residential area (rural/urban). Smoking was dichotomized as current or former smokers/nonsmokers. Diabetes mellitus was defined as a serum fasting glucose level ≥ 126 mg/dL, use of anti-diabetic medicine, or a physician diagnosis of diabetes mellitus. Hypertension was defined as systolic blood pressure
≥ 140 mmHg, diastolic blood pressure ≥ 90 mmHg, or the use of blood pressure-lowering medication. We defined cardiovas- cular disease as self-reported, physician-diagnosed angina pec- toris, acute myocardial infarction, or stroke.
Statistical analysis
Statistical analyses were performed with SPSS (version 22.0;
SPSS Inc., Chicago, IL, USA). For the KNHANES, the KCDC used a complex sample design (stratification, clustering, and unequal selection probabilities). Therefore, SPSS Complex Samples mod- ule was used to obtain valid point estimates and confidence in- tervals, and test our hypothesis.
The composite sample weight was introduced into our analy- ses to provide representative estimates of the non-institutional- ized Korean population. We calculated the composite weight by multiplying the survey weight by one-third for each of the
years (2011-2013). The survey weight for subjects participating in the health questionnaire and physical/laboratory examina- tions was calculated using the sampling rate, response rate, and age/sex proportion of the Korean population. The SPSS Com- plex Samples module computed correct confidence intervals and significance tests by the Taylor series method, which incor- porated the sample weight, stratum, and primary sampling unit.
Logistic regression analysis was used to evaluate the odds ra- tios for CKD by independent variables. The group without each corresponding characteristic served as the reference, and the group with a body mass index (BMI) of 18.5-24.9 kg/m2 served as the reference BMI category.
Ethics statement
KNHANES phases V and VI were approved by the institutional review board of the KCDC (IRB No. 2011-02CON-06-C, 2012-01 EXP-01-2C, and 2013-07CON-03-4C). The need for informed
consent was waived by the board.
RESULTS
Subjects’ characteristics
The demographic characteristics of the study sample, weighted to be representative of the Korean population, were as follows;
the mean age was 46.1 years, and 47.2% were women. The mean eGFR was 95.9 mL/min/1.73 m2, and the mean ACR was 18.3 mg/g. The prevalence of diabetes mellitus, hypertension, and diagnosed cardiovascular disease were 9.2%, 26.7%, and 3.2%, respectively.
Classification by eGFR and albuminuria categories The proportions of categories classified based on eGFR and al- buminuria are shown in Table 1. The total prevalence estimate of albuminuria with an ACR ≥ 30 mg/g was 6.7%: ACR 30-300 Table 1. Populations by eGFR and albuminuria categories: complex samples analysis (Korean National Health and Nutrition Examination Survey, 2011-2013 [study sample n = 15,319])
eGFR categories: eGFR, mL/min/1.73 m2 Albuminuria categories: ACR, mg/g
Total
A1*, < 30 A2*, 30-300 A3*, > 300
Age ≥ 20 yr, n = 33,461,134†
G1, ≥ 90.0 63.5 (62.3-64.6) 2.8 (2.5-3.2) 0.2 (0.2-0.3) 66.5 (65.4-67.6)
G2, 60.0-89.9 28.3 (27.4-29.4) 2.3 (2.1-2.6) 0.4 (0.3-0.5) 31.0 (30.0-32.1)
G3a, 45.0-59.9 1.3 (1.1-1.5) 0.5 (0.4-0.6) 0.1 (0.1-0.2) 1.9 (1.7-2.1)
G3b, 30.0-44.9 0.2 (0.1-0.3) 0.1 (0.1-0.2) 0.1 (0.1-0.1) 0.4 (0.3-0.5)
G4-5, < 30.0 0.0 (0.0-0.1) 0.1 (0.0-0.1) 0.1 (0.1-0.2) 0.2 (0.1-0.3)
Total 93.3 (92.8-93.8) 5.8 (5.3-6.3) 0.9 (0.7-1.1) 100.0
Age ≥ 60 yr, n = 6,809,154†
G1, ≥ 90.0 21.6 (20.3-23.1) 2.7 (2.2-3.3) 0.3 (0.1-0.6) 24.6 (23.2-26.1)
G2, 60.0-89.9 56.4 (54.6-58.1) 7.7 (6.8-8.7) 1.0 (0.7-1.5) 65.1 (63.5-66.6)
G3a, 45.0-59.9 5.9 (5.1-6.8) 1.9 (1.5-2.4) 0.3 (0.2-0.5) 8.1 (7.2-9.1)
G3b, 30.0-44.9 0.8 (0.6-1.2) 0.6 (0.4-1.0) 0.2 (0.1-0.5) 1.7 (1.3-2.2)
G4-5, < 30.0 0.1 (0.0-0.2) 0.3 (0.1-0.5) 0.2 (0.1-0.3) 0.5 (0.3-0.8)
Total 84.8 (83.4-86.1) 13.2 (12.0-14.5) 2.0 (1.6-2.5) 100.0
Diabetes, n = 2,905,239†
G1, ≥ 90.0 37.5 (34.6-40.6) 6.9 (5.5-8.6) 0.8 (0.4-1.9) 45.2 (42.1-48.3)
G2, 60.0-89.9 34.9 (32.0-37.9) 8.3 (6.8-9.9) 2.0 (1.3-3.0) 45.1 (42.0-48.3)
G3a, 45.0-59.9 4.4 (3.5-5.7) 1.8 (1.3-2.7) 0.6 (0.4-1.1) 6.9 (5.7-8.3)
G3b, 30.0-44.9 0.8 (0.4-1.4) 0.9 (0.5-1.6) 0.2 (0.1-0.7) 1.9 (1.3-2.8)
G4-5, < 30.0 0.1 (0.0-0.3) 0.4 (0.2-1.0) 0.4 (0.1-1.1) 0.9 (0.5-1.7)
Total 77.7 (75.2-80.0) 18.3 (16.2-20.6) 4.0 (3.0-5.5) 100.0
Hypertension, n = 8,572,299†
G1, ≥ 90.0 40.5 (38.7-42.2) 5.0 (4.2-5.9) 0.6 (0.4-1.0) 46.1 (44.3-47.9)
G2, 60.0-89.9 40.0 (38.2-42.2) 6.2 (5.4-7.2) 0.9 (0.7-1.3) 47.1 (45.4-48.9)
G3a, 45.0-59.9 3.4 (2.9-4.1) 1.3 (1.0-1.7) 0.4 (0.2-0.6) 5.1 (4.4-5.8)
G3b, 30.0-44.9 0.6 (0.4-0.8) 0.3 (0.2-0.5) 0.3 (0.1-0.4) 1.1 (0.9-1.5)
G4-5, < 30.0 0.0 (0.0-0.2) 0.2 (0.1-0.4) 0.3 (0.2-0.7) 0.6 (0.4-0.9)
Total 84.5 (83.0-85.8) 13.0 (11.8-14.4) 2.5 (2.0-3.1) 100.0
Diagnosed cardiovascular disease, n = 1,045,184†
G1, ≥ 90.0 27.7 (23.5-32.3) 2.9 (1.8-4.6) 0.6 (0.2-1.8) 31.1 (26.8-35.8)
G2, 60.0-89.9 44.6 (40.3-49.0) 6.1 (4.4-8.4) 0.9 (0.4-1.9) 51.6 (47.1-56.0)
G3a, 45.0-59.9 7.1 (5.4-9.4) 5.3 (3.6-7.8) 0.7 (0.3-1.6) 13.1 (10.5-16.3)
G3b, 30.0-44.9 1.4 (0.7-2.7) 0.6 (0.2-1.4) 0.6 (0.2-1.9) 2.6 (1.6-4.1)
G4-5, < 30.0 0.0 (0.0-0.3) 0.9 (0.3-2.3) 0.6 (0.2-2.9) 1.6 (0.7-3.5)
Total 80.8 (77.2-84.0) 15.8 (12.9-19.1) 3.4 (2.1-5.5) 100.0
eGFR, estimated glomerular filtration rate; ACR, albumin-to-creatinine ratio.
*Data are presented as the weighted percent estimate (95% confidence interval) for each population; †Numbers are presented as the weighted total number estimate of each population.
Table 2. Prevalence of CKD among adults aged ≥ 20 years by disease stage and selected characteristics: complex samples analysis (Korean National Health and Nutrition Ex- amination Survey, 2011-2013 [study sample n = 15,319])
Characteristics Weighted total
number estimate*
Weighted percent estimate (95% confidence interval) of the CKD prevalence
All CKD Stage 1 Stage 2 Stage 3A Stage 3B Stages 4-5
Total 33,461,134 8.2 (7.6-8.8) 3.0 (2.7-3.4) 2.7 (2.4-3.0) 1.9 (1.7-2.1) 0.4 (0.3-0.5) 0.2 (0.1-0.3)
Age group, yr ≥ 60 40-59 20-39
6,809,154 14,169,087 12,482,893
22.0 (20.5-23.5) 6.4 (5.6-7.2) 2.8 (2.3-3.4)
3.0 (2.4-3.7) 3.6 (3.1-4.2) 2.4 (1.9-2.9)
8.7 (7.7-9.8) 1.9 (1.6-2.4) 0.3 (0.2-0.6)
8.1 (7.2-9.1) 0.5 (0.3-0.8) 0.0 (0.0-0.2)
1.7 (1.3-2.2) 0.1 (0.1-0.3) 0.0 (0.0-0.1)
0.5 (0.3-0.8) 0.2 (0.1-0.3) 0.0 (0.0-0.2) Sex
Female
Male 15,799,793
17,661,341 8.9 (8.2-9.7)
7.5 (6.9-8.3) 3.5 (3.0-4.0)
2.6 (2.2-3.1) 3.0 (2.6-3.4)
2.5 (2.1-2.9) 1.9 (1.6-2.2)
1.9 (1.6-2.2) 0.4 (0.3-0.6)
0.4 (0.3-0.6) 0.2 (0.1-0.4) 0.13 (0.1-0.2) Diabetes
Yes
No 2,905,239
28,686,661 27.6 (25.1-30.3)
6.0 (5.5-6.6) 7.7 (6.2-9.5)
2.5 (2.2-2.9) 10.3 (8.7-12.1)
1.9 (1.7-2.2) 6.9 (5.7-8.4)
1.3 (1.1-1.5) 1.9 (1.3-2.8)
0.2 (0.2-0.3) 0.9 (0.5-1.7) 0.1 (0.1-0.2) Hypertension
Yes
No 8,572,299
23,560,793 19.6 (18.1-21.1)
6.0 (5.5-6.6) 5.6 (4.8-6.6)
2.5 (2.2-2.9) 7.2 (6.3-8.2)
1.9 (1.7-2.2) 5.1 (4.4-5.8)
1.3 (1.1-1.5) 1.1 (0.9-1.5)
0.2 (0.2-0.3) 0.6 (0.4-0.9) 0.1 (0.1-0.2) Diagnosed cardiovascular disease
Yes
No 1,045,184
31,188,050 27.8 (24.0-31.8)
7.5 (6.9-8.0) 3.5 (2.2-5.4)
3.0 (2.7-3.4) 7.0 (5.2-9.5)
2.6 (2.3-2.9) 13.1 (10.5-16.3)
1.5 (1.3-1.7) 2.6 (1.6-4.1)
0.3 (0.2-0.4) 1.6 (0.7-3.5) 0.1 (0.1-0.2) Body mass index, kg/m2
≥ 30.0 25.0-29.9 18.5-24.9 < 18.5
1,557,195 9,632,344 20,843,849 1,371,804
14.2 (11.3-17.7) 11.1 (10.1-12.2)
6.5 (6.0-7.2) 6.3 (4.5-8.7)
6.5 (4.5-9.1) 3.8 (3.2-4.5) 2.5 (2.1-2.9) 2.7 (1.5-4.9)
5.5 (3.8-7.9) 4.0 (3.4-4.7) 2.0 (1.7-2.3) 1.4 (0.7-2.8)
1.5 (0.8-2.7) 2.5 (2.1-3.0) 1.7 (1.4-2.0) 1.3 (0.7-2.3)
0.4 (0.1-1.0) 0.6 (0.4-0.9) 0.3 (0.2-0.4) 0.4 (0.1-1.3)
0.3 (0.1-2.3) 0.2 (0.1-0.5) 0.1 (0.1-0.2) 0.5 (0.1-1.8) Smoker
Yes
No 14,200,575
18,002,158 8.2 (7.4-9.1)
8.0 (7.3-8.8) 3.0 (2.4-3.6)
3.1 (2.7-3.5) 2.6 (2.2-3.1)
2.7 (2.4-3.2) 2.1 (1.8-2.4)
1.6 (1.4-1.9) 0.4 (0.3-0.6)
0.4 (0.3-0.5) 0.1 (0.1-0.3) 0.2 (0.1-0.4) CKD, chronic kidney disease.
*Numbers are presented as the weighted total number estimate of each population.
Table 3. Prevalence of CKD among adults aged ≥ 20 years by risk category and selected characteristics: complex samples analysis (Korean National Health and Nutrition Ex- amination Survey, 2011-2013 [n = 15,319])
Characteristics Weighted percent estimate (95% confidence interval)
No CKD Moderate risk High risk Very high risk
Total 91.9 (91.2-92.4) 6.4 (6.0-7.0) 1.2 (1.1-1.4) 0.5 (0.4-0.6)
Age group, yr ≥ 60 40-59 20-39
78.1 (76.5-79.5) 93.6 (92.9-94.4) 97.2 (96.6-97.8)
16.2 (14.9-17.6) 5.2 (4.5-5.9) 2.6 (2.1-3.1)
4.1 (3.5-4.8) 0.8 (0.6-1.1) 0.2 (0.1-0.4)
1.6 (1.3-2.1) 0.4 (0.2-0.6) 0.0 (0.0-0.2) Sex
Female Male
91.0 (90.3-91.8) 92.4 (91.8-93.1)
7.2 (6.5-7.9) 5.8 (5.2-6.4)
1.2 (1.0-1.5) 1.3 (1.0-1.6)
0.6 (0.4-0.8) 0.5 (0.4-0.7) Diabetes
Yes No
72.4 (69.7-74.9) 93.9 (93.4-94.5)
19.6 (17.3-22.0) 5.0 (4.5-5.5)
5.4 (4.2-7.0) 0.8 (0.6-1.0)
2.6 (1.9-3.7) 0.3 (0.2-0.4) Hypertension
Yes No
80.4 (78.9-81.9) 96.1 (95.6-96.5)
14.7 (13.4-16.1) 3.4 (3.0-3.9)
3.4 (2.8-4.0) 0.4 (0.3-0.6)
1.5 (1.2-2.0) 0.1 (0.1-0.2) Diagnosed cardiovascular disease
Yes No
72.2 (68.2-76.0) 92.5 (92.0-93.1)
16.2 (13.4-19.4) 6.1 (5.6-6.6)
8.2 (6.1-10.9) 1.0 (0.8-1.2)
3.4 (2.1-5.5) 0.4 (0.3-0.5) Body mass index, kg/m2
≥ 30.0 25.0-29.9 18.5-24.9 < 18.5
85.7 (82.3-88.7) 89.0 (87.8-89.9) 93.4 (92.9-94.0) 93.7 (91.3-95.5)
10.9 (8.3-14.1) 8.7 (7.9-9.7) 5.2 (4.7-5.7) 4.6 (3.1-6.8)
2.4 (1.3-4.2) 1.7 (1.4-2.2) 1.0 (0.8-1.2) 0.9 (0.4-2.0)
1.0 (0.4-2.4) 0.6 (0.4-0.9) 0.4 (0.3-0.6) 0.8 (0.3-2.1) Smoker
Yes No
91.8 (90.9-92.6) 92.0 (91.3-92.7)
6.3 (5.6-7.1) 6.4 (5.8-7.1)
1.4 (1.1-1.7) 1.1 (0.9-1.3)
0.5 (0.4-0.7) 0.5 (0.4-0.7) CKD, chronic kidney disease.
Total
0 20 40 60 80 100 (%)
Age ≥ 60 Age 40-59 Age 20-39 Female Male DM (+) DM (-) HTN (+) HTN (-) CVD (+) CVD (-) BMI ≥ 30 BMI 25-29.9 BMI 18.5-24.9 BMI <18.5 Smoker Nonsmoker
Very high risk Moderate risk High risk
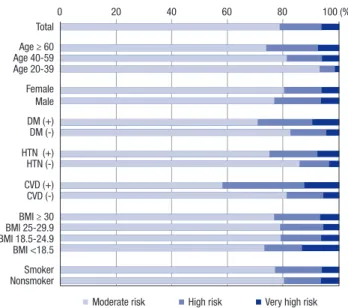
Fig. 1. Proportions of risk categories in various subpopulations with chronic kidney disease.
DM, diabetes mellitus; HTN, hypertension; CVD, cardiovascular disease; BMI, body mass index.
Table 4. Odds ratio for CKD: complex samples analysis (Korean National Health and Nutrition Examination Survey, 2011-2013)
Characteristics* Crude odds
ratio (95% CI)
Age-sex adjusted odds ratio (95% CI)
Fully adjusted odds ratio†
(95% CI) Age, 20-year increment 3.6 (3.2-3.9) 3.6 (3.2-3.9) 2.4 (2.1-2.8) Female sex 1.2 (1.1-1.4) 1.0 (0.9-1.1) 1.2 (0.9-1.5) Diabetes 6.0 (5.1-7.0) 3.4 (2.8-4.0) 2.7 (2.2-3.2) Hypertension 5.9 (5.1-6.8) 3.2 (2.7-3.7) 2.5 (2.1-3.0) Diagnosed cardiovascular disease 4.8 (3.9-5.9) 2.0 (1.6-2.5) 1.6 (1.3-2.0) Body mass index‡, kg/m2
≥ 30.0 25.0-29.9 < 18.5
2.4 (1.8-3.1) 1.8 (1.6-2.0) 1.0 (0.7-1.4)
3.4 (2.5-4.6) 1.8 (1.5-2.0) 1.3 (0.9-2.0)
2.1 (1.5-3.0) 1.4 (1.2-1.7) 1.6 (1.0-2.5)
Smoker 1.0 (0.9-1.2) 1.2 (0.9-1.5) 1.1 (0.9-1.4)
Education, < high school graduate 3.5 (3.1-4.0) 1.1 (1.0-1.4) 0.9 (0.8-1.1) Household income, lower 1/4 2.9 (2.5-3.3) 1.2 (1.0-1.3) 1.1 (0.9-1.3) Residential area, rural 1.7 (1.4-2.0) 1.2 (1.0-1.4) 1.3 (1.0-1.5) CKD, chronic kidney disease; CI, confidence interval.
*The group without each corresponding characteristics served as the reference; †The odds ratio was adjusted for all other variables, and the variables included in the mod- el were age, sex, diabetes, hypertension, cardiovascular disease, body mass index category, smoking, education, income, and residence; ‡The group with a body mass index of 18.5-24.9 kg/m2 served as the reference.
mg/g, 5.8% and ACR > 300 mg/g, 0.9%. The total prevalence es- timate of a decreased GFR with an eGFR < 60 mL/min/1.73 m2 was 2.5%: G3a, 1.9%; G3b, 0.4%; and G4-5, 0.2%. The prevalence of albuminuria and a decreased GFR were higher in the popula- tions with older age, diabetes, hypertension, and diagnosed car- diovascular disease compared to the general population.
Prevalence of CKD by disease stage
The total prevalence estimate of CKD was 8.2%. By disease stage, the prevalence of CKD was as follows: stage 1, 3.0%; stage 2, 2.7%;
stage 3a, 1.9%; stage 3b, 0.4%; and stages 4-5, 0.2% (Table 2). The distributions of CKD stages in men were similar to those in wom- en. The prevalence of CKD was higher in older subjects than in younger subjects: 22.0% in the elderly group, 6.4% in the mid- dle-aged group, and 2.8% in the young group. The prevalence of each stage of CKD was higher in the subpopulations with dia- betes, hypertension, diagnosed cardiovascular disease, and BMIs of ≥ 30.0 kg/m2 and 25.0-29.9 kg/m2 than in those without each corresponding characteristic. The prevalence also differed by socioeconomic characteristics, and it was higher in groups with a low education level, low household income, and rural residen- tial area.
Prevalence of CKD by risk category
We grouped eGFR and albuminuria categories with a similar relative risk for CKD outcomes into risk categories (Table 3). The proportions of categories with a moderately increased risk, high risk, and very high risk were 6.5%, 1.2%, and 0.5%, respectively.
Fig. 1 shows the percentages of the moderately increased risk (78.7%), high risk (15.0%), and very high risk (6.2%) categories among the CKD patients. The proportions of the high risk and
very high risk categories were increased in subpopulations with older age, diabetes, and cardiovascular disease.
Variables associated with the presence of CKD
We evaluated the odds ratios of each variable with or without adjusting for other variables (Table 4). In the age-sex adjusted models, the factors of older age, diabetes, hypertension, diag- nosed cardiovascular disease, and BMIs of ≥ 30.0 kg/m2 and 25.0-29.9 kg/m2 were related to the presence of CKD. In fully adjusted models, the factors of older age, diabetes, hyperten- sion, diagnosed cardiovascular disease, BMIs of ≥ 30.0 kg/m2, 25.0-29.9 kg/m2, and < 18.5 kg/m2, and rural residential area were independently associated with the presence of CKD. The adjusted odds ratios over two-fold were observed in subjects with older age (20-year increment), diabetes, hypertension, and a BMI of ≥ 30 kg/m2.
DISCUSSION
In this population-based study, albuminuria with an ACR ≥ 30 mg/g and a decreased GFR with an eGFR < 60 mL/min/1.73 m2 were observed in 6.7% and 2.5%, respectively, of the Korean population aged ≥ 20 years. The total prevalence estimate of CKD for adults aged ≥ 20 years in Korea was 8.2% when CKD was defined as an ACR ≥ 30 mg/g or an eGFR < 60 mL/min/
1.73 m2. By disease stage, the prevalence was as follows: stage 1, 3.0%; stage 2, 2.7%; stage 3A, 1.9%; stage 3B, 0.4%; and stages 4/5, 0.2%. By risk category, the prevalence was as follows: mod- erate risk, 6.5%; high risk, 1.2%; and very high risk, 0.5%.
The prevalence of CKD worldwide has been reported as ap-
proximately 10%-14% in studies conducted in various countries.
The prevalence of CKD was 13.1% among adults aged ≥ 20 years in the United States (7), 10.2% of adults aged ≥ 20 years in Nor- way (12), 13.2% of persons aged ≥ 40 years in northeastern Italy (13), 12.5% of adults aged ≥ 18 years in Canada (14), 10.8% of adults aged ≥ 18 years in China (8), 13.2% of adults aged ≥ 20 years in Japan (15), and 13.7% of persons aged ≥ 35 years in Korea (9). These prevalence estimates of CKD may be influenced by the study sampling design, serum creatinine and urine albu- min assays, calculation formula of eGFR, and definition/classi- fication of CKD.
In the present study, the eGFR was calculated from the se- rum creatinine level standardized to IDMS using the CKD-EPI creatinine equation. The CKD-EPI creatinine equation more accurately estimates GFR (11) and more accurately categorizes the risk of death than the MDRD equation (1). The accuracy of the equation has also been previously demonstrated in Asian populations, including Koreans (16,17). Proper use of GFR esti- mating equations requires an equation-specific calibration of the serum creatinine assays (18,19). Due to the variability be- tween calibration methods, assays not calibrated to IDMS in- troduce a source of error into GFR estimates.
Furthermore, a standard study design for a population and a design-consistent estimation are required to obtain unbiased estimates. KNHANES is a nationwide, population-based study that used a stratified, multistage, clustered probability design, whereas we estimated the prevalence with a design-consistent method that incorporated the sample weight, stratum, and pri- mary sampling unit.
A previous study, which reported the prevalence of CKD in the Korean population as 13.7% in adults aged ≥ 35 years, also measured urine ACR and made a diagnosis of CKD using a sim- ilar criteria to ours (9). However, the subjects were included only from urban areas and the sample size was not sufficiently large to reliably represent the entire Korean population. Moreover, the serum creatinine level was not standardized to IDMS and the eGFR was calculated using the MDRD equation rather than the CKD-EPI equation. When we recalculated the eGFR in our study population using the MDRD equation, the prevalence of CKD with an eGFR < 60 mL/min/1.73 m2 or an ACR ≥ 30 mg/g was estimated as 8.8% in the Korean population aged ≥ 20 years and 11.3% in the population aged ≥ 35 years.
Previous studies analyzing the KNHANES data have reported higher prevalence rates of stages 3 and 4 CKD with an eGFR
< 60 mL/min/1.73 m2 than our estimates (20-22). However, the differences between our estimates and previously published prevalence estimates should not be interpreted as representing time trends. Because creatinine levels were not standardized to IDMS in the KNHANES before 2008, the eGFRs were calculated using the MDRD equation. Moreover, most of the previous stud- ies calculated the prevalence rates without incorporation of the
sample weights. The higher prevalence estimates of CKD in those studies could therefore be explained by the following reasons.
First, non-standardized creatinine levels are usually higher than IDMS-standardized levels (23). When we compared the levels within the KNHANES 2008 data, which included both the non- standardized/standardized levels, the non-standardized serum levels (mean ± SE, 0.94 ± 0.004 mg/dL) were substantially high- er than those standardized to IDMS (mean ± SE, 0.82 ± 0.005 mg/dL) in people with ages (mean ± SE) of 49.6 ± 0.31 years and 49.1 ± 0.27 years, respectively. Furthermore, on condition that serum creatinine levels are equal, the MDRD equation may classify more persons into CKD compared to the CKD-EPI equa- tion (1). Finally, the unweighted analysis of the KNHANES, in which older people participated relatively more, can overesti- mate the prevalence. When we re-estimated the prevalence in our study population without incorporation of the sample wei- ght, 10.5% rather than 8.2% of adults aged ≥ 20 years had CKD.
Additionally, the KNHANES data analyzed by previous studies did not include information on the ACR because urine ACR has been measured in the KNHANES since 2011.
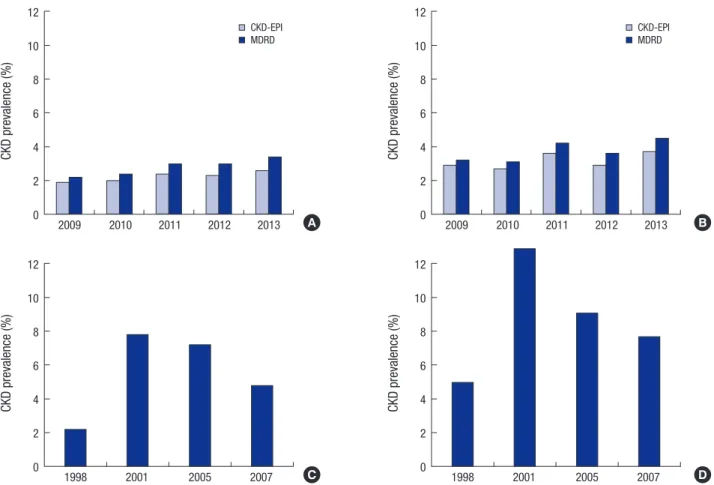
To evaluate the differences of the prevalence estimates with- in the whole KNHANES data, we computed the prevalence es- timates from 1998 to 2013. Fig. 2A and B shows yearly differenc- es of the prevalence estimates from 2009; since that year, serum creatinine levels have been standardized to IDMS in the KNHANES. The prevalence of CKD with an eGFR < 60 mL/min/
1.73 m2 has not been decreasing in recent years. The prevalence estimates of CKD from 1998 to 2007, during which creatinine levels were not standardized, are also shown in Fig. 2C and 2D.
There were rapid changes in the prevalence estimates during that period.
Most studies that have been reported until now classified CKD principally by eGFR category. However, albuminuria itself is recognized as a risk factor for end-stage renal disease and cardiovascular events (24,25). In CKD with a normal or mildly decreased eGFR, albuminuria is more predictive of adverse kidney outcomes and all-cause/cardiovascular mortality than the eGFR (26-28). This has prompted the need for new risk strat- ification for adverse outcomes based on both the eGFR and al- buminuria. The 2012 KDIGO guidelines recommend that CKD be classified based on cause, the GFR category, and the albu- minuria category. According to the recommendation, we as- signed subjects to an albuminuria category as well as an eGFR category. Furthermore, we grouped the eGFR and albuminuria categories with a similar relative risk for adverse outcomes into three risk categories: moderately increased risk, high risk, and very high risk (10).
In the present study, a high BMI of ≥ 25.0 kg/m2 was an in- dependent predictor of CKD (Table 4). Previous longitudinal studies, performed in the United States (29) and Thailand (30) have demonstrated that a high BMI is an independent risk fac-
Table 5. Comparison of baseline characteristics and CKD prevalence according to nationwide studies in Korea, China, and the United States
Characteristics Korea* China United States
2011-2013 (n = 15,319) 2009-2010 (n = 47,204) 1988-1994 (n = 15,448) 1999-2004 (n = 13,233)
Age (mean), yr 46.1 49.6 44.8 46.2
Female sex, % 47.2 57.3 52.2 51.8
eGFR (mean), mL/min/1.73 m2 95.9 101.2 92.7 87.4
ACR (mean), mg/g 18.3 6.6 25.4 28.6
ACR > 30 mg/g, % 6.7 9.4 8.2 9.5
Diabetes mellitus, % 9.2 7.4 5.4 6.8
Hypertension, % 26.7 35.4 23.8 27.1
Diagnosed cardiovascular disease, % 3.2 2.6 N/A N/A
Body mass index (mean), kg/m2 23.9 23.9 26.6 28.1
CKD stage, % Total 1 2 3a 3b 4 5
8.2 3.0 2.7 1.9 0.4 0.2
10.8 5.7 3.4 1.4 0.2 0.1 0.03
10.0 1.7 2.7 5.4 0.2 N/A
13.1 1.8 3.2 7.7 0.4 N/A eGFR, estimated glomerular filtration rate; ACR, albumin creatinine ratio; CKD, chronic kidney disease; N/A, not applicable.
*Data are presented as the weighted percent or mean estimate.
Fig. 2. Differences in the prevalence estimates of chronic kidney disease within the entire KNHANES data set. (A) CKD with an eGFR ≤ 60 mL/min/1.73 m2 using both the CPK- EPI and MDRD equations, from 2009 to 2013. (B) CKD with dipstick-positive proteinuria ≥ 1+ or an eGFR ≤ 60 mL/min/1.73 m2 using both the CPK-EPI and MDRD equations, from 2009 to 2013. (C) CKD with an eGFR ≤ 60 mL/min/1.73 m2 using the MDRD equation, from 1998 to 2007. (D) CKD with or dipstick-positivie proteinuria ≥ 1+ or an eGFR
≤ 60 mL/min/1.73 m2 using the MDRD equation, from 1998 to 2007.
KNHANES, Korean National Health and Nutrition Examination Survey; eGFR, estimated glomerula filtration rate; CPK-EPI, Chronic Kidney Disease-Epidemiology Collaboration;
MDRD, Modification of Diet in Renal Disease Study.
CKD prevalence (%)
2009 2010 2011 2012 2013 12
10 8 6 4 2 0
CKD-EPI MDRD
CKD prevalence (%)
2009 2010 2011 2012 2013 12
10 8 6 4 2 0
CKD-EPI MDRD
CKD prevalence (%)
1998 2001 2005 2007
12 10 8 6 4 2 0
CKD prevalence (%)
1998 2001 2005 2007
12 10 8 6 4 2 0 A
C
B
D
tor for the development of new-onset kidney dysfunction with an eGFR < 60 mL/min/1.73 m2. These results suggest that wei- ght reduction in obese persons is helpful to prevent the devel- opment or progression of CKD. However, our study also showed that the lowest BMI of < 18.5 kg/m2 was associated with the presence of CKD after adjusting for other variables. However, a causal relationship between the lowest BMI and CKD cannot be argued from our cross-sectional study because CKD may cause malnutrition and weight loss. In addition to BMI, well- known risk factors such as older age, hypertension, diabetes, and cardiovascular disease were also associated with an increa- sed risk of CKD.
The CKD prevalence in Korea (8.2%) shown in our study was somewhat lower than those of the United States (10.0% and 13.1%) (7) and China (10.8%) (8) (Table 5). Stages 3 and 4 CKD with an eGFR < 60 mL/min/1.73 m2 were more prevalent in the United States, whereas stages 1 and 2 CKD with an ACR ≥ 30 mg/g were more prevalent in the Korean and Chinese popula- tion. Among the associated factors for CKD, the BMI of the Ko- rean population was lower than the United States population.
This relatively lower BMI may at least partially account for the lower prevalence of CKD in Korea. Diabetes was less prevalent in the United States, but this may be owing to the difference in the definition of diabetes between studies (i.e., self-reported di- abetes in data from the United States vs. the laboratory exami- nations-based diagnosis in our study) rather than a reflection of the true prevalence of diabetes. In a recent report, approximate- ly 1 in 4 persons with diabetes was unaware that he/she had di- abetes (31). Chinese data showed a relatively higher mean age and higher prevalence of hypertension.
There are some limitations to our study. First, we estimated GFR using a serum creatinine-based equation rather than di- rectly measuring it using an exogenous ideal marker of GFR.
The potential difference between the measured and estimated GFR may be influenced by the population in which the equa- tion is applied. Such a bias may contribute to racial/ethnic dif- ferences in prevalence estimates. Second, the serum creatinine for each person was measured only once. A single eGFR value cannot precisely reflect kidney function, and there exists the possibility that patients with acute kidney injury were included.
Likewise, urine albumin was measured only once; thus, tran- sient albuminuria could not be excluded. Finally, there is a po- tential difference in the survey response rate, which may be lower among sicker individuals and bias the present prevalence estimates. Thus, the prevalence of stages 4 and 5 CKD would have been underestimated in KNHANES, which enrolled non- institutionalized individuals who volunteered to participate.
In conclusion, the prevalence of CKD among adults aged
≥ 20 years was 8.2% in this nationwide representative sample of the Korean population. Albuminuria with an ACR ≥ 30 mg/g was observed in 6.7%, whereas a decreased GFR with an eGFR
< 60 mL/min/1.73 m2 was observed in 2.5% of the population.
Factors such as older age, diabetes, hypertension, cardiovascu- lar disease, and high BMI are associated with the presence of CKD. Evidence-based, customized screening strategies for CKD in the Korean population are needed to optimize prevention and early intervention of CKD, and its associated risk factors.
DISCLOSURE
The authors have no potential conflicts of interest to disclose.
AUTHOR CONTRIBUTION
Conception and design: Park JI, Baek H, Jung HH. Data collec- tion and analysis: Jung HH. Writing: Park JI. Critical review and revisions: Park JI, Baek H, Jung HH. Approval of final manuscript and submission: all authors.
ORCID
Ji In Park http://orcid.org/0000-0003-4662-3759 Hyunjeong Baek http://orcid.org/0000-0003-1325-3392 Hae Hyuk Jung http://orcid.org/0000-0002-3202-6307 REFERENCES
1. Matsushita K, Mahmoodi BK, Woodward M, Emberson JR, Jafar TH, Jee SH, Polkinghorne KR, Shankar A, Smith DH, Tonelli M, et al. Comparison of risk prediction using the CKD-EPI equation and the MDRD study equa- tion for estimated glomerular filtration rate. JAMA 2012; 307: 1941-51.
2. Go AS, Chertow GM, Fan D, McCulloch CE, Hsu CY. Chronic kidney dis- ease and the risks of death, cardiovascular events, and hospitalization. N Engl J Med 2004; 351: 1296-305.
3. Chow FY, Briganti EM, Kerr PG, Chadban SJ, Zimmet PZ, Atkins RC. Health- related quality of life in Australian adults with renal insufficiency: a pop- ulation-based study. Am J Kidney Dis 2003; 41: 596-604.
4. Awuah KT, Finkelstein SH, Finkelstein FO. Quality of life of chronic kid- ney disease patients in developing countries. Kidney Int Suppl (2011) 2013; 3: 227-9.
5. World Health Organization. Global burden of disease (GBD). Available at http://www.who.int/healthinfo/global_burden_disease/gbd/en/ [accessed on 19 November 2015].
6. Murray CJ, Lopez AD. Measuring the global burden of disease. N Engl J Med 2013; 369: 448-57.
7. Coresh J, Selvin E, Stevens LA, Manzi J, Kusek JW, Eggers P, Van Lente F, Levey AS. Prevalence of chronic kidney disease in the United States. JAMA 2007; 298: 2038-47.
8. Zhang L, Wang F, Wang L, Wang W, Liu B, Liu J, Chen M, He Q, Liao Y, Yu X, et al. Prevalence of chronic kidney disease in China: a cross-sectional survey. Lancet 2012; 379: 815-22.
9. Kim S, Lim CS, Han DC, Kim GS, Chin HJ, Kim SJ, Cho WY, Kim YH, Kim YS. The prevalence of chronic kidney disease (CKD) and the associated factors to CKD in urban Korea: a population-based cross-sectional epi-
demiologic study. J Korean Med Sci 2009; 24 Suppl: S11-21.
10. Levin A, Stevens PE. Summary of KDIGO 2012 CKD Guideline: behind the scenes, need for guidance, and a framework for moving forward. Kid- ney Int 2014; 85: 49-61.
11. Levey AS, Stevens LA, Schmid CH, Zhang YL, Castro AF 3rd, Feldman HI, Kusek JW, Eggers P, Van Lente F, Greene T, et al. A new equation to es- timate glomerular filtration rate. Ann Intern Med 2009; 150: 604-12.
12. Hallan SI, Coresh J, Astor BC, Asberg A, Powe NR, Romundstad S, Hallan HA, Lydersen S, Holmen J. International comparison of the relationship of chronic kidney disease prevalence and ESRD risk. J Am Soc Nephrol 2006; 17: 2275-84.
13. Gambaro G, Yabarek T, Graziani MS, Gemelli A, Abaterusso C, Frigo AC, Marchionna N, Citron L, Bonfante L, Grigoletto F, et al. Prevalence of CKD in northeastern Italy: results of the INCIPE study and comparison with NHANES. Clin J Am Soc Nephrol 2010; 5: 1946-53.
14. Arora P, Vasa P, Brenner D, Iglar K, McFarlane P, Morrison H, Badawi A.
Prevalence estimates of chronic kidney disease in Canada: results of a nationally representative survey. CMAJ 2013; 185: E417-23.
15. Imai E, Horio M, Watanabe T, Iseki K, Yamagata K, Hara S, Ura N, Kiyoha- ra Y, Moriyama T, Ando Y, et al. Prevalence of chronic kidney disease in the Japanese general population. Clin Exp Nephrol 2009; 13: 621-30.
16. Teo BW, Xu H, Wang D, Li J, Sinha AK, Shuter B, Sethi S, Lee EJ. GFR esti- mating equations in a multiethnic Asian population. Am J Kidney Dis 2011; 58: 56-63.
17. Jeong TD, Lee W, Chun S, Lee SK, Ryu JS, Min WK, Park JS. Comparison of the MDRD study and CKD-EPI equations for the estimation of the glo- merular filtration rate in the Korean general population: the fifth Korea National Health and Nutrition Examination Survey (KNHANES V-1), 2010.
Kidney Blood Press Res 2013; 37: 443-50.
18. Coresh J, Astor BC, McQuillan G, Kusek J, Greene T, Van Lente F, Levey AS. Calibration and random variation of the serum creatinine assay as critical elements of using equations to estimate glomerular filtration rate.
Am J Kidney Dis 2002; 39: 920-9.
19. Myers GL, Miller WG, Coresh J, Fleming J, Greenberg N, Greene T, Hostet- ter T, Levey AS, Panteghini M, Welch M, et al. Recommendations for im- proving serum creatinine measurement: a report from the Laboratory Working Group of the National Kidney Disease Education Program. Clin Chem 2006; 52: 5-18.
20. Kang HT, Lee J, Linton JA, Park BJ, Lee YJ. Trends in the prevalence of chronic kidney disease in Korean adults: the Korean National Health and Nutrition Examination Survey from 1998 to 2009. Nephrol Dial Trans- plant 2013; 28: 927-36.
21. Lee SW, Kim YC, Oh SW, Koo HS, Na KY, Chae DW, Kim S, Chin HJ. Trends in the prevalence of chronic kidney disease, other chronic diseases and health-related behaviors in an adult Korean population: data from the
Korean National Health and Nutrition Examination Survey (KNHANES).
Nephrol Dial Transplant 2011; 26: 3975-80.
22. Yu M, Ryu DR, Kim SJ, Choi KB, Kang DH. Clinical implication of meta- bolic syndrome on chronic kidney disease depends on gender and meno- pausal status: results from the Korean National Health and Nutrition Ex- amination Survey. Nephrol Dial Transplant 2010; 25: 469-77.
23. Levey AS, Coresh J, Greene T, Marsh J, Stevens LA, Kusek JW, van Lente F;
Chronic Kidney Disease Epidemiology Collaboration. Expressing the Modification of Diet in Renal Disease Study equation for estimating glo- merular filtration rate with standardized serum creatinine values. Clin Chem 2007; 53: 766-72.
24. Nitsch D, Grams M, Sang Y, Black C, Cirillo M, Djurdjev O, Iseki K, Jassal SK, Kimm H, Kronenberg F, et al. Associations of estimated glomerular filtration rate and albuminuria with mortality and renal failure by sex: a meta-analysis. BMJ 2013; 346: f324.
25. Gutiérrez OM, Khodneva YA, Muntner P, Rizk DV, McClellan WM, Cush- man M, Warnock DG, Safford MM; REGARDS Investigators. Association between urinary albumin excretion and coronary heart disease in black vs white adults. JAMA 2013; 310: 706-14.
26. Gansevoort RT, Matsushita K, van der Velde M, Astor BC, Woodward M, Levey AS, de Jong PE, Coresh J; Chronic Kidney Disease Prognosis Con- sortium. Lower estimated GFR and higher albuminuria are associated with adverse kidney outcomes. A collaborative meta-analysis of general and high-risk population cohorts. Kidney Int 2011; 80: 93-104.
27. Foster MC, Hwang SJ, Larson MG, Parikh NI, Meigs JB, Vasan RS, Wang TJ, Levy D, Fox CS. Cross-classification of microalbuminuria and reduced glomerular filtration rate: associations between cardiovascular disease risk factors and clinical outcomes. Arch Intern Med 2007; 167: 1386-92.
28. van der Velde M, Matsushita K, Coresh J, Astor BC, Woodward M, Levey A, de Jong P, Gansevoort RT, van der Velde M, Matsushita K, et al. Lower es- timated glomerular filtration rate and higher albuminuria are associated with all-cause and cardiovascular mortality. A collaborative meta-analy- sis of high-risk population cohorts. Kidney Int 2011; 79: 1341-52.
29. Fox CS, Larson MG, Leip EP, Culleton B, Wilson PW, Levy D. Predictors of new-onset kidney disease in a community-based population. JAMA 2004;
291: 844-50.
30. Domrongkitchaiporn S, Sritara P, Kitiyakara C, Stitchantrakul W, Kritta- phol V, Lolekha P, Cheepudomwit S, Yipintsoi T. Risk factors for develop- ment of decreased kidney function in a southeast Asian population: a 12- year cohort study. J Am Soc Nephrol 2005; 16: 791-9.
31. Centers for Disease Control and Prevention (CDC). National diabetes statistics report, 2014. Available at http://www.cdc.gov/diabetes/pubs/
statsreport14/national-diabetes-report-web.pdf [accessed on 19 Novem- ber 2015].
![Table 3. Prevalence of CKD among adults aged ≥ 20 years by risk category and selected characteristics: complex samples analysis (Korean National Health and Nutrition Ex- Ex-amination Survey, 2011-2013 [n = 15,319])](https://thumb-ap.123doks.com/thumbv2/123dokinfo/5139739.93318/4.892.70.820.658.1078/prevalence-category-selected-characteristics-analysis-national-nutrition-amination.webp)