LRIG1 Enhances Chemosensitivity by Modulating BCL-2 Expression and Receptor Tyrosine Kinase Signaling in Glioma Cells
Zhentao Guo, Qianxue Chen, Baohui Liu, Daofeng Tian, Shenqi Zhang, and Mingchang Li
Department of Neurosurgery, Renmin Hospital of Wuhan University, Wuhan, Hubei, China.
Received: November 19, 2013 Revised: January 1, 2014 Accepted: February 6, 2014
Corresponding author: Dr. Qianxue Chen, Department of Neurosurgery,
Renmin Hospital of Wuhan University, NO. 238, Jiefang Road, Wuhan, Hubei, China.
Tel: 86-136-07141618, Fax: 86-027-88042292 E-mail: [email protected]
∙ The authors have no financial conflicts of interest.
© Copyright:
Yonsei University College of Medicine 2014 This is an Open Access article distributed under the terms of the Creative Commons Attribution Non- Commercial License (http://creativecommons.org/
licenses/by-nc/3.0) which permits unrestricted non- commercial use, distribution, and reproduction in any medium, provided the original work is properly cited.
Purpose: Leucine-rich repeats and immunoglobulin-like domains 1 (LRIG1) are
an inhibitor of receptor tyrosine kinases (RTKs) that was discovered in recent years, and many studies showed that LRIG1 is a tumor suppressor gene and may be related to tumor drug resistance. In this study, we explored whether LRIG1 protein expression can improve the chemosensitivity of glioma cells and what was its mechanism. Materials and Methods: We collected 93 cases of glioma tissues and detected the expression of LRIG1 and BCL-2. We constructed a mul- tidrug resistance cell line U251/multidrug resistance (MDR) and examined the change of LRIG1 and BCL-2 at mRNA and protein expression levels. LRIG1 ex- pression was upregulated in U251/MDR cells and we detected the change of multidrug resistance. Meanwhile, we changed the expression of LRIG1 and BCL-2 and explored the relationship between LRIG1 and BCL-2. Finally, we also explored the relationship between LRIG1 and RTKs.
Results: LRIG1 wasnegatively correlated with BCL-2 expression in glioma tissue and U251/MDR cells, and upregulation of LRIG1 can enhance chemosensitivity and inhibit BCL- 2 expression. Furthermore, LRIG1 was negatively correlated with RTKs in U251/MDR cells.
Conclusion: These results demonstrated that LRIG1 can im-prove chemosensitivity by modulating BCL-2 expression and RTK signaling in glioma cells.
Key Words:
Glioma, LRIG1, chemosensitivity, BCL-2, RTKs
INTRODUCTION
Malignant gliomas, the most common primary brain tumors, are highly invasive and neurologically destructive neoplasms with a very poor prognosis. Surgical re- section is the main treatment option for glioma patients, but postoperative recur- rence is a pressing problem due to the invasiveness of the gliomas. At present, comprehensive treatments, such as chemotherapy and radiotherapy, are used to treat glioma, but the prognosis is still very poor.
1The current research, therefore, has been focused on how to solve this problem.
Traditional chemotherapy is not the preferred adjuvant therapy after glioma re-
section due to its uncertain outcomes, but combined chemotherapy and radiothera-
py or other adjuvant therapies have generally been shown to have a curative effect
MATERIALS AND METHODS
Reagents
Chemicals were purchased from Sigma-Aldrich (Wuhan branch, China). The LRIG1 plasmid was graciously provid- ed by the Renmin Hospital of Wuhan University, China. The siRNAs against BCL-2 and LRIG1 were synthesized by Sangon (Shanghai, China). Antibodies were purchased from Abcam (Cambridge, UK).
Specimens
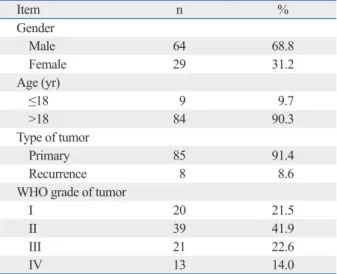
Specimens from 98 astrocytic tumors in 93 patients were collected at the Renmin Hospital of Wuhan University from April 2009 to January 2011. The present study was ap- proved by the Ethics Committee of the Faculty of Medicine of Renmin Hospital, Wuhan University. The characteristics of these patients and tumors are shown in Table 1. Astrocyt- ic tumor diagnoses of all specimens were panel reviewed by an experienced pathologist according to the criteria of the World Health Organization (2000).
23Included in our analyses are 20 cases of grade I, 39 of grade II, 21 of grade III, and 13 of grade IV astrocytomas.
Construction of a tissue microarray (TMA) of human brain astrocytoma
The tissue microarray (TMA) was constructed as previously described.
24The sample diameter of the tissue core in the mi- cro-array block was 1000 μm. 5-μm thick sections were pre- pared from representative array paraffin blocks. Between 0 and 8.7% of samples were lost during the TMA section prep- on glioma patients.
2,3Temozolomide (TMZ) is a new che-
motherapy drug that has been shown to have positive ef- fects on glioma patients in recent years,
4allowing doctors to reconsider the role of chemotherapy in the treatment of these patients. However, despite the fact that chemotherapy is beneficial in prolonging the survival time of patients, its impact has been limited. Drug resistance is the main reason for the failure of chemotherapy, particularly the emergence of multidrug resistance (MDR).
5Many molecular players participate in the formation of multidrug resistant glioma, in- cluding multidrug resistance protein, lung resistance-related protein, metal sulfur protein, and glutathione among others.
5,6Altered expression of these genes or proteins may be helpful in reversing the multidrug resistance of glioma.
7,8At present, patients treated with TMZ adjuvant therapy are also treated with other adjuvants, including receptor tyrosine kinase (RTK) inhibitors, to improve its curative effects.
9Leucine-rich repeats and immunoglobulin-like domains 1 (LRIG1) is a negative regulator of RTKs.
10The LRIG1 gene is the human homologue of mouse Lig-1 and is located on chromosome band 3p14.
11The expression of LRIG1 is re- duced in human tumors.
12,13LRIG1 can inhibit the growth of glioma cells through the inhibition of epidermal growth fac- tor receptor (EGFR) signaling.
14LRIG1 can also inhibit the growth of breast cancer cells, prostate cancer cells and so on.
15-17In addition, LRIG1 can negatively regulate c-Met re- ceptor signaling,
18LRIG1 deletion induces upregulation of EGFR, ErbB2 and ErbB3, downregulation of LRIG1 can promote the proliferation of squamous cell carcinoma, breast cancer cells and so on.
17,19Therefore, LRIG1 may be a new tumor suppressor gene.
20LRIG1 expression is related to
BCL-2 gene expression in human ependymomas,21and B cell lymphoma/lewkmia-2 (BCL-2) is an apoptosis-inhibit- ing factor and is related to chemosensitivity.
22LRIG1 has been shown to improve chemosensitivity in bladder cells.
However, whether LRIG1 can enhance the chemosensitivity of glioma cells and the mechanism by which it achieves this remain unknown.
We hypothesized that LRIG1 was related to the chemo- sensitivity of glioma cells and that LRIG1 expression could improve the cell’s chemosensitivity through the inhibition of BCL-2, EGFR, and c-Met gene expression. To test this hypothesis, we constructed a multidrug resistant cell line, and studied the expression of LRIG1, BCL-2, EGFR, and c-Met. Using this cell line, we modulated the expression of LRIG1 and BCL-2, determined how these changes affected the cell’s chemosensitivity.
Table 1. Characteristics of 93 Patients with 98 Astrocyto- mas Included in the Tissue Microarray Analyses
Item n %
Gender
Male 64 68.8
Female 29 31.2
Age (yr)
≤18 9 9.7
>18 84 90.3
Type of tumor
Primary 85 91.4
Recurrence 8 8.6
WHO grade of tumor
I 20 21.5
II 39 41.9
III 21 22.6
IV 13 14.0
WHO, World Health Organization.
β-actin sense 5’-gtccaccgcaaatgcttcta-3’ and antisense
5’-tgctgtcaccttcaccgttc-3’.
Transfection and CCK-8 assay
To overexpress LRIG1, U251/MDR and U251 cells at 50-- 80% confluence were transfected with the LRIG1 plasmid (2 μg/well, 6-well plate) using the FUGENE HD transfec- tion reagent (Roche, Basel, Switzerland) according to the manufacturer’s instructions.
For knockdown experiments, siRNAs against human
BCL-2, LRIG1, and control siRNA were purchased fromSangon. According to the manufacturer’s instructions, cells at 30--50% confluence were transfected with a final concen- tration of 40 nM siRNA using the Lipofectamine 2000 trans- fection reagent (Invitrogen, Carlsbad, CA, USA).
Exponentially growing cells were plated in 96-well plates (1000 cells/well). After 24 h, the U251/MDR and U251 cells were transfected and cultured for 48 h or 72 h, and Cell Counting Kit 8 (CCK-8) solution (10 µL/well) was added to the cells. The cells were then incubated for 1 h at 37°C. Cell proliferation was determined by measuring ab- sorbance at 490 nm with a microplate reader (Leibo, Fin- land). The inhibition ratio of proliferation was calculated using the following equation: (control group CCK-8--exper- imental group CCK-8)/control group CCK-8.
Immunoblotting
Total protein was extracted from the U251 and U251/MDR cells of each group 48 h after transfection, and the total cell extracts were centrifuged at 12000 rpm at 4°C. The protein concentration was determined using the Bradford method, with bovine serum albumin as the standard. Protein lysates (30 µg) were resolved using sodium dodecyl sulfate-poly- acrylamide gel electrophoresis, transferred to polyvinylidene fluoride membranes (Millipore, Bedford, MA, USA), and then probed with primary antibodies overnight at 4°C. The membranes were then incubated with the corresponding horseradish peroxidase-conjugated secondary antibodies at room temperature, and the reaction was visualized using chemiluminescent electrochemiluminescence. Antibodies were purchased from Abcam.
Statistical methods
The statistical analyses were performed using the Prism 5.0 software (Graphpad Software, La Jolla, CA, USA). All data are presented as mean±SEM. The statistical significance of the findings between the experimental and control groups aration or immunostaining procedures. The tissue array was
purchased from Beacher, Sun Prairie, WI, USA. The paraffin embedding machine was purchased from Leica (Bannock- burn, IL, USA); the immunohistochemistry kit was pur- chased from Boster (Wuhan, China); and the optical micro- scope (BX51) was purchased from Olympus (Tokyo, Japan).
Immunohistochemistry for LRIG1 and BCL-2 expression in the TMA
According to previously described methods,
21the LRIG1 antibody and BCL-2 antibody (Abcam, UK) developed in our laboratory were used for the immunostaining. Negative controls were not treated with primary antibodies. As shown in previous analysis,
21the astrocytic tumor cells were immunoreactive in the cytoplasmic, nuclear, and peri- nuclear areas. LRIG1 and BCL-2 expression in the TMA was determined. All evaluations were performed using the blind method and agreed on by four observers.
The isolation of a multidrug resistant cell line
The U251 cells were purchased from the State Key Labora- tory of Molecular Biology, Institute of Biochemistry and Cell Biology, Shanghai Institutes for Biological Sciences, Chinese Academy of Sciences, Shanghai, China. The cells were cul- tured in Dulbecco’s modified Eagle’s medium supplemented with 10% fetal bovine serum in a humidified incubator (San- yo, Osaka, Japan) with 5% CO
2at 37°C. Basal cell culture was maintained in T-75 flasks (Sigma-Aldrich, St. Louis, MO, USA). Cells were trypsinized when they reached 80-- 90% confluence and were seeded into 6-well plates. TMZ was added to the 6-well plates at an initial concentration of 0.25 µg/mL. The concentration was doubled after the cells were cultured for 15 days, and the final concentration of TMZ was 16 µg/mL. After withdrawal of TMZ for 2 months, the cells were re-challenged with 16 μg/mL TMZ for 1 week every month.
RT-PCR
Total RNA was isolated using an RNA miniprep kit (Sigma
Santa Clara, CA, USA). For RT-PCR, the cDNA was synthe-
sized using a cDNA reverse transcription kit (Applied Bio-
systems, Zurich, Switzerland), and the PCR kits were pur-
chased from Sigma. Based on the LRIG1, BCL-2, and β-actin
gene sequences, three pairs of gene-specific primers were
designed: LRIG1 sense 5’-ttgctgatgttgtttcgctg-3’and anti-
sense 5’-tgatggtctgtcacggtcg-3’, BCL-2 sense 5’-ttctttgagttc
ggtggggtc-3’ and antisense 5’-tgcatatttgtttggggcagg-3’,
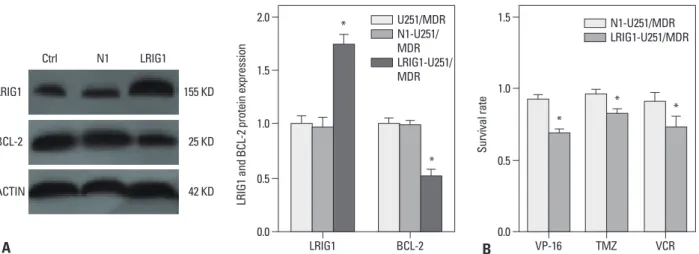
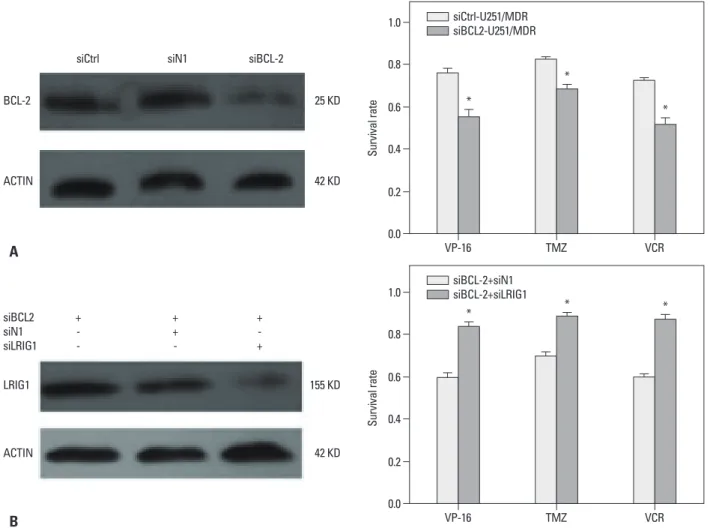
Immunoblot analysis showed that LRIG1 expression in the LRIG1-U251/MDR cells was significantly increased where- as BCL-2 expression was downregulated when compared to the control group (Fig. 3A). Next, we detected BCL-2 expression and the changes in chemotherapy sensitivity in the LRIG1-U251/MDR cells, using the CCK-8 assay com- pared to the untransfected N1-U251/MDR cells (Fig. 3B).
The results showed that increasing LRIG1 expression could inhibit BCL-2 expression and enhance the chemosensitivity of U251/MDR cells.
BCL-2 knock down can enhance the chemosensitivity siRNA targeting BCL-2 was transfected into U251/MDR cells, and the results showed that BCL-2 expression was significantly reduced. Next, we found that silencing BCL-2 can enhance the chemosensitivity of glioma cells (Fig. 4).
LRIG1 can enhance chemosensitivity by regulating the
BCL-2 gene in glioma cellsOur results showed that LRIG1 expression improved the was determined using Student’s t-test or ANOVA. A value
of p<0.05 was considered statistically significant.
RESULTS
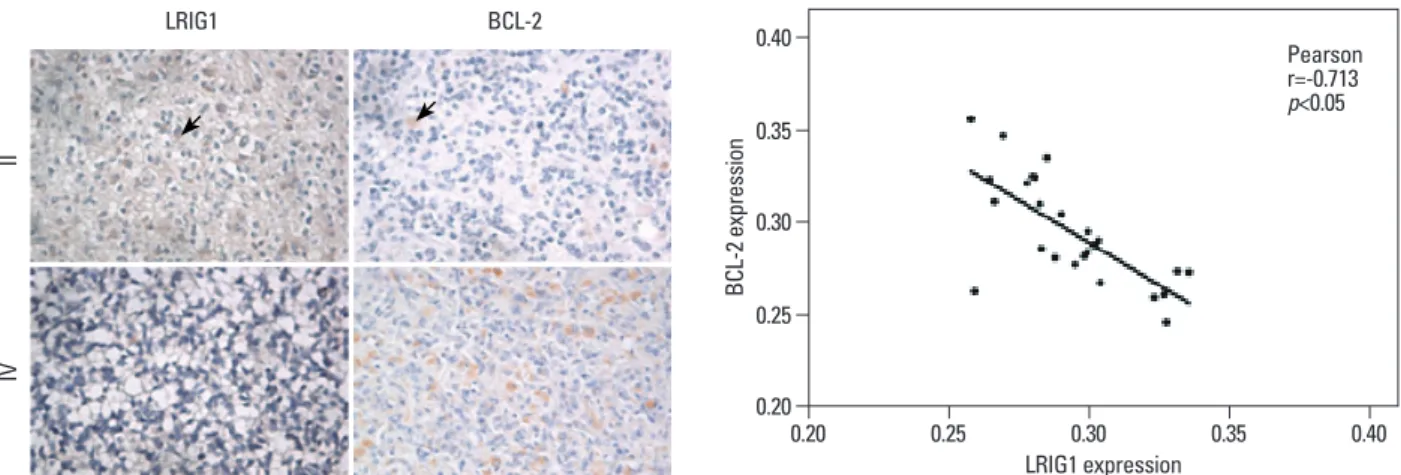
LRIG1 was negatively correlated with BCL-2 expression in glioma tissue
Immunohistochemical results show LIRG1 proteins local- ized to different subcellular compartments in human brain astrocytomas, including the cytoplasm, nucleus and perinu- clear area. BCL-2 proteins are mainly located in the cyto- plasm of human brain astrocytomas (Fig. 1). Moreover, LRIG1 expression was negatively correlated with BCL-2 expression (r=-0.713, p<0.05) (Fig. 1, Table 2).
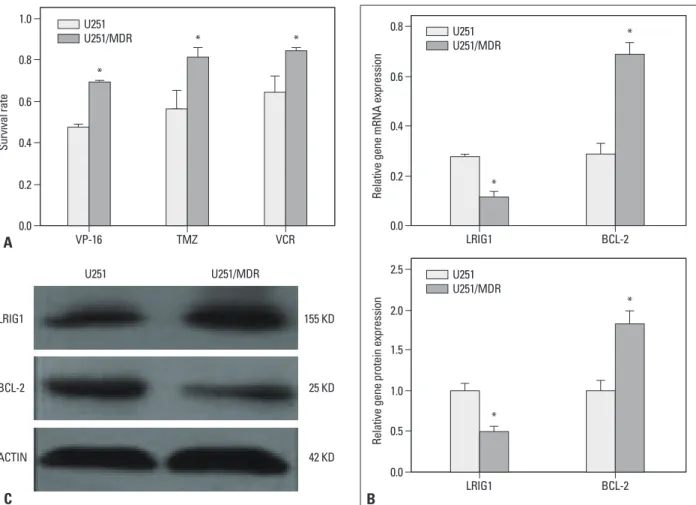
Establishment of MDR cell line and the expression of LRIG1 and BCL-2
The multidrug resistant cell line U251/MDR was isolated by stepwise exposure to increasing TMZ concentrations for ap- proximately 6 months. This cell line exhibited resistance to TMZ, etoposide (VP-16), and vincristine sulfate (Fig. 2A).
The expression of LRIG1 and BCL-2 was detected in the U251/MDR cells using RT-PCR and Western blot (Fig. 2B and C), and the results showed that LRIG1 expression was re- duced whereas BCL-2 expression was increased, compared to the parent cells. LRIG1 expression was negatively correlat- ed with BCL-2 expression (p<0.05).
LRIG1 can inhibit BCL-2 expression and improve the chemosensitivity of glioma cells
The LRIG1 plasmid was transfected into U251/MDR cells.
Table 2. The Expression of LRIG1 and BCL-2 in Astrocytic Tumors Tissue (OD, mean±SD)
WHO Cases OD (mean±SD)
LRIG1 BCL-2
I 20 0.3080±0.0075 0.2801±0.0023
II 39 0.2885±0.0069 0.2887±0.0057
III 21 0.2801±0.0063 0.2993±0.0042
IV 13 0.2631±0.0067* 0.3296±0.0062*
LRIG1, leucine-rich repeats and immunoglobulin-like domains 1; BCL-2, B cell lymphoma/lewkmia-2; OD, optical density; WHO, World Health Orga- nization.
*p<0.05 vs. Grade I.
Fig. 1. Immunohistochemical analysis of LRIG1 and BCL-2 protein expression in human astrocytomas (light microscope). LRIG1 was localized in the cyto- plasm, nucleus and perinuclear area and BCL-2 was mainly localized in the cytoplasm in grades II and IV of astrocytoma. Arrows indicate LRIG1 protein ex- pression. Moreover, LRIG1 expression was negatively correlated with BCL-2 expression (r=-0.713, p<0.05). LRIG1, leucine-rich repeats and immunoglobulin- like domains 1; BCL-2, B cell lymphoma/lewkmia-2.
LRIG1 expression 0.20
0.30 0.35
0.25 0.40
BCL-2 expression
0.20 0.25 0.30 0.35 0.40
Pearson r=-0.713 p<0.05
IIIV
LRIG1 BCL-2
including EGFR and c-Met,
25,26and some RTK inhibitors have been shown to enhance the effects of glioma thera- py.
27,28We detected the expression of EGFR and c-Met in the U251/MDR cell line using immunoblot analysis, and Fig. 6 shows that the expression of these genes was in- creased in the U251/MDR cells, compared to the parent U251 cell line.
DISCUSSION
Gliomas are the most common malignant tumors of the central nervous system and a serious threat to a patient’s health and life. Therefore, there is an urgent need to identify effective treatments that control it’s the growth and recur- rence. Chemotherapy is an important component in the chemosensitivity of glioma cells and inhibited BCL-2 ex-
pression. We also showed that depletion of BCL-2 could enhance the chemosensitivity of glioma cells. To detect whether LRIG1 enhanced the chemosensitivity through the regulation of the BCL-2 gene, we knocked down BCL-2 in U251/MDR cells and then knocked down LRIG1 by siR- NA. As seen in Fig. 5, siLRIG1 could reduce the sensitivity to chemotherapy and reverse the effect of siBCL-2, thus leading us to conclude that LRIG1 enhanced the chemosen- sitivity of glioma cells through the regulation of BCL-2 ex- pression.
The expression of multiple RTKs was increased in U251/MDR cells, and LRIG1 negatively correlated with RTK expression
The expression of many RTKs was increased in glioma cells,
Fig. 2. Establishment of an MDR cell line and the expression of LRIG1 and BCL-2. A multidrug resistance cell line U251/MDR was isolated by stepwise expo- sure to increasing temozolomide (TMZ) concentrations for approximately 6 months. The initial concentration was 0.25 mg/mL, which was doubled after the cells had been cultured for 15 days; the final concentration was 16 mg/mL. The U251/MDR cells were seeded in 96-well plates, and chemotherapy drugs were added to each well 12 h later [VP-16: 10 mg/mL, TMZ: 16 mg/mL, vincristine sulfate (VCR): 10 mg/mL]. The cell proliferation was detected using the CCK- 8 assay after 48 h (A), and the results showed that the U251/MDR cells were more resistant to TMZ, etoposide (VP-16), and VCR than the U251 cells. The re- sults are represented as the survival rate. We also detected the mRNA and protein expression of LRIG1 and BCL-2 in the U251/MDR and U251 cells (B and C), and the results showed that LRIG1 expression was reduced and that BCL-2 expression was increased in the U251/MDR cells, compared to the U251 cells. The results are represented as the ratio of absorbance. *p<0.05 vs. U251 cells. MDR, multidrug resistance; LRIG1, leucine-rich repeats and immuno- globulin-like domains 1; BCL-2, B cell lymphoma/lewkmia-2; VP-16, etoposide; CCK, Cell Counting Kit.
B C
A
0.00.2 0.4 0.6 0.8 1.0
Survival rate
VP-16 TMZ VCR
U251 U251/MDR
*
0.0 0.5 1.0 1.5 2.0 2.5
Relative gene protein expression
LRIG1 BCL-2
U251 U251/MDR
*
* 0.0
0.2 0.4 0.6 0.8
Relative gene mRNA expression
LRIG1 BCL-2
U251 U251/MDR
*
* * *
LRIG1 155 KD
BCL-2 25 KD
ACTIN 42 KD
U251 U251/MDR
gliomas have a stronger drug resistance. This finding indi- cated that LRIG1 is a tumor suppressor gene and may be related to tumor drug resistance. In addition, some research- ers have reported that LRIG1 can inhibit the function of the glial cell line-derived neurotrophic factor, which can reduce the sensitivity of neuroblastoma cells to chemotherapy.
31,32Li, et al.
33also showed that LRIG1 expression in combina- tion with cisplatin treatment can enhance the effect of che- motherapy in bladder cancer. These results suggest that LRIG1 may be involved in drug resistance. To elucidate the relationship between LRIG1 and multidrug resistance in gli- oma cells, we constructed the multidrug resistant cell line U251/MDR, and examined the expression of LRIG1 in treatment of tumors. In recent years, TMZ, a new chemo-
therapy drug, has proven to be effective in the treatment of gliomas. However, tumor resistance, particularly multidrug resistance, reduces the effectiveness of TMZ. How to solve this problem has become the focus of current research.
LRIG1 is an inhibitor of RTKs that was discovered in re- cent years, and it is highly expressed in a variety of tissues.
LRIG1 is highly expressed in brain tissues, particularly gli- oma cells.
11,29Goldoni, et al.
30reported that LRIG1 can in- hibit the growth of glioma cells through the inhibition of EGFR signaling. Our study showed that LRIG1 expression was reduced in glioma cells, and its expression level de- creased with increasing tumor grade; therefore, higher grade
Fig. 4. BCL-2 knockdown reverses MDR in U251/MDR cells. U251/MDR cells at 50% confluence were transfected with siBCL-2 (2 mg/well, 6-well plate) using the Lipofectamine 2000 transfection reagent (Invitrogen) according to the manufacturer’s instructions. After 48 h, the cells were seeded in 96-well plates and then treated with VP-16 (10 mg/mL), TMZ (16 mg/mL), and VCR (10 mg/mL) for 48 h. The inhibition of cell proliferation was detected using the CCK-8 assay.
The results are represented as the survival rate. *p<0.05 vs. control group. MDR, multidrug resistance; TMZ, temozolomide; VCR, vincristine sulfate; BCL-2, B cell lymphoma/lewkmia-2; VP-16, etoposide; CCK-8, Cell Counting Kit.
0.0 0.2 0.4 0.6 0.8 1.0
Survival rate
VP-16 TMZ VCR
siCtrl-U251/MDR siBCL2-U251/MDR
*
*
*
BCL-2 25 KD
ACTIN 42 KD
siCtrl siN1 siBCL-2
Fig. 3. The effect of LRIG1 in MDR. U251/MDR cells at 50--80% confluence were transfected with the LRIG1 plasmid (2 mg/well, 6-well plate) using the FUGENE HD transfection reagent (Roche) according to the manufacturer’s instructions. After 48 h, the BCL-2 expression was detected (A). At the same time, the LRIG1-U251/MDR cells were seeded in 96-well plates and then treated with VP-16 (10 mg/mL), TMZ (16 mg/mL), and VCR (10 mg/mL) for 48 h. Following incubation, we detected the inhibition of VP-16, TMZ, and VCR on the U251/MDR cells using the CCK-8 assay (B). The results are represented as the survival rate, *p<0.05 vs. control group. MDR, multidrug resistance; LRIG1, leucine-rich repeats and immunoglobulin-like domains 1; TMZ, temozolomide; VCR, vin- cristine sulfate; VP-16, etoposide; BCL-2, B cell lymphoma/lewkmia-2; CCK, Cell Counting Kit.
A B
0.0 0.5 1.0 1.5 2.0
LRIG1 and BCL-2 protein expression
LRIG1 BCL-2
U251/MDR N1-U251/
MDR LRIG1-U251/
MDR
*
*
0.0 0.5 1.0 1.5
Survival rate
VP-16 TMZ VCR
N1-U251/MDR LRIG1-U251/MDR
*
* *
LRIG1 155 KD
BCL-2 25 KD
ACTIN 42 KD
Ctrl N1 LRIG1
Fig. 5. siLRIG1 can reduce chemosensitivity by regulating BCL-2 gene expression. First, we seeded U251/MDR cells in 6-well plates when they reached 50%
confluence. siBCL-2 was transfected into U251 cells using the Lipofectamine 2000 transfection reagent (Invitrogen) according to the manufacturer’s instruc- tions (A). Next, siLRIG1 was transfected into the siBCL-2 cells using the same method. We then detected the inhibition of cell proliferation of VP-16 (10 mg/
mL), TMZ (16 mg/mL), and VCR (10 mg/mL) according to the method described previously (B). The results are represented as the survival rate. *p<0.05 vs.
siBCL-2 alone. MDR, multidrug resistance; LRIG1, leucine-rich repeats and immunoglobulin-like domains 1; TMZ, temozolomide; VCR, vincristine sulfate, BCL-2, B cell lymphoma/lewkmia-2; VP-16, etoposide.
Fig. 6. The expression of EGFR and c-Met in U251 and U251/MDR cells. We seeded U251 and U251/MDR cells in 6-well plates. After 48 h, total protein was extracted, and the expression levels of EGFR, c-Met, and LRIG1 were detected using immunoblot analysis. Compared to U251, LRIG1 expression was re- duced, and the expression levels of EGFR and c-Met were increased in the U251/MDR cells. *p<0.05 vs. U251 cells. MDR, multidrug resistance; LRIG1, leu- cine-rich repeats and immunoglobulin-like domains 1; EGFR, epidermal growth factor receptor.
B A
0.0 0.2 0.4 0.6 0.8 1.0
Survival rate
VP-16 TMZ VCR
siCtrl-U251/MDR siBCL2-U251/MDR
*
*
BCL-2 25 KD *
ACTIN 42 KD
siCtrl siN1 siBCL-2
0.0 0.2 0.4 0.6 0.8 1.0
Survival rate
VP-16 TMZ VCR
siBCL-2+siN1 siBCL-2+siLRIG1
* * *
LRIG1 155 KD
ACTIN 42 KD
+- - siBCL2 siN1siLRIG1
++ -
+- +
0.0 0.2 0.4 0.6 0.8 1.0
Relative gene expression
c-Met EGFR LRIG1
U251 U251/MDR
*
*
*
c-Met 160 KD
EGFR
LRIG1
ACTIN
175 KD
155 KD
42 KD
U251 U251/MDR
cells through the downregulation of BCL-2 and the inhibi- tion of the RTK signaling pathways. When glioma cells re- tained LRIG1 expression, the BCL-2 and RTK genes expres- sions were downregulated. When glioma cells lost LRIG1 expression, the BCL-2 and RTK genes became upregulated and stimulated chemo-resistance. It is, therefore, possible that treatment with BCL-2 and RTK inhibitors may improve the clinical effects of chemotherapy in glioma patients.
REFERENCES
1. Westphal M, Lamszus K. The neurobiology of gliomas: from cell biology to the development of therapeutic approaches. Nat Rev Neurosci 2011;12:495-508.
2. Bello L, Carrabba G, Giussani C, Lucini V, Cerutti F, Scaglione F, et al. Low-dose chemotherapy combined with an antiangiogenic drug reduces human glioma growth in vivo. Cancer Res 2001;61:
7501-6.
3. Hösli P, Sappino AP, de Tribolet N, Dietrich PY. Malignant glio- ma: should chemotherapy be overthrown by experimental treat- ments? Ann Oncol 1998;9:589-600.
4. Athanassiou H, Synodinou M, Maragoudakis E, Paraskevaidis M, Verigos C, Misailidou D, et al. Randomized phase II study of te- mozolomide and radiotherapy compared with radiotherapy alone in newly diagnosed glioblastoma multiforme. J Clin Oncol 2005;
23:2372-7.
5. Higgins CF. Multiple molecular mechanisms for multidrug resis- tance transporters. Nature 2007;446:749-57.
6. Calatozzolo C, Gelati M, Ciusani E, Sciacca FL, Pollo B, Cajola L, et al. Expression of drug resistance proteins Pgp, MRP1, MRP3, MRP5 and GST-pi in human glioma. J Neurooncol 2005;74:113- 7. Stupp R, Hegi ME, Gilbert MR, Chakravarti A. Chemoradiothera-21.
py in malignant glioma: standard of care and future directions. J Clin Oncol 2007;25:4127-36.
8. Jennings MT, Iyengar S. The molecular genetics of therapeutic re- sistance in malignant astrocytomas. Am J Pharmacogenomics 2001;1:93-9.
9. Tentori L, Graziani G. Recent approaches to improve the antitu- mor efficacy of temozolomide. Curr Med Chem 2009;16:245-57.
10. Suzuki Y, Sato N, Tohyama M, Wanaka A, Takagi T. cDNA clon- ing of a novel membrane glycoprotein that is expressed specifical- ly in glial cells in the mouse brain. LIG-1, a protein with leucine- rich repeats and immunoglobulin-like domains. J Biol Chem 1996;271:22522-7.
11. Nilsson J, Vallbo C, Guo D, Golovleva I, Hallberg B, Henriksson R, et al. Cloning, characterization, and expression of human LIG1.
Biochem Biophys Res Commun 2001;284:1155-61.
12. Nilsson J, Starefeldt A, Henriksson R, Hedman H. LRIG1 protein in human cells and tissues. Cell Tissue Res 2003;312:65-71.
13. Thomasson M, Hedman H, Guo D, Ljungberg B, Henriksson R.
LRIG1 and epidermal growth factor receptor in renal cell carcino- ma: a quantitative RT--PCR and immunohistochemical analysis.
Br J Cancer 2003;89:1285-9.
14. Ye F, Guo DS, Niu HQ, Tao SZ, Ou YB, Lu YP, et al. [Molecular mechanism of LRIG1 cDNA-induced apoptosis in human glioma
these cells. Our data showed that the expression of LRIG1 was downregulated in U251/MDR when compared to the parent cells. Moreover, when an LRIG1 overexpression plasmid was transfected into U251/MDR cells, the cell’s MDR status was reversed, thus confirming that LRIG1 ex- pression either in glioma tissue or in glioma cell lines, is re- lated to the chemosensitivity of gliomas and that upregula- tion of LRIG1 expression can enhance the chemosensitivity of glioma cells.
However, the mechanism by which LRIG1 improved the chemosensitivity of glioma cells remained unclear. Our earli- er study showed that BCL-2 expression was higher in astro- cytomas than in normal brain tissue,
34and the expression of LRIG1 is negatively correlated with the expression of BCL- 2.
21BCL-2 is an inhibitor of apoptosis in tumors.
35Nordfors and colleagues found that downregulation of BCL-2 expres- sion can increase the chemosensitivity of glioma cells.
36-39These results suggested that LRIG1 enhances chemosensi- tivity by regulating the expression of BCL-2 in gliomas.
Our data showed that BCL-2 expression was increased compared to that in the parental U251 cells. We also down- regulated the expression of BCL-2 and showed that down- regulation of BCL-2 could reverse the drug resistance of the U251/MDR cells. In addition, when the LRIG1 expres- sion in U251 cells was knocked down using siRNA, the ef- fect of siLRIG1 was lost. This series of findings confirmed that LRIG1 can improve the chemosensitivity of glioma cells by regulating the expression of BCL-2.
LRIG1 is a negative regulator of RTKs that enhances re- ceptor ubiquitination and degradation.
15,40,41In the resistant cell line, the expression of EGFR and c-Met increased com- pared to the U251 cells, and LRIG1 expression was nega- tively correlated with the expression of EGFR and c-Met.
EGFR plays an important role in the proliferation of cancer cells. EGFR gene-targeted therapy has been used for the treatment of some cancers, and it also can stimulate apopto- sis in glioma cells. Additionally, downregulation of EGFR expression can enhance the chemosensitivity of tumors.
42-44c-Met is an another RTK, and recent studies have shown that modulating its expression can regulate the proliferation and chemosensitivity of glioma cells,
45-48and that LRIG1 can modulate cancer cell sensitivity through its regulation of receptor tyrosine kinase signaling. Therefore, LRIG1 is likely to promote chemotherapy sensitivity by regulating RTKs in glioma cells.
In summary, we demonstrated herein that LRIG1 protein
expression could improve the chemosensitivity of glioma
gene 2007;26:368-81.
31. Hansford LM, Marshall GM. Glial cell line-derived neurotrophic factor (GDNF) family ligands reduce the sensitivity of neuroblas- toma cells to pharmacologically induced cell death, growth arrest and differentiation. Neurosci Lett 2005;389:77-82.
32. Ledda F, Bieraugel O, Fard SS, Vilar M, Paratcha G. Lrig1 is an endogenous inhibitor of Ret receptor tyrosine kinase activation, downstream signaling, and biological responses to GDNF. J Neu- rosci 2008;28:39-49.
33. Li F, Yang W, Guo D, Hu Z, Xu H, Ye Z. LRIG1 combined with cisplatin enhances bladder cancer lesions via a novel pathway.
Oncol Rep 2011;25:1629-37.
34. Liu B, Chen Q, Tian D, Wu L, Wang J, Cai Q, et al. Increased leu- cine-rich repeats and immunoglobulin-like domains 1 expression enhances chemosensitivity in glioma. Neural Regen Res 2011;32:
2516-20.
35. Wesarg E, Hoffarth S, Wiewrodt R, Kröll M, Biesterfeld S, Huber C, et al. Targeting BCL-2 family proteins to overcome drug resis- tance in non-small cell lung cancer. Int J Cancer 2007;121:2387- 94.
36. He X, Lin B, Kong L, Zhang J. The potential mechanism of che- mosensitive difference between 2 types of ovarian cancer. Saudi Med J 2007;28:1044-9.
37. Nordfors K, Haapasalo J, Helén P, Paetau A, Paljärvi L, Kalimo H, et al. Peroxiredoxins and antioxidant enzymes in pilocytic astrocy- tomas. Clin Neuropathol 2007;26:210-8.
38. Sekine I, Shimizu C, Nishio K, Saijo N, Tamura T. A literature re- view of molecular markers predictive of clinical response to cyto- toxic chemotherapy in patients with breast cancer. Int J Clin Oncol 2009;14:112-9.
39. Wang P, Zhen H, Jiang X, Zhang W, Cheng X, Guo G, et al. Bo- ron neutron capture therapy induces apoptosis of glioma cells through Bcl-2/Bax. BMC Cancer 2010;10:661.
40. Gur G, Rubin C, Katz M, Amit I, Citri A, Nilsson J, et al. LRIG1 restricts growth factor signaling by enhancing receptor ubiquity- lation and degradation. EMBO J 2004;23:3270-81.
41. Ye F, Gao Q, Xu T, Zeng L, Ou Y, Mao F, et al. Upregulation of LRIG1 suppresses malignant glioma cell growth by attenuating EGFR activity. J Neurooncol 2009;94:183-94.
42. Khatua S, Peterson KM, Brown KM, Lawlor C, Santi MR, LaF- leur B, et al. Overexpression of the EGFR/FKBP12/HIF-2alpha pathway identified in childhood astrocytomas by angiogenesis gene profiling. Cancer Res 2003;63:1865-70.
43. Lei W, Mayotte JE, Levitt ML. Enhancement of chemosensitivity and programmed cell death by tyrosine kinase inhibitors correlates with EGFR expression in non-small cell lung cancer cells. Anti- cancer Res 1999;19:221-8.
44. Nogi H, Kobayashi T, Suzuki M, Tabei I, Kawase K, Toriumi Y, et al. EGFR as paradoxical predictor of chemosensitivity and out- come among triple-negative breast cancer. Oncol Rep 2009;21:
413-7.
45. Fornari F, Milazzo M, Chieco P, Negrini M, Calin GA, Grazi GL, et al. MiR-199a-3p regulates mTOR and c-Met to influence the doxorubicin sensitivity of human hepatocarcinoma cells. Cancer Res 2010;70:5184-93.
46. Li Y, Guessous F, DiPierro C, Zhang Y, Mudrick T, Fuller L, et al.
Interactions between PTEN and the c-Met pathway in glioblasto- ma and implications for therapy. Mol Cancer Ther 2009;8:376-85.
47. Lin CI, Whang EE, Donner DB, Du J, Lorch J, He F, et al. Au- tophagy induction with RAD001 enhances chemosensitivity and cell line H4]. Ai Zheng 2004;23:1149-54.
15. Miller JK, Shattuck DL, Ingalla EQ, Yen L, Borowsky AD, Young LJ, et al. Suppression of the negative regulator LRIG1 contributes to ErbB2 overexpression in breast cancer. Cancer Res 2008;68:
8286-94.
16. Thomasson M, Wang B, Hammarsten P, Dahlman A, Persson JL, Josefsson A, et al. LRIG1 and the liar paradox in prostate cancer:
a study of the expression and clinical significance of LRIG1 in prostate cancer. Int J Cancer 2011;128:2843-52.
17. Lu L, Teixeira VH, Yuan Z, Graham TA, Endesfelder D, Kolluri K, et al. LRIG1 regulates cadherin-dependent contact inhibition directing epithelial homeostasis and pre-invasive squamous cell carcinoma development. J Pathol 2013;229:608-20.
18. Shattuck DL, Miller JK, Laederich M, Funes M, Petersen H, Car- raway KL 3rd, et al. LRIG1 is a novel negative regulator of the Met receptor and opposes Met and Her2 synergy. Mol Cell Biol 2007;27:1934-46.
19. Sheu JJ, Lee CC, Hua CH, Li CI, Lai MT, Lee SC, et al. LRIG1 modulates aggressiveness of head and neck cancers by regulating EGFR-MAPK-SPHK1 signaling and extracellular matrix remod- eling. Oncogene 2014;33:1375-84.
20. Powell AE, Wang Y, Li Y, Poulin EJ, Means AL, Washington MK, et al. The pan-ErbB negative regulator Lrig1 is an intestinal stem cell marker that functions as a tumor suppressor. Cell 2012;149:
146-58.
21. Yi W, Haapasalo H, Holmlund C, Järvelä S, Raheem O, Bergen- heim AT, et al. Expression of leucine-rich repeats and immuno- globulin-like domains (LRIG) proteins in human ependymoma relates to tumor location, WHO grade, and patient age. Clin Neu- ropathol 2009;28:21-7.
22. Jansen B, Schlagbauer-Wadl H, Brown BD, Bryan RN, van Elsas A, Müller M, et al. bcl-2 antisense therapy chemosensitizes hu- man melanoma in SCID mice. Nat Med 1998;4:232-4.
23. Le Calvé B, Rynkowski M, Le Mercier M, Bruyère C, Lonez C, Gras T, et al. Long-term in vitro treatment of human glioblastoma cells with temozolomide increases resistance in vivo through up- regulation of GLUT transporter and aldo-keto reductase enzyme AKR1C expression. Neoplasia 2010;12:727-39.
24. Fedor HL, De Marzo AM. Practical methods for tissue microarray construction. Methods Mol Med 2005;103:89-101.
25. Fan QW, Cheng C, Knight ZA, Haas-Kogan D, Stokoe D, James CD, et al. EGFR signals to mTOR through PKC and independent- ly of Akt in glioma. Sci Signal 2009;2:ra4.
26. Martens T, Schmidt NO, Eckerich C, Fillbrandt R, Merchant M, Schwall R, et al. A novel one-armed anti-c-Met antibody inhibits glioblastoma growth in vivo. Clin Cancer Res 2006;12(20 Pt 1):
6144-52.
27. Cancer Genome Atlas Research Network. Comprehensive ge- nomic characterization defines human glioblastoma genes and core pathways. Nature 2008;455:1061-8.
28. Stommel JM, Kimmelman AC, Ying H, Nabioullin R, Ponugoti AH, Wiedemeyer R, et al. Coactivation of receptor tyrosine kinas- es affects the response of tumor cells to targeted therapies. Science 2007;318:287-90.
29. Hedman H, Nilsson J, Guo D, Henriksson R. Is LRIG1 a tumour suppressor gene at chromosome 3p14.3? Acta Oncol 2002;41:
352-4.
30. Goldoni S, Iozzo RA, Kay P, Campbell S, McQuillan A, Agnew C, et al. A soluble ectodomain of LRIG1 inhibits cancer cell growth by attenuating basal and ligand-dependent EGFR activity. Onco-
2341066, exhibits cytoreductive antitumor efficacy through antip- roliferative and antiangiogenic mechanisms. Cancer Res 2007;67:
4408-17.
radiosensitivity through Met inhibition in papillary thyroid cancer.
Mol Cancer Res 2010;8:1217-26.
48. Zou HY, Li Q, Lee JH, Arango ME, McDonnell SR, Yamazaki S, et al. An orally available small-molecule inhibitor of c-Met, PF-