Diagnostic Patterns in the Evaluation of Patients Presenting with Syncope at the Emergency or Outpatient Department
Gu Hyun Kang,
1Ju Hyeon Oh,
1June Soo Kim,
2Young Keun On,
2Hyoung Gon Song,
3Ik Joon Jo,
3Su Jin Kim,
4Su-Jin Bae,
4and Tae Gun Shin
51Division of Cardiology, Samsung Changwon Hospital, Sungkyunkwan University School of Medicine, Changwon;
2Department of Medicine, Cardiac and Vascular Center, 3Department of Emergency Medicine and
4Clinical Trial Center, Clinical Research Institute, Samsung Medical Center, Sungkyunkwan University School of Medicine, Seoul;
5Department of Medicine, Graduate School, Kyung Hee University, Seoul, Korea.
Received: April 4, 2011 Revised: July 18, 2011 Accepted: July 21, 2011
Co-corresponding authors: Dr. June Soo Kim, Department of Medicine, Cardiac and Vascular Center, Samsung Medical Center,
Sungkyunkwan University School of Medicine, 50 Irwon-dong, Gangnam-gu,
Seoul 135-710, Korea.
Tel: 82-2-3410-3414, Fax: 82-2-3410-3417 E-mail: [email protected] and Dr. Hyoung Gon Song,
Department of Emergency Medicine, Samsung Medical Center, Sungkyunkwan University School of Medicine, 50 Irwon-dong, Gangnam-gu, Seoul 135-710, Korea.
Tel: 82-2-3410-3414, Fax: 82-2-3410-3417 E-mail: [email protected]
∙ The authors have no financial conflicts of interest.
© Copyright:
Yonsei University College of Medicine 2012 This is an Open Access article distributed under the terms of the Creative Commons Attribution Non- Commercial License (http://creativecommons.org/
licenses/by-nc/3.0) which permits unrestricted non- commercial use, distribution, and reproduction in any medium, provided the original work is properly cited.
Purpose: Patterns of syncope evaluation vary widely among physicians and hospi- tals. The aim of this study was to assess current diagnostic patterns and medical costs in the evaluation of patients presenting with syncope at the emergency department (ED) or the outpatient department (OPD) of a referral hospital. Materials and Methods: This study included 171 consecutive patients with syncope, who visited the ED or OPD between January 2009 and July 2009. Results: The ED group had fewer episodes of syncope [2 (1-2) vs. 2 (1-5), p=0.014] and fewer prodromal symp- toms (81.5% vs. 93.3%, p=0.018) than the OPD group. Diagnostic tests were more frequently performed in the ED group than in the OPD group (6.2±1.7 vs. 5.3±2.0;
p=0.012). In addition, tests with low diagnostic yields were more frequently used in the ED group than in the OPD group. The total cost of syncope evaluation per pa- tient was higher in the ED group than in the OPD group [823000 (440000-1408000) won vs. 420000 (186000-766000) won, p<0.001]. Conclusion: There were some differences in the clinical characteristics of patients and diagnostic patterns in the evaluation of syncope between the ED and the OPD groups. Therefore, a selective diagnostic approach according to the presentation site is needed to improve diagnos- tic yields and to reduce the time and costs of evaluation of syncope.
Key Words: Syncope, diagnosis, cost-benefit analysis
INTRODUCTION
In the general population, syncope is frequently encountered during daily activi- ties. It is defined as a transient loss of consciousness due to transient global cere- bral hypoperfusion.1-3 It occasionally leads to serious medical problems such as se- vere physical injury or sudden cardiac death.4,5 Diverse diseases and factors are involved in the occurrence of syncope. Therefore, it is often difficult to diagnose the exact cause of syncope and often requires great expense to do so.1,2,6-8 Despite recently proposed clinical guidelines for the diagnosis of syncope,2,8,9 current pat- terns in the evaluation of patients with syncope vary widely among physicians and
ic tests such as the head-up tilt test (HUTT), the treadmill test (TMT), and Holter monitoring were also electively per- formed by referred professional doctors in the OPD.
Classification of the causes of syncope
Diagnosis was established based on previously described criteria:2,9 neural mediation, orthostatic hypotension, cardi- ac arrhythmia, as well as structural, cardiac, cerebrovascu- lar and unknown causes of syncope.
Statistical analysis
Statistical comparisons of continuous variables between the groups were made using the t-test or the non-parametric test for normal and abnormal distributions, respectively.
Comparison between proportions was made using the Pear- son’s Chi-square test. When the data had normal distribu- tions, they were presented as mean±SD. For abnormal dis- tributions, median (inter-quartile range) was used. A p-value of <0.05 was considered statistically significant. SPSS soft- ware for Windows (version 17.0, SPSS, Chicago, IL, USA) was used for all statistical analyses.
RESULTS
Clinical characteristics of total study subjects
A total of 171 patients were identified from January 1, 2009 to July 31, 2009. Seventy-six patients (44.4%) were male.
The mean age (±SD) of the patients was 42.3 (±17.9) years.
Hypertension was the most common underlying disease (n=31, 18.1%). Twenty-nine patients (17.0%) had a family history of syncope. The median number [interquartile rang- es (IQR)] of syncope was 2 (1-4). The median duration of syncope was 60 seconds (10-180). In addition, 150 (87.7%) of these 171 patients had prodromal symptoms. Twenty- five patients (14.6%) showed seizure-like movement during a syncopal episode. Physical injury developed in 77 (45.1%) patients during syncopal episodes, 9 (5.3%) of whom expe- rienced major traumas such as fractures or cerebral concus- sion. Of 171 patients, 56 (32.8%) had previously been eval- uated for syncope. Interestingly, the cause of syncope was diagnosed in only 5 (2.9%) of these 56 patients. Eighteen patients (10.5%) were admitted to the hospital for the eval- uation of syncope or major traumas following a syncopal episode. Sixty-five patients (38.0%) did not visit the outpa- tient clinic to complete the evaluation of syncope (Table 1).
Common prodromal symptoms were dizziness (49.1%), hospitals.5 Recently, there have been several reports that a
standardized-care pathway significantly improves diagnos- tic yields and reduces the rate of hospital admission and overall medical costs.3,5,10 Nevertheless, there were no clini- cal data available to evaluate the diagnostic patterns and medical costs in patients with syncope in South Korea.
The aim of this study was to assess the current diagnostic patterns and diagnostic yields of several tests, as well as overall medical costs in patients presenting with syncope at the emergency department (ED) or the outpatient depart- ment (OPD).
MATERIALS AND METHODS
Study population
Consecutive patients with syncope, who visited the ED or OPD of Samsung Medical Center, in Seoul, Korea, be- tween January 2009 and July 2009, were included in the study. Patients were excluded from the study if they did not have true syncopal episodes. A total of 171 patients were enrolled for this study. Of 171 patients, 62 were excluded from the assessment of diagnostic yields and medical costs of syncope evaluation because they did not undergo further diagnostic evaluations after the first visit. Two patients were also excluded from the assessment because their causes of syncope were previously diagnosed before the first visit.
Three other patients were also excluded for both the afore- mentioned reasons. Therefore, 104 patients were eligible for the assessment of diagnostic yields and medical costs of syncope evaluation. The study was approved by the Re- gional Committee for Ethnics in Medical Research.
Evaluation of syncope
Patients who visited the ED or OPD with syncopal episodes were being evaluated without established, standardized guidelines for syncope evaluation. At the ED, emergency physicians first investigated the cause of syncope through history taking, physical examinations, blood tests, chest X- ray (CXR) and electrocardiography (ECG). Thereafter, they contacted either a fellowship neurologist or cardiologist, who then decided on the admission or referral to OPD of patients.
Neurologists performed a neurologic physical exam as well as brain computerized tomography (CT) and magnetic reso- nance imaging (MRI), if needed, at the ED. However, specif- ic tests such as electroencephalography were performed in the OPD by referred professional doctors. Specific cardiolog-
up loss before completing the evaluation of syncope (49.4%
vs. 27.8%, p=0.004) than the OPD group (Table 1).
The ED group showed fewer prodromal symptoms, such as pallor (6.2% vs. 20.0%, p=0.008), palpitation (1.2% vs.
20.0%, p<0.01) and abdominal pain (3.7% vs. 14.4%, p=
0.018) than the OPD group (Table 2).
Causes of syncope in total study subjects
The most common cause of syncope was a neurally mediat- nausea (34.5%), visual change (25.7%), and cold sweating
(24.6%) (Table 2).
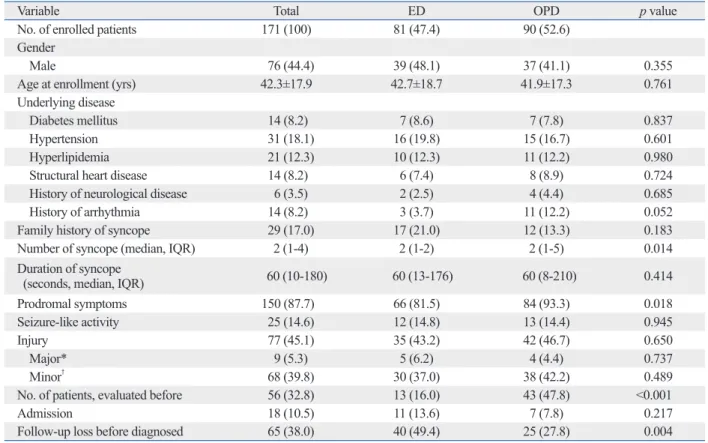
Comparison of clinical characteristics between the ED and OPD groups
The ED group had less frequent episodes of syncope [2 (1- 2) vs. 2 (1-5), p=0.014], fewer prodromal symptoms (81.5%
vs. 93.3%, p=0.018), fewer previous evaluations of synco- pe (16.0% vs. 47.8%, p<0.001), and more frequent follow- Table 1. Clinical Characteristics of Study Subjects
Variable Total ED OPD p value
No. of enrolled patients 171 (100) 81 (47.4) 90 (52.6)
Gender
Male 76 (44.4) 39 (48.1) 37 (41.1) 0.355
Age at enrollment (yrs) 42.3±17.9 42.7±18.7 41.9±17.3 0.761
Underlying disease
Diabetes mellitus 14 (8.2) 7 (8.6) 7 (7.8) 0.837
Hypertension 31 (18.1) 16 (19.8) 15 (16.7) 0.601
Hyperlipidemia 21 (12.3) 10 (12.3) 11 (12.2) 0.980
Structural heart disease 14 (8.2) 6 (7.4) 8 (8.9) 0.724
History of neurological disease 6 (3.5) 2 (2.5) 4 (4.4) 0.685
History of arrhythmia 14 (8.2) 3 (3.7) 11 (12.2) 0.052
Family history of syncope 29 (17.0) 17 (21.0) 12 (13.3) 0.183
Number of syncope (median, IQR) 2 (1-4) 2 (1-2) 2 (1-5) 0.014
Duration of syncope
(seconds, median, IQR) 60 (10-180) 60 (13-176) 60 (8-210) 0.414
Prodromal symptoms 150 (87.7) 66 (81.5) 84 (93.3) 0.018
Seizure-like activity 25 (14.6) 12 (14.8) 13 (14.4) 0.945
Injury 77 (45.1) 35 (43.2) 42 (46.7) 0.650
Major* 9 (5.3) 5 (6.2) 4 (4.4) 0.737
Minor† 68 (39.8) 30 (37.0) 38 (42.2) 0.489
No. of patients, evaluated before 56 (32.8) 13 (16.0) 43 (47.8) <0.001
Admission 18 (10.5) 11 (13.6) 7 (7.8) 0.217
Follow-up loss before diagnosed 65 (38.0) 40 (49.4) 25 (27.8) 0.004
ED, emergency department; OPD, outpatient department; IQR, interquartile ranges.
Data are presented as n (%) or mean±SD or interquartile ranges.
*Major injury: fracture, cerebral concussion.
†Minor injury: bruise, laceration, scratch, etc.
Table 2. Comparison of Prodromal Symptoms between the ED and OPD Groups
Symptoms (%) Total (n=171) ED (n=81) OPD (n=90) p value
Dizziness 84 (49.1) 40 (49.4) 44 (48.9) 0.949
Nausea 59 (34.5) 28 (34.6) 31 (34.4) 0.986
Visual change 44 (25.7) 17 (21.0) 27 (30.0) 0.178
Cold sweating 42 (24.6) 15 (18.5) 27 (30.0) 0.082
Chest discomfort 25 (14.6) 7 (8.6) 18 (20.0) 0.05
Pallor 23 (13.5) 5 (6.2) 18 (20.0) 0.008
Palpitation 19 (11.1) 1 (1.2) 18 (20.0) <0.001
Weakness 17 (9.9) 5 (6.2) 12 (13.3) 0.118
Abdominal pain 16 (9.4) 3 (3.7) 13 (14.4) 0.016
Headache 11 (6.4) 5 (6.2) 6 (6.7) 0.895
ED, emergency department; OPD, outpatient department.
shorter [4 (1-28) vs. 35 (17-44) days; p<0.001] in the ED group than in the OPD group. However, the mean number of tests performed was larger (6.2±1.7 vs. 5.3±2.0; p=
0.012) in the ED group than in the OPD group (Table 3).
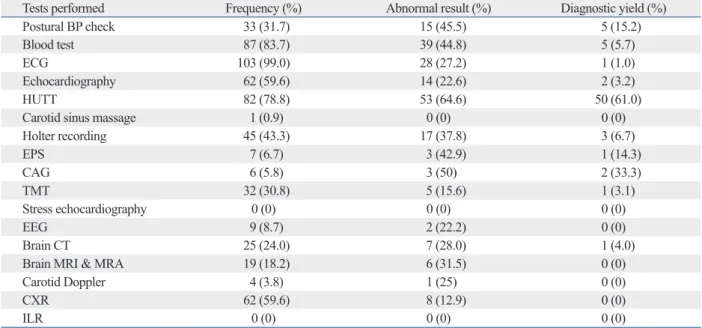
Diagnostic yields of tests for syncope evaluation
The following methods were used to evaluate the patients:
ECG in 99.0%, blood tests in 83.7%, HUTT in 78.8%, echocardiography in 59.6%, and CXR in 59.6% of the pa- tients. However, the diagnostic yields of these tests were very low except for HUTT. HUTT showed a higher diag- nostic yield (61%) than the other tests. Carotid sinus mas- sage and orthostatic blood pressure measurement, which are simple and important diagnostic tools, were used in only 0.96% and 31.7% of the patients, respectively. Moreover, ed etiology, which was identified in 59 patients (55.7%). Or-
thostatic hypotension was identified in 15 patients (14.2%).
However, the cause of syncope was not identified in 22 pa- tients (20.8%) even though they underwent further diagnos- tic evaluations after the first visit (Table 3).
Comparison of causes of syncope between the ED and OPD groups
The ED group showed a lower proportion of neurally medi- ated syncope (48.8% vs. 61.9%, p=0.187) and a higher pro- portion of orthostatic syncope (22.0% vs. 9.5%, p=0.078) than the OPD group. However, there was no statistically significant difference in the cause of syncope between the ED and OPD groups (Table 3).
The median duration for the diagnosis of syncope was
Table 3. Comparison of the Causes of Syncope between the ED and OPD Groups
Total (n=104) ED (n=41) OPD (n=63) p value
Final diagnosis
Neurally mediated 59 (55.7) 20 (48.8) 39 (61.9) 0.187
Orthostatic 15 (14.2) 9 (22.0) 6 (9.5) 0.078
Arrhythmia 3 (2.8) 0 3 (4.8) 0.277
Structural cardiac 4 (3.8) 3 (7.3) 1 (1.6) 0.298
Cerebrovascular 1 (0.9) 1 (2.4) 0 0.394
Unexplained syncope 22 (20.8) 8 (19.5) 14 (22.2) 0.741
Days for diagnosis (median, IQR) 25 (3-41) 4 (1-28) 35 (17-44) <0.001
Number of tests performed 5.6±1.9 6.2±1.7 5.3±2.0 0.012
ED, emergency department; OPD, outpatient department; IQR, interquartile ranges.
Data are presented as n (%) or mean±SD or interquartile ranges.
Table 4. Patterns and Results of Diagnostic Tests in Syncope Evaluation (n=104)
Tests performed Frequency (%) Abnormal result (%) Diagnostic yield (%)
Postural BP check 33 (31.7) 15 (45.5) 5 (15.2)
Blood test 87 (83.7) 39 (44.8) 5 (5.7)
ECG 103 (99.0) 28 (27.2) 1 (1.0)
Echocardiography 62 (59.6) 14 (22.6) 2 (3.2)
HUTT 82 (78.8) 53 (64.6) 50 (61.0)
Carotid sinus massage 1 (0.9) 0 (0) 0 (0)
Holter recording 45 (43.3) 17 (37.8) 3 (6.7)
EPS 7 (6.7) 3 (42.9) 1 (14.3)
CAG 6 (5.8) 3 (50) 2 (33.3)
TMT 32 (30.8) 5 (15.6) 1 (3.1)
Stress echocardiography 0 (0) 0 (0) 0 (0)
EEG 9 (8.7) 2 (22.2) 0 (0)
Brain CT 25 (24.0) 7 (28.0) 1 (4.0)
Brain MRI & MRA 19 (18.2) 6 (31.5) 0 (0)
Carotid Doppler 4 (3.8) 1 (25) 0 (0)
CXR 62 (59.6) 8 (12.9) 0 (0)
ILR 0 (0) 0 (0) 0 (0)
BP, blood pressure; ECG, electrocardiogram; HUTT, head-up tilt test; EPS, electrophysiologic study; CAG, coronary angiography; TMT, treadmill test; CT, computerized tomography; MRI, magnetic resonance imaging; MRA, magnetic resonance angiography; CXR, chest X-ray; ILR, implantable loop recorder;
EEG, electroencephalography.
won (Table 5).
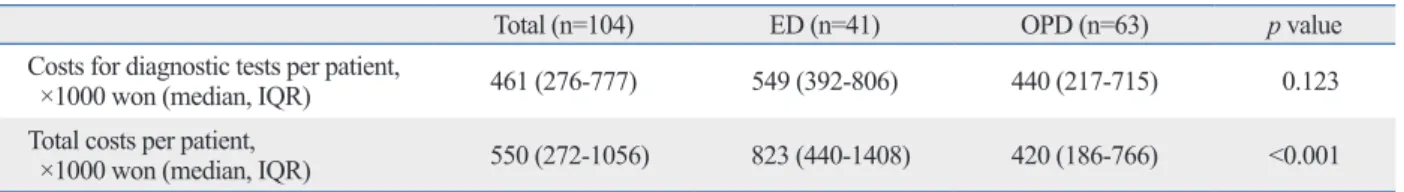
Comparison of medical costs of syncope evaluation between ED and OPD groups
Although there was no statistical significance, the cost per patient for diagnostic tests demonstrated a tendency to be more expensive in the ED group than the OPD group [549000 (392000-806000) won vs. 440000 (217000-715000) won, p=0.123]. Moreover, the total cost per patient was higher in the ED group than in the OPD group [823000 (440000-1408000) won vs. 420000 (186000-766000) won, p<0.001] (Table 5).
DISCUSSION
Our results showed that some clinical characteristics of pa- tients with syncope were significantly different between the ED and OPD groups. The ED group had less frequent epi- sodes of syncope [2 (1-2) vs. 2 (1-5), p=0.014]; fewer pro- dromal symptoms, especially chest discomfort, pallor, pal- pitation and abdominal pain (81.5% vs. 93.3%, p=0.018);
and fewer previous evaluations of syncope (16.0% vs. 47.8%, p<0.001). These differences in clinical characteristics could be related with different causes of syncope between the two expensive tests with low diagnostic yields, such as brain CT
and MRI, were performed in 24.0% and 18.2% of the pa- tients, respectively. Invasive tests, such as coronary angiog- raphy and electrophysiologic studies were performed in only 5.8% and 6.7% of all patients, respectively. However, they showed higher diagnostic yields (33.3% and 14.3%) than the other tests. Implantable loop recorders were not used to evaluate the cause of syncope in any of the patients in the study population (Table 4).
Comparison of frequently performed tests between the ED and OPD groups
Commonly used diagnostic tests were different between the ED and OPD groups. In the ED group, ECG, blood test, CXR, postural blood pressure measurement, and brain CT were more commonly used. However, HUTT, echocardiog- raphy, Holter recording, and TMT were more commonly used in the OPD group (Fig. 1).
Medical costs for syncope evaluation in total study subjects
The median medical cost for diagnostic tests per patient was 461000 (267000-777000) won. The median total cost, which included the costs for diagnostic tests, outpatient clin- ic visit, and hospitalization, was 550000 (272000-1056000)
Table 5. Medical Costs for Syncope Evaluation (n=104)
Total (n=104) ED (n=41) OPD (n=63) p value
Costs for diagnostic tests per patient,
×1000 won (median, IQR) 461 (276-777) 549 (392-806) 440 (217-715) 0.123
Total costs per patient,
×1000 won (median, IQR) 550 (272-1056) 823 (440-1408) 420 (186-766) <0.001
IQR, interquartile ranges; ED, emergency department; OPD, outpatient department.
Data are presented in interquartile ranges.
Fig. 1. Comparison of frequently performed tests between the ED and OPD groups (n=171). ED, emergency department; OPD, outpatient department; BP, blood pressure; ECG, electrocardiogram; HUTT, head up tilt test; TMT, treadmill test; CT, computerized tomography; MRI, magnetic resonance imaging; CXR, chest X-ray.
0 10 20 30 40 50 60 70 80 90 100
Performed test (%)
ECG Blood test CXR Postural BP
check Brain CT Echocar-
diography HUTT Holter
recording TMT Brain MRI
100 100
81.7 80.5
56.1 42.7 34.1
13.4 12.2 9.8
95.6
62.6
33 2.2 4.4
50.5
78
49.5
28.6
11 ED group OPD group
quantitative history alone. This may be a result of insuffi- cient documentation of patient medical history.
Several previous studies have assessed the diagnostic yields of tests and medical costs for the evaluation of syn- cope patients.1,12,13 Pires, et al.1 reported that neurologic tests with low diagnostic yields were overused and cardio- vascular tests with high diagnostic yields were underused.
Steinberg and Knilans12 showed that only 4% of tests per- formed were helpful in diagnosing the cause of syncope in pediatric populations and that the average costs for the evaluation of syncope per patient reached almost 7000 U.S.
dollars. Brignole, et al.14 revealed that the average costs for the evaluation of syncope were 1753 euros, which was nearly 5 times more expensive than that of our study popu- lation.
In order to make syncope evaluation systematic, several studies have published guidelines for the evaluation of syn- cope.2,3,5,8-10,14,15 In these studies, the efficacy of a guideline- based evaluation of patients with syncope was assessed in terms of diagnostic yields and medical costs. They conclud- ed that the guideline-based approach improved overall clin- ical results, such as diagnostic yields, duration of hospital stay and medical costs of syncope management. Brignole, et al.14 performed a prospective systematic guideline-based evaluation on patients referred to the EDs of 11 general hos- pitals. In their study, a high compliance rate to the guidelines of 86% was noted. A definite diagnosis was established in 98% of the patients, hospitalization was appropriate in 25%
of the patients, and the median in-hospital stay (IQR) was 5.5 (3-9) days. The EGSYS-2 group established a standard- ized care pathway for syncope patients according to the guidelines of the European Society of Cardiology (ESC) and compared the data to syncope patients who were not managed according to this pathway.5 Overall, the standard- ized-care group had a lower hospitalization rate, shorter in- hospital stay and fewer tests performed per patient than the general-care group. Neurally mediated and orthostatic syn- cope were diagnosed more frequently, whereas fewer pa- tients had a diagnosis of unexplained syncope when evalu- ated according to the standardized-care pathway. The mean costs per patient and the mean costs per diagnosis were 19% and 29% lower in the standardized-care group than the general-care group, respectively. Ammirati, et al.10 dem- onstrated that the use of a syncope unit based on the 2004 ESC guidelines allows for improved management of pa- tients with syncope. Shen, et al.15 have shown that the syn- cope unit significantly improves diagnostic yields in the ED groups. Particularly, there was an increased tendency for
neurally mediated syncope in the OPD group than in the ED group (61.9% vs. 48.8%, p=0.187). In contrast, ortho- static syncope was more frequently documented in the ED group than in the OPD group (22.0% vs. 9.5%, p=0.078).
In our study, diagnostic evaluation was more difficult to discern in the ED group because they had greater follow-up loss before completing evaluation of syncope (49.4% vs.
27.8%, p=0.004) than the OPD group.
Tests with low diagnostic yields were commonly per- formed on the study population. Simple but important tests, such as carotid sinus massage and orthostatic blood pres- sure measurement, were not frequently used. Moreover, ex- pensive tests with low diagnostic yields, such as brain CT and MRI, were performed on 24.0% and 18.2% of the pa- tients, respectively. Invasive tests, such as coronary angiog- raphy and electrophysiologic study, were performed only in 5.8% and 6.7% of the patients, respectively; however, they showed higher diagnostic yields (33.3% and 14.3%, respec- tively) than other tests. Interestingly, the implantable loop recorder, which is a very useful tool for diagnosing unex- plained syncope, was not used in this study.
In the comparison between the ED and OPD groups, ECG and echocardiography were performed in patients at a similar proportion between the 2 groups. However, useful tests with high diagnostic yields, such as HUTT, were per- formed more frequently in the OPD group. In contrast, ex- pensive tests with low diagnostic yield, such as brain CT, were performed more frequently in the ED group. In other words, the overall efficiency of tests performed was lower in the ED group than in the OPD group.
The costs for diagnostic tests per patient did not show statistically significant difference between the ED and OPD groups [549000 (392000-806000) won vs. 440000 (217000- 715000) won, p=0.123). However, there was a tendency for greater expense in the ED group. Moreover, the total costs per patient were higher in the ED group than in the OPD group [823000 (440000-1408000) won vs. 420000 (186000- 766000) won, p<0.001]. This was likely influenced by ex- pensive testing such as brain CT which was preformed more frequently in the ED group and higher admission rates although there was no statistical significance.
Nevertheless, Sheldon, et al.11 reported that historical fea- tures can distinguish vasovagal syncope from syncope of other causes with very high sensitivity and specificity. Just 28 patients (47.5%) among 59 neurally mediated syncope patients in this study were able to be diagnosed based on
temporal trends in the evaluation of adult patients hospitalized with syncope. Arch Intern Med 2001;161:1889-95.
2. Moya A, Sutton R, Ammirati F, Blanc JJ, Brignole M, Dahm JB, et al. Guidelines for the diagnosis and management of syncope (version 2009). Eur Heart J 2009;30:2631-71.
3. Chen LY, Benditt DG, Shen WK. Management of syncope in adults: an update. Mayo Clin Proc 2008;83:1280-93.
4. Kapoor WN, Karpf M, Wieand S, Peterson JR, Levey GS. A pro- spective evaluation and follow-up of patients with syncope. N Engl J Med 1983;309:197-204.
5. Brignole M, Ungar A, Bartoletti A, Ponassi I, Lagi A, Mussi C, et al. Standardized-care pathway vs. usual management of syncope patients presenting as emergencies at general hospitals. Europace 2006;8:644-50.
6. Kapoor WN. Evaluation and outcome of patients with syncope.
Medicine (Baltimore) 1990;69:160-75.
7. Kapoor WN, Karpf M, Maher Y, Miller RA, Levey GS. Syncope of unknown origin. The need for a more cost-effective approach to its diagnosis evaluation. JAMA 1982;247:2687-91.
8. Brignole M. Diagnosis and treatment of syncope. Heart 2007;93:
130-6.
9. Brignole M, Alboni P, Benditt DG, Bergfeldt L, Blanc JJ, Thom- sen PE, et al. Guidelines on management (diagnosis and treat- ment) of syncope-update 2004. Executive Summary. Eur Heart J 2004;25:2054-72.
10. Ammirati F, Colaceci R, Cesario A, Strano S, Della Scala A, Col- angelo I, et al. Management of syncope: clinical and economic impact of a Syncope Unit. Europace 2008;10:471-6.
11. Sheldon R, Rose S, Connolly S, Ritchie D, Koshman ML, Fren- neaux M. Diagnostic criteria for vasovagal syncope based on a quantitative history. Eur Heart J 2006;27:344-50.
12. Steinberg LA, Knilans TK. Syncope in children: diagnostic tests have a high cost and low yield. J Pediatr 2005;146:355-8.
13. Suzuki T, Matsunaga N, Kohsaka S. Diagnostic patterns in the evaluation of patients hospitalized with syncope. Pacing Clin Electrophysiol 2006;29:1240-4.
14. Brignole M, Menozzi C, Bartoletti A, Giada F, Lagi A, Ungar A, et al. A new management of syncope: prospective systematic guideline-based evaluation of patients referred urgently to general hospitals. Eur Heart J 2006;27:76-82.
15. Shen WK, Decker WW, Smars PA, Goyal DG, Walker AE, Hodge DO, et al. Syncope Evaluation in the Emergency Department Study (SEEDS): a multidisciplinary approach to syncope manage- ment. Circulation 2004;110:3636-45.
and reduces hospital admission rates and the total length of hospital stay without affecting recurrent syncope and all- cause mortality among intermediate-risk patients.
The medical costs of syncope evaluation are cheaper in South Korea than in Western countries. In addition, the pro- portion of unknown origin after diagnostic evaluation of syncope was higher in South Korea than in Western coun- tries, because most patients were not evaluated by standard- ized guidelines and implantable loop recorders were not used in the evaluation of syncope.
In conclusion, there were some differences in the clinical characteristics of patients presenting at the ED and the OPD.
Diagnostic patterns in the evaluation of syncope were also different between both groups. Therefore, a selective diag- nostic approach according to the presentation site is needed to improve diagnostic yields and to reduce the time and costs of evaluation of syncope.
Study limitations
This study was performed at a single tertiary referral hospi- tal rather than in the community. Therefore, the results of this study may not sufficiently reflect the current patterns of syncope evaluation throughout South Korea.
ACKNOWLEDGEMENTS
This study was supported by the Samsung Medical Center Clinical Research Development Program grant # CRS-109- 35-2.
REFERENCES
1. Pires LA, Ganji JR, Jarandila R, Steele R. Diagnostic patterns and