1)
1. Introduction
Due to the advancement of industrialization on a global scale and development of industry, the energy demand is elevated and is considered to be a major
※ This work was supported by the Korea Institute of Energy Technology Evaluation and Planning (KETEP) and the Ministry of Trade, Industry
& Energy (MOTIE) of the Republic of Korea (No. 20172010000730).
† 준 회 원 : 순천대학교 정보통신멀티미디어공학부 박사과정
†† 비 회 원 : (주)엘시스 전무
††† 정 회 원 : 순천대학교 정보통신멀티미디어공학부 교수 Manuscript Received : December 31, 2019 First Revision : February 27, 2020 Accepted : March 18, 2020
* Corresponding Author : Yongyun Cho([email protected])
concern in national policy [1]. Furthermore, economic growth and human development also add to the rapid growth of energy consumption [2]. The Unregulated use of energy like over-consumption, poor infrastructure, and energy waste are the causes of such an outcome [3]. Among the demanders of different sources of energy, Streimikiene forecasts a significant proportion of residential energy usage by 2030 [4]. As seen by Zuo, Energy consumptions in buildings cover 39 per cent of the total energy consumption of the United States [5].
In South Korea, production industry has begun to evolve at an elevated pace since the 1990s and has become the primary pushing power with the fast
An Energy Consumption Prediction Model for Smart Factory Using Data Mining Algorithms
Sathishkumar V E
†⋅Myeongbae Lee
†⋅Jonghyun Lim
†⋅Yubin Kim
††⋅ Changsun Shin
†††⋅Jangwoo Park
†††⋅Yongyun Cho
†††ABSTRACT
Energy Consumption Predictions for Industries has a prominent role to play in the energy management and control system as dynamic and seasonal changes are occurring in energy demand and supply. This paper introduces and explores the steel industry's predictive models of energy consumption. The data used includes lagging and leading reactive power lagging and leading current variable, emission of carbon dioxide (tCO2) and load type. Four statistical models are trained and tested in the test set: (a) Linear Regression (LR), (b) Radial Kernel Support Vector Machine (SVM RBF), (c) Gradient Boosting Machine (GBM), and (d) Random Forest (RF). Root Mean Squared Error (RMSE), Mean Absolute Error (MAE) and Mean Absolute Percentage Error (MAPE) are used for calculating regression model predictive performance. When using all the predictors, the best model RF can provide RMSE value 7.33 in the test set.
Keywords : Energy Consumption, Data Mining, Random Forest, Linear Regression, Gradient Boosting Machine, Support Vector Machine
데이터 마이닝 기반 스마트 공장 에너지 소모 예측 모델
Sathishkumar V E
†⋅이 명 배
†⋅임 종 현
†⋅김 유 빈
††⋅신 창 선
†††⋅박 장 우
†††⋅조 용 윤
†††요 약
산업용 에너지 소비 예측은 에너지 수요와 공급에 동적이고 계절적인 변화가 있기 때문에 에너지 관리 및 제어 시스템에서 중요한 위치를 차지한다. 본 논문은 철강 산업의 에너지 소비 예측 모델을 제시하고 논의한다. 사용되는 데이터에는 후행 및 선도적인 전류 반응 전력, 후행 및 선도적인 전류 동력 계수, 이산화탄소(TCO2) 배출 및 부하 유형이 포함된다. 테스트 세트에서는 (a) 선형 회귀(LR), (b) 방사형 커널(SVM RBF), (c) Gradient Boosting Machine (GBM), (d) 무작위 포리스트(RF). 평균 제곱 오차(RMSE), 평균 절대 오차(MAE) 및 평균 절대 백분율 오차(ME)의 네 가지 통계 모델을 사용하여 예측하고 평가한다. 회귀 설계의 효율성 모든 예측 변수를 사용할 때 최상의 모델 RF는 테스트 세트에서 RMSE 값 7.33을 제공할 수 있다.
키워드 : 에너지 소모량, 데이터 마이닝, 램던 포레스트, 선형회귀, 점진적 부스팅 머신, 서포트 벡터 머신
※ This is an Open Access article distributed under the terms of the Creative Commons Attribution Non-Commercial License (http://creativecommons.org/ licenses/by-nc/3.0/)
which permits unrestricted non-commercial use, distribution, and reproduction in any medium, provided the original work is properly cited.
economic development continuing in South Korea.
In the 1990s, primary power usage grew at an annualized pace of 7.5%, which in the same era was greater than the annualized financial development level of 6.5%. This is due to strong development in energy-intensive sectors, including petrochemical sectors. The strong increase in industrial electricity consumption helped to boost the reduction of energy conversion, which further subverted energy intensity.
The increase in energy production after 2009 significantly buffered the country against the global financial crisis but adversely affected the overall energy efficiency of the country [6]. The energy consumption of the industries is impacted by several unstable variables, like industrial structure, level of technology, cost of energy, financial scale and national policy.
Research and industrial practice draw primary concern in forecasts related to energy resource and planning issues, which is resulted due to the increasing issues of oil and coal shortages. Making fair use of by-product gasses in the steel industry demands scheduling operators to be aware of the quantity of real-time generation, usage and storage. The accurate prediction of these units of energy flow provides a useful guide for their planning and distribution. The iron and steel industries are always energy-intensive, covering 10% of the full industry's energy consumption.
Recently, with the rising energy resource shortage, the energy supply condition in the iron and steel industries has become highly challenging. Establishing an energy-saving plan is a common task that can be achieved in areas such as technological development, refurbishing of equipment and improving management.
When oil prices increase, the cost of consuming energy is 10-20 times higher than that of the total production of the iron and steel industries. High energy consumption results in higher prices for the iron and steel products which lead to increased pollution and emissions. To this end, several steps, such as improving the production framework and accelerating the improvement and advancement of power saving and discharge reducing techniques, are required to ensure efficient energy supply in the manufacturing industry in South Korea.
Due to the hiking population and economic growth, over the past decades, energy consumption has increased significantly around the world. Energy
is viewed as a significant factor in the social and eco- nomic development of a nation, and thus in prosper- ity of the individuals [7]. Long time energy utilization predictions are noteworthy and are required for ca- pacity extension studies, capital consumption in en- ergy supply systems, income examination and rev- enue analysis. Still, the enormous number of vulner- abilities that portray long term forecasts regularly ex- tending as long as 30 years ahead of time, bringing about the healthy interest of researchers and the steady rise of new strategies for exact and reliable predictions.
Rest of the paper is structured as follows. Section 2 describes the previous energy consumption studies in different sectors. Section 3 displays the data description used in the paper. Section 4 discusses the suggested energy consumption prediction models.
The results of the comparison test for the performance of the suggested models are mentioned in Section 5.
Section 6 gives the conclusion.
2. Related Works
Multiple studies are carried out for the prediction of energy demand referred to in Section 1. Statistical techniques are used in the past primarily to predict demand for energy. Munz et al. used clustering of k-means to predict the irregular pattern in time series [8]. To predict energy consumption, Kandananond used different methods, which are autoregressive integrated moving average (ARIMA), artificial neural network (ANN) and multiple linear regression (MLR).
Cauwer et al. proposed to use a statistical model and the physical concepts behind it to estimate energy con- sumption [9, 10]. Statistical techniques have limited efficiency owing to unusual patterns of energy de- mand, and many prediction models are investigated through machine learning methods, level of technology, cost of energy, financial scale and national policy.
Dong et al. implemented SVM with consumption and weather data to predict the energy requirements for buildings [11]. Gonzalez and Zamarreno forecast the upcoming temperature from the current temper- ature using a feedforward neural network (NN), and with their difference predicted the necessity [12].
Ekici and Aksoy predict the building energy requirements,
with building properties excluding environmental
conditions [13]. Li et al. used SVM to estimate the
yearly energy demand using the building's transfer coefficient[14]. However, these works only developed models to predict the correct value corresponding to the input, leaving no basis for the input characteristics to influence. Using a fuzzy c- means clustering and predicted demand with fuzzy SVM[15], Xuemei et al.
set the condition for estimating energy consumption to fix this issue. Ma predicted energy consumption using the inputs of MLR model with particular pop- ulation behaviors, unforeseen events and weather con- dition [16]. Technology degree, energy prices, the fi- nancial scale and national policies.
While the aforementioned studies identified the state and predicted future use based on it, classi- fication of the state was lacking in the system. A long-term energy consumption prediction is suggested in by using a granular computing approach integrating industrial-driven semantics and granulating initial data based on the specificity of manufacturing proc- esses [17]. The authors used real-world industrial en- ergy data from a Chinese steel plant to assess the efficiency of the proposed method. The findings re- veal that the method proposed is better compared to some other data-driven methods. Also, it can fulfil the needs of the practically viable prediction.
Support vector machine (SVM) classifier is intended to predict the ironmaking process energy consumption level in [18]. To boost the precision of optimizing SVM parameters, particle swarm optimization (PSO) was implemented. Through the examination for the energy consuming framework in ironmaking process to accurately model the prediction problem, the im- proved SVM algorithm was suggested. And, the ex- perimental study was carried out on the basis of practical information from a Chinese Iron & Steel company. The proposed method can predict the en- ergy consumption of the ironmaking process with adequate precision. On the basis of the Gray system theory, a homologous gray prediction model with one parameter and one first order equation (HGEM (1,1)) is proposed to estimate total Chinese production energy consumption [19]. Using this model, they forecast China's manufacturing industry's complete energy utilization over the years 2018–2024. The findings indicate that Chinese manufacturing's complete energy consumption slows down but is still too massive.
A prediction of energy consumption and green-
house emissions for India's pig iron manufacturing organization are discussed, as executives are charg- ed with understanding the present and future trends of these smarter environmental policy measures [20].
The Autoregressive Integrated Moving Average (ARIMA) reveals, for predictive purposes, that ARIMA (1,0,0)×
(0,1,1) is the optimum energy consumption predictor.
ARIMA (0,1,4)(0,1,1) is the finest equipped config- uration of greenhouse emissions. For both cases the predictions are comparable to those of the seasonal random trend model, yet appear clearer as the sea- sonal trend and pattern d for both energy con- sumption and GHG emissions is essentially averaged.
[21] discusses the generic model for the power-con- suming device specification. A tree-based composi- tional approach encourages arbitrary levels depend- ent on machine structure, or external factors such as company policies. This technique is very ex- tensible because the models are embedded in ontology. Secondly, for each structural level a meth- odology is proposed for static and dynamic model- ing of the power consumption. You can make the prediction based on the model. Furthermore, an in- stance is given for implementing and predicting a continuous casting machine process.
A detailed overview of the works carried out in the area of energy consumption is given in the above studies. Data mining approaches have easy and precise methodology of learning among the methods used in the energy consumption field. Four data mining algo- rithms such as Linear Regression (LR), Vector Support System with Radial Base Kernel (SVM), Gradient Boosting System (GBM) and Random Forest (RF) are used to estimate energy usage in the industry.
3. Data Description for Energy Consumption Analysis
The data is gathered from DAEWOO steel company in Gwangyang city, South Korea. The Industry pro- duces several kinds of the coil, steel sheets and iron plates. The data on energy consumption is filed on the website of the Korea Electric Power Corporation (pccs.kepco.go.kr).
This analysis focuses on energy usage (Kwh) information recorded for the industry every 1 hour.
The data period is 365 days (2018, 12 months). Table
1 provides the load type and timing of each month.
Load Type June-August
March-May, September-
October
November- February
Light Load 23:00-09:00 23:00-09:00 23:00-09:00
Medium Load
09:00-10:00 12:00-01:00 17:00-23:00
09:00-10:00 12:00-01:00 17:00-23:00
09:00-10:00 12:00-07:00 20:00-22:00
Maximum Load 10:00-12:00 01:00-17:00
10:00-12:00 01:00-17:00
10:00-12:00 17:00-20:00 22:00-23:00
Table 1. Load Type and Its Timings
Since the steel industry in open space and has no heaters or cooling facilities, the temperature variables have no impact on energy consumption. The over- view of the full dataset is shown in Table 2.
Data Variables Type Measurement Industry Energy
Consumption Continuous KWh
Hour of the Day Continuous Hour Lagging Current
Reactive Power Continuous KVarh Leading Current
Reactive Power
Continuous
KVarh Lagging Current power
Factor Continuous %
Leading Current Power
Factor Continuous %
tCO2 (CO2) Continuous Ppm Week Status Categorical (Weekend (0) or a
Weekday (1)) Day of Week (Monday
Tuesday, Wednesday, Thursday, Friday, Saturday, Sunday)
Categorical Sunday, Monday ….
Saturday
Load Type Categorical Light Load, Medium Load, Maximum Load
Table 2. Data Variables and Description
Certain added features are created from the date/
time factor, which consists of dNumber of seconds each day from midnight(NSM), weekend or week day status, and day of the week. Fig. 1 displays the energy consumption profile over the interval, and displays elevated variability.
For five consecutive weeks, an hourly heat map is produced to identify any time trends, and shown in Fig. 2. This shows that the steel industry's energy consumption trend has a powerful time component.
During the weekend, energy usage is lower than at the other days. Energy usage continues to grow from 8 a.m. Then holds it up until 8 p.m.
4. Evaluation Indices
The performance of the regression model is eval- uated using different assessment parameters. Root Mean Squared Error (RMSE), Mean Absolute Error (MAE) and Mean Absolute Percentage Error (MAPE) are the performance measurement indices used here.
Root mean squared error (RMSE) is the standard de- viation of the sample between the observed value and the predicted one. Using these metrics, large er- rors can be identified and variability of the model response can be assessed with respect to variance.
RMSE is a scale-dependent calculation which results in the same unit measurement values. RMSE is de- termined using Equation (1).
Fig. 1. Steel Industry Energy Consumption Measurement for 1 Year
Fig. 2. First Five Weeks Hourly Steel Industry Energy
Consumption Heat-map
(1)
Mean absolute error (MAE) is used to evaluate the acuteness of the prediction. MAE is a scale-dependent metric which effectively represents prediction error by minimizing the offset between positive and negative errors. We can calculate MAE using the equation below.
(2)
The mean absolute percentage error (MAPE) is the mean or average of forecast errors in the absolute percentage. Error is defined as the actual or observed value without the forecast value. Percentage errors are summed up irrespective of signing for MAPE estimation. Since it gives an error in terms of per- centages, this measure is fairly easy to grasp Further- more, since absolute percentage errors are used, the issue of equally cancelling positive and negative errors is prevented. MAPE, therefore, has a man- agerial appeal and is a measure that is generally used in forecasting. If MAPE is smaller, it indicates a better forecast.
(3)
Here, Y
iis the actual measurement value,
is the value predicted,
is the sample average, and n is the sample size.
5. Model Selection
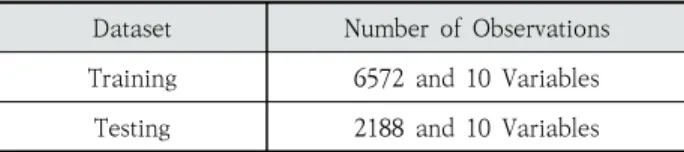
The entire one-year data set is divided into training and test validation. In model training, 75%
of the data is utilized and 25% in testing purposes.
The figures are shown in Table 3.
It is essential to find optimal tuning parameters for each of the regression algorithms for finding and reducing error values while designing a model. LR
Dataset Number of Observations Training 6572 and 10 Variables
Testing 2188 and 10 Variables
Table 3. Training and Testing Set
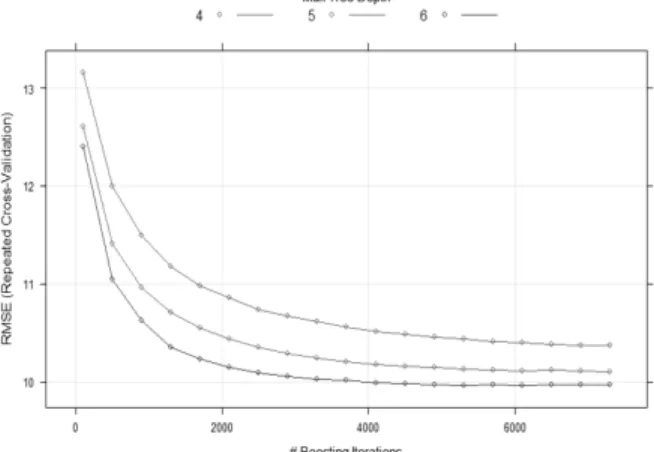
has no tuning parameters and the grid search is not performed for LR. The outcomes of the grid search for RF, SVM and GBM are presented in Fig. 3, Fig. 4, Fig. 5 respectively.
Fig. 3. RF with all the Parameters
Fig. 4. Grid Search Outcomes for Optimal Values of Sigma and Cost Values for the SVM-Radial Model
The grid quest suggests setting parameters by put- ting all configurable grids within the parameter space [22]. Each axis of the grid is an algorithm pa- rameter, and at each point in the grid is a particular combination of parameters. The role needs to be op- timized at every level. In this paper one of the most common validation methods, such as k-fold CV, is used during the hyperparameter tuning process to remove bias in data collection. K-fold CV is a com- mon sort of cv which is generally used in data mining. Even though there is no definite / strict rule for determining the value of K, in the field of data mining a value of K = 5 (or 10) is very common.
As Rodriguez stated [23], when the number of folds
is either five or ten, the bias of an accurate calculation
Fig. 5. Grid Search Outcomes for an Optimum Number of Trees (GBM Model Boosting Lterations and
Maximum Tree Depth)
would be smaller. In this aspect, as indicated by Kohavi [24] and Wong [25], the number of folds K was set at ten, and correlated with the trade-off between the measurement time and the bias. Ten rounds of training and validation were therefore performed using different partitions, and then the results are summed to reflect the output of LR, SVM, GBM, and RF on the training set. In this study all data processing was done using R software [26].
6. Results and Discussion
LM has no tuning parameters. SVM model has two hyperparameters which is to be fine-tuned. As indicated in Fig. 3, the optimal sigma and cost values for SVM and RBF are 0.1 and 25 respectively. GBM is a tree-based model with two hyperparameters, which are the number of trees and the maximum depth of the tree. The optimal value for the number of trees for GBM is 5300 and the maximum depth of the tree is 6 as shown in Fig. 4. The RF based on an ensemble-based model, has two parameters, which are namely mtry and the number of trees. In Fig. 5, the RMSE value stays constant for RF after 400 and the randomly chosen predictors or mtry value is 10.
Table 4 shows the performance results of each of the models, in which the models producing RMSE, MAE and MAPE are revealed as best. Because it de- termines the error values processed by the developed models, it is evident that RF and GBM model has less considered to other models, which are RMSE, MAE and MAPE, in the testing set of Table 4. In the result, LM has the worst performance. Out of all 4 models,
the developed RF has fewer error values and consid- ered as the best model in this research. GBM per- formance is almost close to RF in the test set. But, the performance of GBM is better in case of the test set.
Models Training Testing
RMSE MAE MAPE RMSE MAE MAPE
LM 16.98 6.98 1.34 9.31 6.12 13.36
SVM 11.09 7.32 2.55 10.66 7.88 27.69
GBM 2.70 1.94 0.75 7.47 4.68 11.57
RF 5.12 2.57 0.63 7.33 4.60 9.89
Table 4. Model Performance
7. Conclusion
This paper explores the potential for predicting energy consumption by data mining approaches.
This study leads to the conclusion that RF is best in predicting the energy and GBM performance also equal to RF. So, RF and GBM are more suitable for predicting steel industry energy consumption prediction.
A accurate long-term forecast of energy usage is one among the most critical problems for energy man- agement and optimization in the steel industry. In the exploratory analysis the data analysis reveals thought-provoking results. This work aims to establish the best performing prediction algorithm to predict the hourly consumption of energy in the steel in- dustry. The findings indicate that the RF model im- proves RMSE, MAE, and MAPE of predictions in con- sideration to other regression models considered in this research.
References
[1] Ç. Oluklulu, “A Research on the Photovoltaic Modules That Are Being Used Actively in Utilizing Solar Energy, Sizing of the Modules and Architectural Using Means of the Modules,” Master’s Thesis, Gazi University, Ankara, Turkey, 2001.
[2] V. I. Ugursal, “Energy Consumption, Associated Questions and some Answers,” Appl. Energy , Vol.130, pp.783–792, 2014.
[3] Rinkesh, What is the Energy Crisis. Available [Internet],
https://www.conserve-energy-future.com/causesand-solu
tions-to-the-global-energy-crisis.php#abh_posts
(accessed on 25 Jan. 2019).
[4] D. Streimikiene, “Residential Energy Consumption Trends, Main Drivers and Policies in Lithuania,” Renew. Sustain.
Energy Rev , Vol.35, pp.285–293, 2014.
[5] J. Zuo and Z. Y. Zhao, “Green Building Research-Current Status and Future Agenda: A review. Renew. Sustain,”
Energy Rev. , Vol.30, pp.271–281, 2014.
[6] Seung-Moon, Lee, “Mid-term Korea Energy Demand Outlook,”
Korea Energy Economics Institute, May 2014.
[7] L. Ekonomou, “Greek long-term energy consumption prediction using artificial neural networks,” Energy , Vol.35, No.2, pp.512-517, 2010.
[8] G. Munz, S. Li, and G. Carle, “Traffic Anomaly Detection Using k-means Clustering,” In Proceedings of the GI/ITG Workshop MMBnet , Hamburg, Germany, pp.13–14, Sep.
2007.
[9] K. Kandananond, “Forecasting Electricity Demand in Thailand with an Artificial Neural Network Approach,”
Energies , Vol.4, No.12, pp.1246–1257, 2011.
[10] C. De Cauwer, J. Van Mierlo, and T. Coosemans, “Energy Consumption Prediction for Electric Vehicles based on Real-world Data,” Energies , Vol.8, No.8, pp.8573–8593, 2015.
[11] B. Dong, C. Cao, and S. E. Lee, “Applying Support Vector Machines to Predict Building Energy Consumption in Tropical Region,” Energy Build ., Vol.37, No.5, pp.545–553, 2005.
[12] P. A. Gonzalez, and J. M. Zamarreno, “Prediction of Hourly Energy Consumption in Buildings Based on a Feedback Artificial Neural Network,” Energy Build ., Vol.37, No.6, pp.595–601, 2005.
[13] B. B. Ekici and U. T. Aksoy, “Prediction of Building Energy Consumption by Using Artificial Neural Networks,” Adv.
Eng. Softw. , Vol.40, No.5, pp.356–362, 2009.
[14] Q. Li, P. Ren, and Q. Meng, “Prediction Model of Annual Energy Consumption of Residential Buildings,” In Proceedings of the 2010 International Conference on Advances in Energy Engineering , Beijing, China, pp.223–226, 2010.
[15] L. Xuemei, D. Yuyan, D. Lixing, and J. Liangzhong,
“Building Cooling Load Forecasting Using Fuzzy Support Vector Machine and Fuzzy C-mean Clustering,” In Proceed- ings of the 2010 International Conference on Computer and Communication Technologies in Agriculture Engineer- ing , Chengdu, pp.438–441, 2010.
[16] Y. Ma, J. Q. Yu, C. Y. Yang, and L. Wang, “Study on Power Energy Consumption Model for Large-scale Public Building,” In Proceedings of the 2010 2nd International Workshop on. IEEE Intelligent Systems and Applications , Wuhan, pp.1–4, 2010.
[17] J. Zhao, Z. Han, W. Pedrycz, and W. Wang, “Granular model
of long-term prediction for energy system in steel industry,”
IEEE Transactions on Cybernetics , Vol. 46, No.2, pp.388-400, 2015.
[18] Y. Zhang, X. Zhang, and L. Tang, “Energy consumption prediction in ironmaking process using hybrid algorithm of SVM and PSO,” In International Symposium on Neural Networks , pp.594-600, 2012.
[19] B. Zeng, M. Zhou, and J. Zhang, “Forecasting the energy consumption of China’s manufacturing using a homologous grey prediction model,” Sustainability , Vol.9, No.11, pp.1-16, 2017.
[20] P. Sen, M. Roy, and P. Pal., “Application of ARIMA for forecasting energy consumption and GHG emission: A case study of an Indian pig iron manufacturing organization,”
Energy , Vol.116, No.1, pp.1031-1038, 2016.
[21] J. Reimann, “Methodology and model for predicting energy consumption in manufacturing at multiple scales,”
Procedia Manufacturing , Vol.21, pp.694-701, 2018.
[22] J. Zhou, E. Li, H. Wei, C. Li, Q. Qiao, and D. J. Armaghani,
“Random forests and cubist algorithms for predicting shear strengths of rockfill materials,” Applied Sciences , Vol.9, No.8, pp.1-16, 2019.
[23] J. D. Rodriguez, A. Perez, and J. A. Lozano, “Sensitivity analysis of k-fold cross validation in prediction error estimation,” IEEE Transactions on Pattern Analysis and Machine Intelligence , Vol.32, No.3, pp.569-575, 2009.
[24] R. Kohavi, “A study of cross-validation and bootstrap for accuracy estimation and model selection,” In Ijcai , Vol.14, No.2, pp.1137-1145, 1995.
[25] T. T. Wong, “Performance evaluation of classification algorithms by k-fold and leave-one-out cross validation,”
Pattern Recognition , Vol.48, No.9, pp.2839-2846, 2015.
[26] R. C. Team, “R: A language and environment for statistical computing,” 201, 2013.
Sathishkumar V E
https://orcid.org/0000-0002-8271-2022
e-mail : [email protected]
He is currently pursuing PhD in the
Department of Information and
Communication Engineering, Sunchon
National University. He received his
Bachelor of Technology in Information Technology from
Madras Institute of Technology and Master of Engineering
in Biometrics and Cyber Security from PSG College of
Technology. His current research interests include Big
Data Analytics, Data Mining, Cryptography and Vertical
Farming.
Myeongbae Lee
https://orcid.org/0000-0002-7160-2637
e-mail : [email protected]
He completed Bachelor degree in Computer Engineering from Korea.
He received Master degree on Computer Science in South Korea. And currently pursuing Doctorate degree in the Information and Communication Engineering. His area of interest includes Advanced Agriculture Technology, IT Convergence, Cloud and Ubiquitous Computing.
Jonghyun Lim
https://orcid.org/0000-0001-6832-4077
e-mail : [email protected]
He completed Bachelor degree in Information and Communication Engineering from Korea. And cur- rently pursuing Master degree in the Information and Communication Engineering. His area of interest includes Advanced Agriculture Technology, System Software and Ubiquitous Computing.
Yubin Kim
https://orcid.org/0000-0002-7744-5599
e-mail : [email protected]
He received his Bachelor and MS de- gree, and currently is pursuing PhD in the Department of Computer Science, Sunchon National University. Currently, he is a managing director of ELSYS Co, Ltd. His current research interests include Big Solar Energy System, Geo- thermal Energy System, IoT and Agriculture/ICT Conver- gence.
Changsun Shin
https://orcid.org/0000-0002-5494-4395
e-mail : [email protected]
He received the PhD degree in Com- puter Engineering at Wonkwang Uni- versity. Currently, he is a Professor in the Dept. of Information & Communi- cation Engineering, Sunchon National University. His re- search interests include Distributed Computing, Machine Learning, IoT and Agriculture/ICT Convergence.
Jangwoo Park
https://orcid.org/0000-0001-8201-8949
e-mail : [email protected]
He received the BS, MS and PhD de- grees in Electronic Engineering from Hanyang University, Seoul, Korea in 1987, 1989 and 1993, respectively. In 1995, he joined as the faculty member at Sunchon Natio- nal University, where he is currently a Professor in the Department of Information & Communication Engineering.
His research focuses on Localization and SoC and system designs and RFID/USN technologies.
Yongyun Cho
https://orcid.org/0000-0002-4855-4163