CHD is very dangerous because it is directly related to the patient’s lifestyle; hence, prevention is important [2]. The two standard datasets used to predict the CHD risk level are the Framingham risk score (FRS) and prospective cardiovascu- lar Münster (PROCAM) [3]. However, FRS and PROCAM are not tailored for Koreans; therefore, the accuracy of heart risk prediction using these methods is low when applied to Koreans [4,5].
Thus far, many previous studies have proposed methods to predict CHD using data mining, artificial intelligence, and machine learning techniques [6,7]. CHD prediction models based on data mining use various algorithms, such as arti- ficial neural networks, decision trees, Bayesian theory, and genetic algorithms [8]. Anooj [9] proposed the generation of a fuzzy rule based on rule induction using decision trees to develop a clinical decision support system (CDSS) and predict the risk level. Khatibi and Montazer [10] developed a CHD risk prediction model based on the Dempster–Sha- fer evidence theory by designing a fuzzy-evidential hybrid
Data-Mining-Based Coronary Heart Disease Risk Prediction Model Using Fuzzy Logic and Decision Tree
Jaekwon Kim, MS1, Jongsik Lee, PhD1, Youngho Lee, PhD2
1Department of Computer and Information Engineering, Inha University, Incheon; 2IT Department, Gachon University, Seongnam, Korea
Objectives: The importance of the prediction of coronary heart disease (CHD) has been recognized in Korea; however, few studies have been conducted in this area. Therefore, it is necessary to develop a method for the prediction and classification of CHD in Koreans. Methods: A model for CHD prediction must be designed according to rule-based guidelines. In this study, a fuzzy logic and decision tree (classification and regression tree [CART])-driven CHD prediction model was devel- oped for Koreans. Datasets derived from the Korean National Health and Nutrition Examination Survey VI (KNHANES-VI) were utilized to generate the proposed model. Results: The rules were generated using a decision tree technique, and fuzzy logic was applied to overcome problems associated with uncertainty in CHD prediction. Conclusions: The accuracy and re- ceiver operating characteristic (ROC) curve values of the propose systems were 69.51% and 0.594, proving that the proposed methods were more efficient than other models.
Keywords: Heart Disease, Decision Tree, Fuzzy Logic, KNHANES, Data Mining
Healthc Inform Res. 2015 July;21(3):167-174.
http://dx.doi.org/10.4258/hir.2015.21.3.167 pISSN 2093-3681 • eISSN 2093-369X
Submitted: June 3, 2015 Revised: July 10, 2015 Accepted: July 12, 2015 Corresponding Author Youngho Lee, PhD
IT Department, Gachon University, 1342 Seongnamdaero, Sujeong- gu, Seongnam 461-701, Korea. Tel: +82-31-750-4759, Fax: +82-31- 750-5662, E-mail: [email protected]
This is an Open Access article distributed under the terms of the Creative Com- mons Attribution Non-Commercial License (http://creativecommons.org/licenses/by- nc/4.0/) which permits unrestricted non-commercial use, distribution, and reproduc- tion in any medium, provided the original work is properly cited.
ⓒ 2015 The Korean Society of Medical Informatics
I. Introduction
Coronary heart disease (CHD) has the highest mortality rate of all the non-communicable diseases throughout the world.
Therefore, the prediction of CHD is necessary for reducing the management costs of CHD and for promoting health [1].
in ference engine using the FRS and PROCAM guidelines.
Krishnaiah et al. [11] developed a CHD prediction system using a fuzzy K-NN classifier for measured values to remove un certainty. CHD prediction models have been extended to a health management service model and a CDSS [12]. How- ever, few studies have investigated the prediction of CHD in Koreans, which is an important requirement [5].
Therefore, it is necessary to develop a CHD prediction model for Koreans using data mining. In Korea, few stud- ies have aimed to produce guidelines for CHD prediction thus far. Thus, rules based on guidelines are required, which should be produced using a data mining technique [13].
Certain bio metric information related to CHD is also uncer- tain, so a solution is required to address this problem; fuzzy logic may reduce the uncertainty of medical informatics [14].
Additionally, the FRS guidelines, which have been used as a predictive model, are not appropriate for Koreans. Therefore, a new prediction model should be produced based on local clinical data to predict CHD in Koreans using decision tree rule induction [15].
In this study, the model was developed data mining-driven CHD prediction model using fuzzy logic and decision- tree. Datasets derived from the Korean National Health and
Nutrition Examination Survey VI (KNHANES-VI) were utilized to produce the proposed model [16]. Furthermore, rules were generated using the classification and regression tree (CART) of the decision tree technique [17], whereas a fuzzy logic approach was employed to address the uncer- tainty problem, which allowed CHD to be predicted.
II. Methods
1. Data Set
The FRS, PROCAM, and Adult Treatment Panel III (ATP III) datasets have been used as standard guidelines for pre- dicting CHD and CHD risk factors for the last 10 years.
Therefore, the factors stated in these guidelines were used as a reference for data extraction.
Clinical data were acquired from KNHANES-VI, which was a survey study conducted by the Korea Centers for Dis- ease Control and Prevention. KNHANES provides a basis for policy establishment and the evaluation of the comprehen- sive national health promotion plan. It contains data on the health and nutritional status of Koreans based on national statistics collected by the Korea Centers for Disease Control and Prevention [16].
Table 1 shows the extracted dataset. There were nine input variables and one output variable. Input variables are the important factors that are widely used for the prediction of CHD, namely, age, sex total cholesterol, low-density lipopro- tein (LDL), high-density lipoprotein (HDL), systolic blood pressure, diastolic blood pressure, smoking, and diabetes [3].
The output variables are CHD risk factors that have prepro- cessing the output variables (hypertension, hyperlipidemia, myocardial infarction, and angina pectoris). If subjects have more than one of these diseases, they are defined as having CHD (low risk and high risk).
The experimental subjects were 8,108 survey subjects from KNHANES-VI. There were 8,108 survey subjects in total, Table 1. The distribution of preoperative variables between low
risk and high patients
Low risk (n = 488)
High risk
(n = 260) p-value Age (yr) 50.11 (14.10) 53.06 (13.775) 0.006 Cholesterol (mg/dL)
Total 206.69 (39.59) 201.40 (39.57) 0.082 LDL 116.81 (33.90) 112.10 (35.99) 0.077 HDL 43.99 ( 9.57) 43.54 ( 9.95) 0.552 Systolic BP (mmHg) 123.78 (16.04) 123.11 (15.70) 0.585 Diastolic BP (mmHg) 79.56 (11.20) 78.50 (11.07) 0.217 Sex
Men 302 135
Women 186 107
Smoking
Smoke 318 169
Non-smoke 170 91
Diabetes
Yes 463 196
No 25 64
Values are presented as mean (standard deviation) or number.
HDL: high-density lipoprotein, LDL: low-density lipoprotein,
BP: blood pressure. Figure 1. Data selection. KNHANES-VI: Korean National Health
and Nutrition Examination Survey VI.
KNHANES-VI Data Set Record: 8,108
779 selected
Final: 748 selected
Unsatisfied: 7,329
<20 year: 31
and the exclusions were 7,329 uncertain respondents, 31 people aged less than 20 years. The final dataset comprised 748 subjects. Figure 1 illustrates the data selection process.
2. Coronary Heart Disease Risk Prediction Model
A classification model and a process for dealing with uncer- tain data are required to predict CHD. The process of the CHD prediction model is shown in Figure 2.
The prediction model is a fuzzy-logic-based inference method that requires a rule base and fuzzy member- ship functions. Rule induction was performed using the KNHANES dataset to generate the rules. The rule induction technique generated rules using the decision tree method.
After that, the generated rules were transformed for using in the fuzzy inference engine. [18]. FRS and case studies with existing fuzzy functions were considered before the fuzzy member ship functions were created [9,10]. Finally, the fuzzy membership functions were produced after the model was validated. The CHD risk level of a subject could be inferred
using the rules generated by the decision tree and the fuzzy- logic-based classification prediction model.
3. Rule Induction
Formal rules were extracted from the continuous dataset of observations by rule induction. In this study, a decision tree technique was used to generate the rules. CART is known to be a useful approach for pruning leaf nodes, which enhances the generalization capability of learned trees when the gener- ated trees have an excessive number of steps and leaf nodes.
CART can also perform analyses and interpretations to gen- erate propositional knowledge, which is a set of rules used to generate ‘If-Then’ rules. Therefore, a CHD prediction model for Koreans was produced by applying the CART rule induc- tion algorithm to KNHANES-VI.
4. Fuzzy Inference Engine
Fuzzy logic is a multi-valued logic that is useful for solving uncertainty problems, and it can address the degree of mem-
Figure 2. Coronary heart disease (CHD) risk prediction model. KNHANES-VI: Ko- rean National Health and Nutrition Examination Survey VI, FRS: Fram- ingham risk score, CART:
classification and regres- sion tree.
Fuzzy rule base KNHANES-VI (Training data set)
Paper evidence (FRS guideline)
Decision tree (CART) Rule induction Validations testing
Coronary heart disease classification model
Fuzzy membership function
Fuzzy inference engine
Figure 3. Fuzzy inference model. COG:
center of gravity.
Coronary heart disease (CHD) classification model
Fuzzifier Continuous
data Continuous
data
Categorical data
Fuzzy inference
engine CHD risk
Fuzzy rule base
Defuzzifier (COG)
bership and degrees of truth. CHD-related data contains considerable uncertainty; hence, the data is inferred using fuzzy logic. Figure 3 shows the fuzzy inference model used by the CHD classification prediction model.
The fuzzy inference model determines the CHD risk level
by inference using the heart-disease-related input data. The continuous dataset and categorical dataset were used as the input data. The input continuous dataset comprised the age, total cholesterol, LDL cholesterol, HDL cholesterol, systolic blood pressure, and diastolic blood pressure. The uncertainty
0 160 200 240 280
Age
0 160 200 240 280
Total cholesterol 1.0
0.0
Young Midddle age Old
1.0
0.0
Low Midddle High
1.0
0.0
Low Midddle High
1.0
0.0
Low Midddle High
0 30 40 50 60
HDL cholesterol
0 100 130 160 190
LDL cholesterol 1.0
0.0 1.0
0.0
Very low Low Midddle High
0 120 130 140 150 160
Systolic blood pressure
0 80
Diastolic blood pressure
1.0
0.0
Low risk
0 1.0
Coronary heart disease risk
Very high Very low Low Midddle High Very high
85 90 95 100
High risk
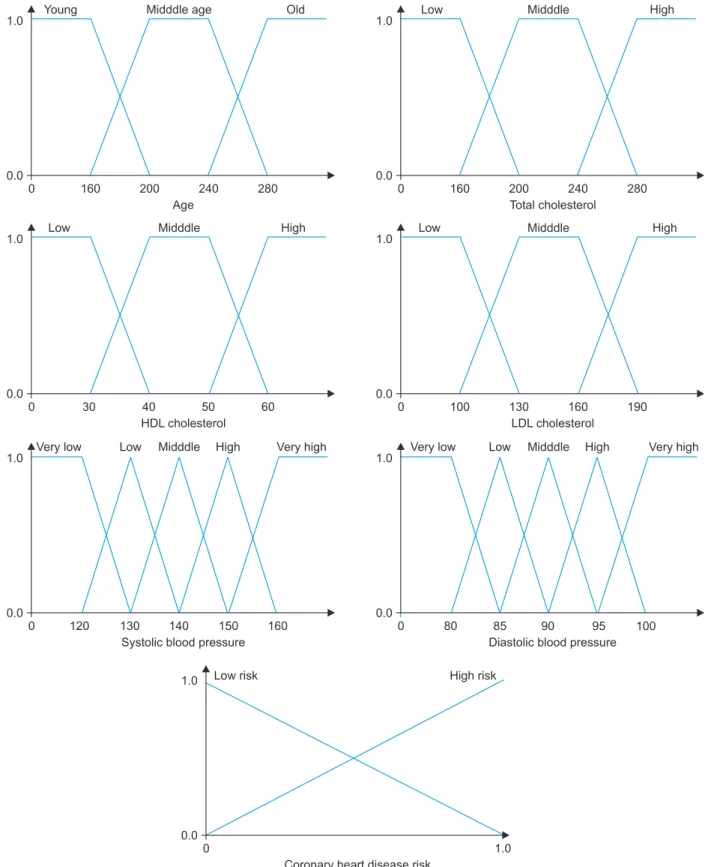
Figure 4. Fuzzy membership function. HDL: high-density lipoprotein, LDL: low-density lipoprotein.
of the continuous data was inferred by fuzzifying using the fuzzifier. The fuzzifier acquired the data via the fuzzy mem- bership function. Figure 4 shows the fuzzy membership function. Six of the continuous input variables were fuzzified and the output variable was the CHD risk level.
The categorical dataset contained Boolean logic data types, such as sex, smoking, and diabetes; hence, the fuzzy membership function was not required. After the fuzzified func tions and categorical data had been input, the fuzzy in ference engine performed inference using the rules. The Mamdani max-min approach was used as the inference me- chanism, while defuzzification used the center of gravity (COG) method to display the final output.
III. Results
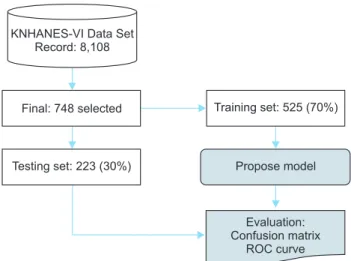
The proposed CHD risk prediction model was implemented and evaluated. Figure 5 shows the experimental scenario tested. The final data from the KNHANES dataset (748 / 8,108 subjects) were categorized into a training set and a
test set. The training set contained 525 subjects (70%), and it was used to create the rule induction and fuzzy member- ship functions as well as the classification prediction model.
The test set contained 223 subjects (30%), and it was used to verify the proposed model.
IBM SPSS modeler 14.2 was used for rule induction. CART was also used for rule induction where the pruning sever- ity was 75%, the minimum records per child branch was two, the boosting number was restricted to 10 for individual options, and the highest probability rule model was used.
MATLAB R2009b with a fuzzy tool box was used to produce the fuzzy inference model. A confusion matrix was used to evaluate the predictive model [19]. Table 2 shows the confu- sion matrix.
The true positive (TP) value was the number of cases that co rrectly predicted CHD patients and the true negative (TN) value was the number of cases that correctly predicted healthy subjects as non-heart-disease patients. The false positive (FP) value was the number of cases that identified a patient as healthy who had CHD, and the false negative (FN) value was the number of cases that predicted that a patient had CHD who was healthy.
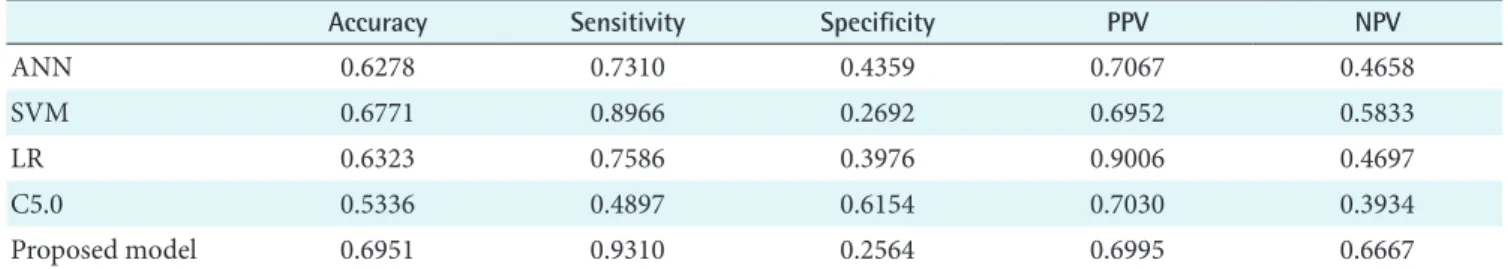
Our model was compared with previous results using an artificial neural network (ANN) [20], support vector ma- chine (SVM) [21], logistics regression (LR) [22], and deci- sion tree C5.0 [23] to evaluate the performance. Finally, it was compared with propose model. The confusion matrix and ROC curve results are shown in Tables 3 and 4, respec- tively.
The experimental results showed that the ANN, LR, and SVM had relatively high accuracy rates of 62.78%, 63.23%, and 67.71%, respectively, although they were lower than that of the proposed model because ANN and SVM only made observations at the learning level. C5.0, which are decision tree-based methods, yielded accuracy scores of 53.36%. The proposed model had accuracy and sensitive scores of 69.51%
and 93.10%, respectively, which were higher than those of the other models. The higher accuracy and sensitivity of the
KNHANES-VI Data Set Record: 8,108
Final: 748 selected Training set: 525 (70%)
Testing set: 223 (30%) Propose model
Evaluation:
Confusion matrix ROC curve
Figure 5. Experimental environment. KNHANES-VI: Korean Na- tional Health and Nutrition Examination Survey VI, ROC: receiver operating characteristic.
Table 2. Confusion matrix
Actual class Prediction class
Positive Negative Row total
Positive TP (true positive) FN (false negative) TP + FN (total number of subjects with given condition)
Negative FP (false positive) TN (true negative) FP + TN (total number of subjects without given condition)
Column total TP + FP (total number of subjects with positive test)
FN + TN (total number of subjects with negative test)
N = TP+FN+FP+TN (total number of subjects in study)
proposed model can be attributed to the reduction of uncer- tainty achieve by using fuzzy logic. CART, which was used for rule induction, cannot process uncertainty adequately.
The propose model performs better than ANN and SVM in terms of accuracy and sensitive is the highest reason, ANN and SVM learning and resoning about the complex relation- ship between the each training data; however, ANN and SVM do not resolve the problem of uncertainy. However, the propose model overcomes the problem of the uncertainty of the data by using fuzzy logic. However, specificity of pro- posed model is lower than that of the other models. Thus, fu- ture studies are required to develop a prediction model with higher specificity. The ROC curve result of the proposed model (0.594) was higher than that of the other models, and this can help in the decision support of the prediction of CHD.
IV. Discussion
This paper proposed a novel predictive model for CHD
based on data derived from KNHANES-VI, which were col- lected by the Korea Centers for Disease Control and Preven- tion. The propose model decision supports the prediction of CHD by utilizing fuzzy logic and CART-based rule induc- tion. Rule induction was performed using the KNHANES- VI datasets to generate the rules using the CART method.
The prediction model used an inference model based on fuzzy logic. The rules were generated using a CART decision tree method, and fuzzy membership functions were cre- ated based on those used in previous case studies and FRS.
A final dataset containing 748 subjects was selected from KNHANES-VI and used for the performance evaluation.
The experimental results showed that the proposed model improved the prediction accuracy and sensitivity. Using the propose model is expected to offer decision support for CHD prediction.
Future research should focus on developing data mining based prediction methods that may also increase the accu- racy and specificity of CHD prediction.
Table 3. Confusion matrix result
Accuracy Sensitivity Specificity PPV NPV
ANN 0.6278 0.7310 0.4359 0.7067 0.4658
SVM 0.6771 0.8966 0.2692 0.6952 0.5833
LR 0.6323 0.7586 0.3976 0.9006 0.4697
C5.0 0.5336 0.4897 0.6154 0.7030 0.3934
Proposed model 0.6951 0.9310 0.2564 0.6995 0.6667
ANN: artificial neural network, SVM: support vector machine, LR: logistics regression, PPV: postivie prediction value, NPV: nega- tive prediction value, TP: true positivie, TN: true negative, FP: false positive, FN: false negative.
Accuracy = (TP + TN) / (TP + TN + FP + FN) Sensitivity = TP / (TP + FN)
Specificity = TN / (FP + TN) PPV = TP / (TP + FP) NPV = TN / (TN + FN) Table 4. ROC curve result
AUC p-value p-value 95% CI
Lower bound Upper bound
ANN 0.583 ± 0.041 0.040 0.504 0.663
SVM 0.583 ± 0.041 0.041 0.502 0.664
LR 0.578 ± 0.041 0.055 0.498 0.658
C5.0 0.553 ± 0.040 0.196 0.474 0.631
Proposed Model 0.594 ± 0.041 0.021 0.513 0.675
ROC: receiver operating characteristic, AUC: area under ROC curve, CI: confidence interval, ANN: artificial neural network, SVM:
support vector machine, LR: logistics regression.
Conflict of Interest
No potential conflict of interest relevant to this article was reported.
Acknowledgments
This work was supported by the National Research Founda- tion of Korea (NRF) grant funded by the Korea government (MSIP) (No. NRF-2013 M3C8A2A02078403).
References
1. World Health Organization. The world health report 2010 [Internet]. Geneva, Switzerland: World Health Or- ganization; c2015 [cited at 2015 Jul 1]. Available from:
http://www.who.int/whr/2010/en/.
2. Liu K, Daviglus ML, Loria CM, Colangelo LA, Spring B, Moller AC, et al. Healthy lifestyle through young adult- hood and the presence of low cardiovascular disease risk profile in middle age: the Coronary Artery Risk Devel- opment in (Young) Adults (CARDIA) study. Circulation 2012;125(8):996-1004.
3. Wilson PW, D'Agostino RB, Levy D, Belanger AM, Sil- bershatz H, Kannel WB. Prediction of coronary heart disease using risk factor categories. Circulation 1998;
97(18):1837-47.
4. Lee DY, Rhee EJ, Choi ES, Kim JH, Won JC, Park CY, et al. Comparison of the predictability of cardiovascu- lar disease risk according to different metabolic syn- drome criteria of American Heart Association/National Heart, Lung, and Blood Institute and International Diabetes Federation in Korean men. Korean Diabetes J 2008;32(4):317-27.
5. Kim JK, Lee JS, Park DK, Lim YS, Lee YH, Jung EY.
Adaptive mining prediction model for content recom- mendation to coronary heart disease patients. Cluster Comput 2014;17(3):881-91.
6. Song MH, Kim SH, Park DK, Lee YH. A multi-classifier based guideline sentence classification system. Healthc Inform Res 2011;17(4):224-31.
7. Hachesu PR, Ahmadi M, Alizadeh S, Sadoughi F. Use of data mining techniques to determine and predict length of stay of cardiac patients. Healthc Inform Res 2013;19(2):121-9.
8. Palaniappan S, Awang R. Intelligent heart disease pre- diction system using data mining techniques. Pro- ceedings of IEEE/ACS International Conference on
Com puter Systems and Applications (AICCSA2008);
2008 Mar 31-Apr 4; Doha, Qatar. p. 108-15
9. Anooj PK. Clinical decision support system: risk level prediction of heart disease using decision tree fuzzy rules. Int J Res Rev Comput Sci 2012;3(3):1659-67.
10. Khatibi V, Montazer GA. A fuzzy-evidential hybrid inference engine for coronary heart disease risk assess- ment. Expert Syst Appl 2010;37(12):8536-42.
11. Krishnaiah V, Narsimha G, Chandra NS. Heart disease prediction system using data mining technique by fuzzy K-NN approach. In: Satapathy SC, Govardhan A, Srujan Raju K, Mandal JK, editors. Emerging ICT for bridging the future: Proceedings of the 49th Annual Convention of the Computer Society of India (CSI). Cham, Switzer- land: Springer International Publishing; 2015. p. 371-84.
12. Jung H, Yang J, Woo JI, Lee BM, Ouyang J, Chung K, Lee Y. Evolutionary rule decision using similarity based associative chronic disease patients. Cluster Comput 2014;18(1):279-91.
13. Barman M, Choudhury JP. A fuzzy rule base system for the diagnosis of heart disease. Int J Comput Appl 2012;57(7):46-53.
14. Papageorgiou EI. A new methodology for decisions in medical informatics using fuzzy cognitive maps based on fuzzy rule-extraction techniques. Appl Soft Comput 2011;11(1):500-13.
15. Kim JK, Son EJ, Lee YH, Park DK. Decision tree driven rule induction for heart disease prediction model: Ko- rean National Health and Nutrition Examinations Sur- vey V-1. In: Kim KJ, Chung KY, editors. IT Convergence and Security 2012. Amsterdam: Springer Netherlands;
2013. p. 1015-20.
16. Korea Center for Disease Control and Prevention. The 6th Korea National Health & Nutrition Examination Survey 2013 (KNHANES VI) [Internet]. Cheongju: Ko- rea Center for Disease Control and Prevention; c2015 [cited 2015 Jul 1]. Available from: http://knhanes.cdc.
go.kr/.
17. Park M, Kim H, Kim SK. Knowledge discovery in a community data set: malnutrition among the elderly.
Healthc Inform Res 2014;20(1):30-8.
18. Son EJ, Kim JK, Lee YH, Jung EY. (2013). Data Mining- Driven Chronic Heart Disease for Clinical Decision Support System Architecture in Korea. In: Kim KJ, Chung KY, editors. IT Convergence and Security 2012.
Amsterdam: Springer Netherlands; 2013. p. 1021-25.
19. Zhu W, Zeng N, Wang N. Sensitivity, specificity, accu- racy, associated confidence interval and ROC analysis
with practical SAS implementations. Proceedings of Northeast SAS Users Group (NESUG) 2010: Health Care and Life Sciences; 2010 Nov 14-17; Baltimore, MD.
p. 1-9.
20. Akay M. Noninvasive diagnosis of coronary artery disease using a neural network algorithm. Biol Cybern 1992;67(4):361-7.
21. Sengur A. Support vector machine ensembles for intel- ligent diagnosis of valvular heart disease. J Med Syst
2012;36(4):2649-55.
22. Laurent S, Boutouyrie P, Asmar R, Gautier I, Laloux B, Guize L, et al. Aortic stiffness is an independent predic- tor of all-cause and cardiovascular mortality in hyper- tensive patients. Hypertension 2001;37(5):1236-41.
23. Freund Y, Mason L. The alternating decision tree learn- ing algorithm. Proceedings of the 16th International Conference on Machine Learning (ICML’99); 1999 Jun 27-30; Bled, Slovenia. p. 124-33.