Improved Image Matching Method Based on Affine Transformation Using Nadir and Oblique-Looking Drone Imagery
Jang, Hyo Seon1)·Kim, Sang Kyun2)·Lee, Ji Sang3)·Yoo, Su Hong4)· Hong, Seung Hwan5)·Kim, Mi Kyeong6)·Sohn, Hong Gyoo7)
Abstract
Drone has been widely used for many applications ranging from amateur and leisure to professionals to get fast and accurate 3-D information of the surface of the interest. Most of commercial softwares developed for this purpose are performing automatic matching based on SIFT (Scale Invariant Feature Transform) or SURF (Speeded-Up Robust Features) using nadir-looking stereo image sets. Since, there are some situations where not only nadir and nadir-looking matching, but also nadir and oblique-looking matching is needed, the existing software for the latter case could not get good results. In this study, a matching experiment was performed to utilize images with differences in geometry. Nadir and oblique-looking images were acquired through drone for a total of 2 times. SIFT, SURF, which are feature point-based, and IMAS (Image Matching by Affine Simulation) matching techniques based on affine transformation were applied. The experiment was classified according to the identity of the geometry, and the presence or absence of a building was considered. Images with the same geometry could be matched through three matching techniques. However, for image sets with different geometry, only the IMAS method was successful with and without building areas. It was found that when performing matching for use of images with different geometry, the affine transformation-based matching technique should be applied.
Keywords : Oblique-Looking Image, Geometry, Image Matching, IMAS, Drone
1. Introduction
Acquiring images through a drone has the advantage of being able to quickly and accurately grasp the information of objects of interest. Due to these advantages, drones are widely used in various fields (Colomina and Molina, 2014; Suzuki, 2018). The purposes of using drones usually are for hobbies, leisure or to understand specific phenomena (Yoon, 2015;
Banu et al., 2016; Solomitckii et al., 2018). However, drones are also used in specialized fields such as 3D information
acquisition (Backes et al., 2019; Ajayi et al., 2018). In the case of obtaining 3D information, the operation of the drone adjusts the amount of overlaps between neighboring images using the auto-pilot function and secures stable degrees of overlaps for the area where the images are to be acquired.
In this case, the images collected through the drone are nadir-looking images in which the position and orientation of the sensor are relatively constant, and a bundle adjustment is performed on the images to obtain 3D information. This kind of drone-based 3D information acquisition process is
Received 2020. 09. 28, Revised 2020. 10. 16, Accepted 2020. 10. 21
1) Member, Dept. of Civil & Environmental Engineering, Yonsei University (E-mail: [email protected]) 2) Dept. of Civil & Environmental Engineering, Yonsei University (E-mail: [email protected])
3) Member, Dept. of Civil & Environmental Engineering, Yonsei University (E-mail: [email protected]) 4) Member, Dept. of Civil & Environmental Engineering, Yonsei University (E-mail: [email protected]) 5) Member, Stryx Inc. (E-mail: [email protected])
6) Member, Agency for Defense Development (E-mail: [email protected])
7) Corresponding Author, Member, Dept. of Civil & Environmental Engineering, Yonsei University (E-mail: [email protected])
https://doi.org/10.7848/ksgpc.2020.38.5.477 Original article
This is an Open Access article distributed under the terms of the Creative Commons Attribution Non-Commercial License (http://
currently well established, and various commercial softwares have shown satisfactory outcomes. Due to the relatively easy and automatic processes in obtaining 3D information with drone make the application of drones much wider.
At the same time in recent years, the application of drones for understanding specific situations such as disasters is also increasing (Corcoran, 2014; Holton et al., 2015; Erdelj et al., 2017). In an urgent situation, the imaging geometry of drone can be different from the way we usually do to get 3-D information of the ground via nadir-looking only. We may face certain situations that it is urgent to monitor the changes or reconstruct the interest spot using multiple geometries of images taken from drones. We further assume that the only available images are nadir-looking images acquired in the past and oblique-looking images acquired in an urgent situation. In this case, matching of nadir and oblique-looking images is inevitable. In other words, the area of changing is detected through the matching of two different geometric images. Furthermore, a new methodology to acquire 3D information utilizing nadir and oblique-looking imagery will be needed.
Several studies have tried to solve the matching of nadir and oblique-looking images through commercial software such as SIFT (Scale Invariant Feature Transform) or SURF (Speeded-Up Robust Features)-based programs. Rumpler et al. (2017), Daneshmand et al. (2018) and Nesbit and Hugenholtz (2019) conducted a matching experiment between two images through Pix4D, PhotoScan, and PhotoModeler.
Also, Javadnejad (2017) and Meinen and Robinson (2020) conducted a matching experiment between two images by applying several matching algorithms. However, in these studies, there was a limitation of matching between different geometries by simply applying the algorithm readily available such as SIFT and SURF-based. We did similar test but when the imagery posed different geometries, the matching turned out to be unsuccessful. We thought that the reason for this limitation was nadir-looking geometry could not accommodate with the oblique-looking images which contains the form of affinity.
Therefore, in this study, a new image matching procedure was suggested using two types of images (nadir-looking and oblique-looking) acquired by drones. Through several
experiments, an appropriate algorithm with the possibility of matching was found, and its applicability was judged by comparing our proposed method with the existing algorithms (SIFT and SURF). IMAS (Image Matching by Affine Simulation), which was judged to be possible for matching nadir and oblique-looking images, is an algorithm to which affinity is applied. The theoretical background for this method is explained in detail in Chapter 2.
2. Methodology
Fig. 1 is a flowchart showing the research approach used in this study. Our method consists of applying a matching technique to the input image, removing outliers, and finally calculating inliers, as in general image matching studies do.
Fig. 1. Flowchart
2.1 Feature point-based image matching technique
In this study, SIFT and SURF, which are most widely used as feature point-based matching techniques, are utilized for the comparison with a new approach of IMAS.
SIFT is a matching technique proposed by Lowe (2004) and largely composed of 4 steps as follows. First, the scale- space extrema extraction. After creating a Gaussian image that follows Gaussian distribution for the input image, DoG (Difference of Gaussian) is produced. Local extrema are
extracted using the created DoG. The local extrema compare 8 points adjacent to the selected points with 18 points at a neighboring position in the DoG pyramid. Then, if the difference between the values is large or small, it is extracted as a feature point.
The second step is the localization and filtering of feature points. High-frequency noise or strong edge components that cause matching errors are removed. The third step is the orientation assignment. This process calculates the dominant orientation and size of each point based on the remaining feature points. The last step is to compare previously calculated points and perform matching between points with a small difference in size.
Bay et al., (2008) proposed a SURF matching technique.
SURF firstly performs integral image generation and feature point extraction. The integral image consists of the total sum of the pixel values of the corresponding column from the start point of the input image to the given coordinate.
In other words, it is a form in which pixel brightness values are accumulated. Then, FAST (Features from Accelerated Segment Test) Hessian detector is applied to the integral image. At this time, the Hessian determinant is calculated, and if it is the largest value, it is extracted as a feature point by comparing it with nine brightness values of the box filter located around the value. After that, the dominant orientation for the feature point is calculated, and at the same time a descriptor is created, and finally matching is performed.
Therefore, the difference between the two algorithms is the process of extracting feature points. In the case of SIFT, points are extracted by adjusting the scale of the image. However, in the case of SURF, points are extracted by adjusting the size of the applied filter without changing the scale of the image.
2.2 Image matching technique based on affine transformation
In this study, the IMAS matching technique based on affine transformation proposed by Rodríguez et al., (2018) was fully analyzed and utilized to get the final results. The affine transformation includes both linear transformation and similarity. Therefore, it preserves isotropic scaling and parallelism, and is a transformation that includes shear and reflection as well as rotation, translation, and scaling. IMAS
is capable of very robust matching for image rotation and reflection.
The main contents of IMAS are largely composed of three. First, it is the near-optimal α° covering of the feature detector process. This is based on the transition tilt theory and is a process of creating an image through simulation to consider images of various angles. At this time, stereographic projection, which is a map projection based on a quaternion angle, is applied.
The key to α° covering is to create an image similar to that acquired from various angles. For this, α° covering considers latitude and longitude in stereographic projection. Also, the radius is considered as a scale indicating the area that can be covered by an image acquired at a specific location.
Therefore, α° covering is expressed as Eq. (1).
(1) where, is the covering area, is the latitude and longitude determined by the transition tilt theory, and is the radius of the covering.
In this case, can be expressed in more detail as Eq. (2).
(2)
where, is latitude and longitude, is latitude, is longitude, and is angle. If , it means arccos , that is, the location of nadir.
Also, of Eq. (1) is equal to Eq. (3).
log cos
(3)
where, is the radius of the covering and is the angle.
Finally, in this study, a near-optimal α° covering as shown in Fig. 2 was considered. In Fig. 2, the green points mean the positions according to the latitude and longitude of the camera. Also, the ellipse around the green points is α°
covering in the green position. The green point located in the center is a nadir-looking image, and the coverings created in
the form of petals around it correspond to oblique-looking images. Coverings constructed in the next step based on the green point in the center were made at 22.5° intervals, and a total of 16 oblique-looking images were created in this study. In addition, coverings at the end were made at 11.25°
intervals, and a total of 32 oblique-looking images were created.
Fig. 2. Near-optimal α° covering applied in this study
The second major content of IMAS is the creation of hyper descriptors in the feature descriptor process. The hyper descriptor creates a cluster based on a myriad of feature points extracted from images of various angles through α° covering and then creates a descriptor for the cluster. Operation speed can be improved through this hyper descriptor. The last part of the algorithm is a contrario model of the feature descriptor process. This model is one of the parameter tuning methods and is applied to increase matching pairs.
2.3 RANSAC algorithm
The RANSAC (RANdom SAmple Consensus) algorithm proposed by Fischler and Bolles (1981) was applied in the final step to remove outliers included in the matching results.
This technique consists of the repetition of the following two steps. First, a sub-data set is randomly selected from the initial data set. Then, the model and model parameters for the selected sub-data set are calculated. Second, it checks how well the model parameters calculated previously are consistent with the entire data. If the data does not match the fitting model, it is classified as an outlier. And if it matches the fitting model, it is determined as an inlier. The set of valid data obtained from the fitting model is called a consensus set.
The RANSAC algorithm repeats the above two steps until enough consensus sets are secured.
2.4 Accuracy assessment
Accuracy evaluation was performed to confirm the accuracy of the final matching result. In general, RMSE (Root Mean Square Error) is most commonly used to evaluate the accuracy of image matching (González et al., 2020). Accuracy evaluation was performed in the following process in this study. First, we estimated the calculated 2D-affine transform coefficients based on feature points, which are true values in each image for accuracy calculation.
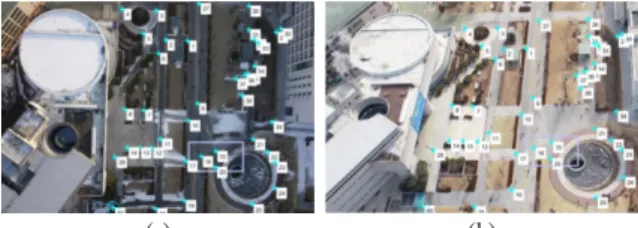
Feature points, which are true values, were acquired by manually picking by the experts. For all images, a total of 40 points were carefully selected as shown in Fig. 3. Fig. 3(a) is the manual selection result for the nadir-looking image, and Fig. 3(b) is the manual selection result for the oblique-looking image in the same area as Fig. 3(a).
(a) (b)
Fig. 3. The location of the true value feature points acquired by manually picking
It is assumed that the 2D-affine transform coefficient estimated from the feature points acquired through manual picking is the true value of the transform obtained as a result of matching the image. Then, 2D-affine transform coefficients are calculated based on the feature points obtained by the three matching techniques applied in this study. Finally, the distance between the transform coefficient based on the true value calculated previously and the transform coefficient obtained based on the actual matching result is measured.
The unit of measurement is a pixel, and the smaller the measured value, the higher the accuracy becomes.
3. Study Area and Data Acquisition
3.1 Study area
The study area is Sinchon campus of Yonsei University, located in Seoul. Sinchon campus has a total area of 0.99
㎢, and buildings are located on the left and right sides with the Baekyang-ro crossing the campus as the central axis.
The buildings and structures of the campus are composed of different types of squares, circles, and irregular shapes.
Therefore, it is thought to be an appropriate area for performing matching experiments on the presence or absence of buildings and various types of structures. In this study, by considering the flight path of drone’s and signal reception distance, the 0.76 ㎢ area as shown in Fig. 4 was selected as the target area for data acquisition.
Fig. 4. Study area over Yonsei University
3.2 Data acquisition
Drone imagery was acquired twice for the matching experiment with two different geometries. The primary purpose of data acquisition was to acquire nadir-looking images and it was in February 2018. The second mission was to acquire oblique-looking images, were carried out in February 2019.
3.2.1 Nadir-looking images
Table 1 shows the specifications of nadir-looking images.
Nadir-looking images were acquired during the winter season, February 2018, and the snow-covered areas are included in the images.
Table 1. Nadir-looking images specifications Contents
Equipment Drone
(WingtraOne RX1 + Sony DSC- RX1RM2 camera)
Overlap 80 %
Flight Height 190 m
(Ground Sample GSD
Distance) 1.91 cm
A total of 1,880 nadir-looking images were acquired as in the example shown in Fig. 5. Fig. 5(a) is an area where various types of buildings such as squares and circles are located, and Fig. 5(b) is an area with relatively few buildings and many square repetitive patterns within the study area. Therefore, Fig. 5(a) was chosen as the area where the building is located, and Fig. 5(b) was chosen as an area without buildings for the matching experiment.
(a) (b)
Fig. 5. Example of acquired nadir-looking images
3.2.2 Oblique-looking images
The detailed description of how oblique-looking images are obtained is shown in Table 2. At this time, the oblique- looking images were acquired by artificially rotating the angle of the camera attached to the drone to 55°. Also, the oblique-looking images were acquired during the winter season, February 2019, but there is no snow-covered area in the images at this time.
Table 2. Oblique-looking images specifications Contents
Equipment Drone
(Phantom 4 pro)
Overlap 75 %
Flight Height 225 m
(Ground Sample Distance)GSD 5.91 cm
A total of 800 oblique-looking images were acquired as the examples shown in Fig. 6. The oblique-looking images in Figs. 6(a) and (b) were selected for the study. To proceed matching with Figs. 5(a) and (b), the image sets that the most similar position to the location of Figs. 5(a) and (b) were chosen.
(a) (b)
Fig. 6. Example of acquired oblique-looking images
4. Results and Discussion
In this chapter, we compared the results after applying the aforementioned matching techniques with two different categories. First category is matching with two different imaging geometry (nadir vs. nadir and nadir vs. oblique) and second category is the image set with buildings and without buildings. First, matching between nadir and nadir-looking images was performed over the building and non-building areas, and the results were compared. Second, matching with different geometry (between nadir and oblique-looking) images was performed over the building and non-building areas, and then the results were compared. Finally, the most effective matching technique was selected based on the accuracy evaluation of the matching result.
The hardware specification for this experiment is Intel(R) Core(TM) i5-8500 CPU @ 3.00 GHz, 32 GB RAM.
The software environment for applying SIFT and SURF techniques is Windows 10 Pro (64 bit) and was performed with Open CV through MATLAB R2019b. On the other hand, the software environment for applying the IMAS technique is Linux Ubuntu (64 bit), which was performed through C/
C++. The size of all images applied in this experiment is the same as 1100×735.
4.1 Comparison of same geometry image matching results
Fig. 7 is the matching result of nadir and nadir-looking images. As shown in Figs. 7(a), (c) and (e) with buildings and Figs. 7(b), (d) and (f) without buildings, all matching techniques of SIFT, SURF, and IMAS presented stable matching results.
(a)
(c)
(e)
(b)
(d)
(f) SIFT
SURF
IMAS
Fig. 7. Matching results between images with the same geometry (nadir-looking and nadir-looking) (inliers):
building ((a), (c), (e)) and non-building ((b), (d), (f))
Table 3 shows the number of inliers indicated by the yellow line in Fig. 7. Stable matching was possible in all three matching techniques, but among them, the IMAS matching technique clearly showed the most number of inliers.
Table 3. Number of inliers according to matching result between images with the same geometry
(nadir-looking and nadir-looking)
SIFT SURF IMAS
Building 380 579 3676
buildingNon 280 355 3264
The positions of the matched feature points were evenly distributed throughout the image in all three matching techniques. In particular, SIFT and SURF, which are feature point-based matching techniques, show the commonality that the location of feature points is extracted from straight lines
such as the edges of stairs and roads. However, the location of feature points of IMAS, an affine transformation-based matching technique, had a difference that was extracted not only from the straight edge but also from the curved part such as the circular edge of the roof of the building. The reason for IMAS were robust in terms of matching features compared with SIFT and SURF was considered to be generation of multi-view image sets through α°-covering. In the case of image matching with the same geometry, it was found that stable matching is possible with SIFT, SURF, and IMAS algorithms without special consideration.
4.2 Comparison of different geometry image matching results
Fig. 8 shows the matching result of nadir and oblique- looking images over the building areas. As shown in Figs.
8(a) and (b), when SIFT and SURF were applied matching was not successful. But as shown in Fig. 8(c), matching was possible only when the IMAS algorithm was applied. The total number of inliers derived through the IMAS technique was 46 (Table 4).
(a) SIFT
(b) SURF
(c) IMAS
Fig. 8. Matching results between images with the different geometry (nadir-looking and oblique-looking) (inliers):
Table 4. Number of inliers according to the result of matching between images with different geometries (nadir-
looking and oblique-looking), case of building
SIFT SURF IMAS
Building Not matched
(3)
matchedNot
(4) 46
Fig. 9 shows the matching result of nadir and oblique- looking images over the non-building areas. Even if there was no building in the image, matching was successful as shown in Fig. 9(c) only when the IMAS algorithm was applied as the same results with buildings in the image. At this time, the total number of inliers derived through the IMAS technique was 156 (Table 5).
(a) SIFT
(b) SURF
(c) IMAS
Fig. 9. Matching results between images with the different geometry (nadir-looking and oblique-looking) (inliers):
case of non-building
Table 5. Number of inliers according to the result of matching between images with different geometries (nadir-
looking and oblique-looking), case of non-building
SIFT SURF IMAS
buildingNon
matchedNot Not
matched 156
We further investigated the location of the matched points obtained from IMAS technique, the result locations of matched points are shown in Figs. 10 and 11. 33 out of 46 matched points were from the ground features shown in Fig. 10 in the building image case. This is about 71.7 % of matched points are from the ground features. We speculated the reason why a large number of matched points are from the ground. We thought that ground features are robust to changes in geometry and less sensitive to the affinity. Even with this speculation it was very surprising that about 30 % of matching points are from the top of building.
Fig. 10. Location of the matched points obtained from IMAS: case of building
Fig. 11 shows the location of matched points for the image set without buildings. In this image set many matched points are distributed throughout the image not in the edges of buildings. Our experiments clearly indicated that for the image matching with different geometry affine transformation-based image matching can be a solution to overcome the limitations of the feature point-based matching techniques such as SIFT and SURF.
Fig. 11. Location of the matched points obtained from IMAS: case of non-building
4.3 Accuracy evaluation for matching results We tried to determine the reliability of matching results by performing the accuracy evaluation. As mentioned in the previous section, manual selection of matched points was performed and assumed to be the ground truth. The valuation process in this way also means the presence of errors for the
selection of matched points.
Table 6 shows the matching accuracy for the image set where the buildings are present. As summarized in Table 6, for the case when the same geometry (nadir-looking and nadir-looking) is used, the SURF showed the highest accuracy. However, the accuracy of the other two matching methods did not exhibit much difference from SURF. It can be concluded that all three matching techniques can be applied to nadir to nadir matching cases.
The case when the looking geometry was not the same (nadir-looking and oblique-looking), only the IMAS method presented the matched points and showed an accuracy of about 55.29 pixels over the building areas. The result can be judged to be relatively low accuracy, but have some significance in that IMAS can overcome limitations that could not be solved with SIFT and SURF, on which most of commercial softwares are based. Another indication is that the image sets over the building area exhibits relatively low matching accuracies and considered to be that building areas are very susceptible to the change of imaging geometry and caution must be considered.
Table 6. RMSE for pixel distance: case of building (unit: pixel)
SIFT SURF IMAS
equal geometry
(nadir – nadir) 10.41 7.42 8.02
non-equal geometry (nadir – oblique)
matchedNot (439.76)
matchedNot
(680.38) 55.29
Table 7 shows the matching accuracy for the image sets where there are almost no buildings. When the geometry is the same (nadir-looking and nadir-looking), SIFT showed the highest accuracy. However, the accuracy of SIFT did not dominate because it showed only 0.29 pixel difference from the second-highest accuracy of SURF. In this area IMAS also showed the accuracy in a single-digit number. Therefore, it can be concluded that all three techniques can be applied to when the geometry of image is the same.
The case when the geometry was not the same (nadir- looking and oblique-looking), only the IMAS presented the
matching results and showed an RMSE of about 24.41 pixels.
This result is about 2 times than that of the above-mentioned IMAS matching accuracy of 55.29 pixels for the image set with buildings and with different geometry. Once again this can be explained by the fact that the edges of the ground are less sensitive to the geometric changes.
Table 7. RMSE for pixel distance: case of non-building (unit: pixel)
SIFT SURF IMAS
equal geometry
(nadir – nadir) 7.10 7.39 9.40
non-equal geometry (nadir – oblique)
matchedNot (404.40)
matchedNot
(589.82) 24.41
From the research we can finally state that for the matching of drone image with the same geometry, not only SIFT and SURF, which are well-known point-based feature matching techniques, but also IMAS based on affine transformation could be applied. However, for the drone images with not the same geometry, there exists a clear limitation in the point- based feature matching technique. Therefore, it should be noticed that applying a matching technique based on affine transformation such as IMAS can be a reliable solution.
5. Conclusion
As the use of drones expands, there is a need to utilize drone images acquired by non-professionals. However, drone images acquired by non-professionals were limited in use because it was difficult to maintain constant geometry. This study applied a total of three image matching techniques, SIFT, SURF, and IMAS, for image matching with different geometry, and compared the results. The following conclusions are obtained through the comparison.
1. For the drone image data set with the same geometry, SIFT, SURF, and IMAS can all be reliably applied regardless of the presence or absence of a building.
2. For the drone image data with different geometry, only affine transformation-based techniques such as IMAS
can be matched. For this case, the feature point located on the edge of the ground is robust to geometry changes.
Therefore, for the drone image data set with a large difference in geometry, if there are portions inside the image where edges can be extracted from the ground, a matching attempt can be possible.
3. Finally, to accommodate the matching of drone image with different geometry, the commercial software should incorporate the solution for affine transformation-based matching approach such as IMAS.
Acknowledgment
This work was supported by DAPA (Defense Aquisition Program Administration) and ADD (Agency for Defense Development) [UD180003FD]
This research was supported by Basic Science Research Program through the National Research Foundation of Korea(NRF) funded by the Ministry of Education(2019R1A6A3A13096717)
References
Ajayi, O.G., Palmer, M., and Salubi, A.A. (2018), Modelling farmland topography for suitable site selection of dam construction using unmanned aerial vehicle (UAV) photogrammetry, Remote Sensing Application: Society and Environment, Vol. 11, pp. 220-230.
Backes, D., Schumann, G., Teferele, F.N., and Boehm, J. (2019), Towards a high-resolution drone-based 3D mapping dataset to optimise flood hazard modelling, The International Archives of the Photogrammetry, Remote Sensing and Spatial Information Sciences, Vol. Ⅺ_Ⅱ-2, pp. 181-187.
Banu, T.P., Borlea, G.F., and Banu C. (2016), The use of drones in forestry, Journal of Environmental Science and Engineering B, Vol. 5, pp. 557-562.
Bay, H., Ess, A., Tuytelaars, T., and Gool, L.V. (2008), Speeded-up robust features (SURF), Computer Vision and Image Understanding, Vol. 110, pp. 346-359.
Colomina, I. and Molina, P. (2014), Unmanned aerial systems for photogrammetry and remote sensing: a review, ISPRS
Journal of Photogrammetry and Remote Sensing, Vol. 92, pp. 79-97.
Corcoran, M. (2014), Drone Journalism: Newsgathering Applications of Unmanned Aerial Vehicle (UAVs) in Covering Conflict, Civil Unrest and Disaster, Australian Broadcasting Corporation, https://assets.documentcloud.
org/documents/1034066/final-drone-journalism-during- conflict-civil.pdf/ (last date accessed: 20 September 2020).
Daneshmand, M., Helmi, A., Avots, E., Noroozi, F., Alisinanoglu, F., Arslan, H.S., Gorbova, J., Haamer, R.E., Ozcinar, C., and Anbarjafari, G. (2018), 3D scanning: a comprehensive survey, arXiv:1801.08863, pp. 1-18.
Erdelj, M., Natalizio, E., Chowdhury, K.R., and Akyildiz, I.F.
(2017), Help from the sky: leveraging UAVs for disaster management, IEEE Pervasive Computer, Vol. 16, pp. 24- 32.
Fischler, M.A. and Bolles, R.C. (1981), Random sample consensus: a paradigm for model fitting with applications to image analysis and automated cartography, Communications of the ACM, Vol. 24, pp. 381-395.
González, E.F., Vega, F.A., Ramírez, F.C., and Carricondo, P.M. (2020), UAV photogrammetry accuracy assessment for corridor mapping based on the number and distribution of ground control points, Remote Sensing, Vol. 12, pp.
2447.
Google. Google Satellite Images, Google Earth Pro, http://
www.google.com/earth/index.html/ (last date accessed: 14 September 2020).
Holton, A.E., Lawson, S., and Love, C. (2015), Unmanned aerial vehicles opportunities, barriers, and the future of
“drone journalism”, Journalism Practice, Vol. 9, pp. 634- 650.
Javadnejad, F. (2017), Small Unmanned Aircraft Systems (UAS) for Engineering Inspections and Geospatial Mapping, Ph.D. dissertation, Oregon State University, Corvallis, Oregon, United States of America, 168p.
Lowe, D.G. (2004), Distinctive image features from scale- invariant keypoints, Intermational Journal of Computer Vision, Vol. 60, pp. 91-110.
Meinen, B.U. and Robinson, D.T. (2020), Mapping erosion and deposition in an agricultural landscape: optimization of UAV image acquisition schemes for SfM-MVS, Remote
Sensing of Environments, Vol. 239, pp. 1-10.
Nesbit, P.R. and Hugenholtz, C.H. (2019), Enhancing UAV- SfM 3D model accuracy in high-relief landscapes by incorporating oblique images, Remote Sensing, Vol. 11, pp. 239.
Rodríguez, M., Delon, J., and Morel, J.M. (2018), Fast affine invariant image matching, Image Processing on Line, Vol.
8, pp. 251-281.
Rumpler, M., Tscharf, A., Mostegel, C., Daftry, S., Hoppe, C., Prettenthaler, R., Fraundorfer, F., Mayer, G., and Bischof, H. (2017), Evaluations on multi-scale camera networks for precise and geo-accurate reconstructions from aerial and terrestrial images with user guidance, Computer Vision and Image Understanding, Vol. 157, pp. 255-273.
Solomitckii, D., Gapeyenko, M., Semkin, V., Andreev, S., and Koucheryavy, Y. (2018), Technologies for efficient amateur drone detection in 5G millimeter-wave cellular infrastructure, IEEE Communications Magazine, Vol. 56, pp. 43-50.
Suzuki, S. (2018), Recent researches on innovative drone technologies in robotics field, Advanced Robotics, Vol. 32, pp. 1008-1022.
Yoon, H.K. (2015), Use of drones in the cultural industries, Journal of the Korea Society of Digital Industry and Information Management, Vol. 11, pp. 99-112. (in Korean with English abstract)