R E S E A R C H A R T I C L E Open Access
A hybrid decision support model to discover informative knowledge in diagnosing acute appendicitis
Chang Sik Son
1, Byoung Kuk Jang
2, Suk Tae Seo
3, Min Soo Kim
3and Yoon Nyun Kim
1,2,3*Abstract
Background: The aim of this study is to develop a simple and reliable hybrid decision support model by combining statistical analysis and decision tree algorithms to ensure high accuracy of early diagnosis in patients with suspected acute appendicitis and to identify useful decision rules.
Methods: We enrolled 326 patients who attended an emergency medical center complaining mainly of acute abdominal pain. Statistical analysis approaches were used as a feature selection process in the design of decision support models, including the Chi-square test, Fisher ’s exact test, the Mann-Whitney U-test (p < 0.01), and Wald forward logistic regression (entry and removal criteria of 0.01 and 0.05, or 0.05 and 0.10, respectively). The final decision support models were constructed using the C5.0 decision tree algorithm of Clementine 12.0 after pre- processing.
Results: Of 55 variables, two subsets were found to be indispensable for early diagnostic knowledge discovery in acute appendicitis. The two subsets were as follows: (1) lymphocytes, urine glucose, total bilirubin, total amylase, chloride, red blood cell, neutrophils, eosinophils, white blood cell, complaints, basophils, glucose, monocytes, activated partial thromboplastin time, urine ketone, and direct bilirubin in the univariate analysis-based model; and (2) neutrophils, complaints, total bilirubin, urine glucose, and lipase in the multivariate analysis-based model. The experimental results showed that the model with univariate analysis (80.2%, 82.4%, 78.3%, 76.8%, 83.5%, and 80.3%) outperformed models using multivariate analysis (71.6%, 69.3%, 73.7%, 69.7%, 73.3%, and 71.5% with entry and removal criteria of 0.01 and 0.05; 73.5%, 66.0%, 80.0%, 74.3%, 72.9%, and 73.0% with entry and removal criteria of 0.05 and 0.10) in terms of accuracy, sensitivity, specificity, positive predictive value, negative predictive value, and area under ROC curve, during a 10-fold cross validation. A statistically significant difference was detected in the pairwise comparison of ROC curves (p < 0.01, 95% CI, 3.13-14.5; p < 0.05, 95% CI, 1.54-13.1). The larger induced decision model was more effective for identifying acute appendicitis in patients with acute abdominal pain, whereas the smaller induced decision tree was less accurate with the test data.
Conclusions: The decision model developed in this study can be applied as an aid in the initial decision making of clinicians to increase vigilance in cases of suspected acute appendicitis.
Keywords: Hybrid decision support model, Acute appendicitis, Knowledge discovery, Decision tree, Logistic regres- sion analysis
* Correspondence: [email protected]
1Department of Medical Informatics, School of Medicine, Keimyung University, 2800 Dalgubeoldaero, Dalseo-Gu, Daegu, Republic of Korea Full list of author information is available at the end of the article
© 2012 Son et al; licensee BioMed Central Ltd. This is an Open Access article distributed under the terms of the Creative Commons Attribution License (http://creativecommons.org/licenses/by/2.0), which permits unrestricted use, distribution, and reproduction in any medium, provided the original work is properly cited.
Background
Acute appendicitis is a common disease in emergency abdominal surgery with a lifetime occurrence of approxi- mately 7% and perforation rates of 17-20% [1-3]. The deci- sion to explore a patient with suspected acute appendicitis is based mainly on disease history and physical findings, but the clinical presentation is seldom typical [4]. Unfortu- nately, some patients with acute appendicitis are not diag- nosed until the occurrence of peritonitis or other severe complications while their surgeons are waiting for more evidence of acute appendicitis. These patients have a higher mortality and morbidity than patients who are diag- nosed in a timely manner [5]. Thus, a timely and accurate diagnosis of acute appendicitis is important for avoiding unnecessary diagnostic procedures and for identifying appropriate therapeutic measures and clinical manage- ment strategies. However, finding meaningful factors and identifying their relationships is difficult due to the numer- ous parameters that are routinely available, such as patient history and laboratory data, etc.
Computer-aided diagnosis of acute abdominal pain has challenged researchers for over 40 years. Since the pioneering work of de Dombal et al. [6], several studies have aimed to support the diagnosis of acute appendici- tis on the basis of grading medical history, clinical symptoms, and signs [7-9]. Eberhart [10] reported a comparison of appendicitis diagnosis versus non-specific abdominal pain using three different neural network paradigms: back propagation (BP), binary adaptive reso- nance theory (ART-1), and fuzzy resonance (Fuzzy- ART). Pesonen [11] compared the predictive perfor- mance of four different neural network algorithms in the diagnosis of acute appendicitis with different para- meter groups, i.e., ART-1, self-organizing maps (SOM), learning vector quantization (LVQ), and BP. It was found that supervised learning algorithms (LVQ and BP) performed better than unsupervised learning algorithms (ART-1 and SOM) in medical decision making pro- blems. Prabhudesai [12] evaluated artificial neural net- works (ANNs) for the diagnosis of appendicitis in patients presenting with acute right iliac fossa (RIF) pain and compared ANN performance with assessments made by experienced clinicians and the Alvarado score [13]. The ability of ANNs to accurately exclude the diagnosis of appendicitis in patients without true appen- dicitis was significantly better than clinical performance and an Alvarado score ≥ 6. All the neural network algo- rithms provided good performances in the diagnosis of acute appendicitis, but they had the following draw- backs: time-consuming depending on the size of training data, a black-box structure lacking transparency in the knowledge generated, and the inability to explain the decisions that were made.
Several other studies of acute abdominal pain and acute appendicitis have been performed, including deci- sion tree models. The performance of these models ran- ged from 43% to 95% [5,14-16]. Ting [5] modified the Alvarado scoring system (ASS) with a decision tree tech- nique and constructed a convenient and accurate deci- sion support model that consisted of RLQ tenderness, the Alvarado score, migrating pain, and a neutrophil count > 75% for acute appendicitis diagnosis and timing of laparotomy. Gaga [14] introduced the data represen- tation formalism ID+, which was derived from Quinlan’s ID3 algorithm, to facilitate the modeling of dependen- cies between attributes or attribute values, with multiple values per attribute. They used this method to demon- strate a medical knowledge acquisition application for abdominal pain in children. Ohmann [15] evaluated the performance of seven knowledge acquisition techniques, i.e., Bayes independence and rule induction techniques, ID3, NewId, PRISM, CN2, C4.5, and ITRULE. No over- all differences in accuracy were observed, except with NewId, which was less accurate compared with the other algorithms. None of the algorithms produced an overall accuracy of > 50%. Zorman [16] addressed the problem of separating acute appendicitis from other dis- eases causing acute abdominal pain with an improved decision tree approach based on the dynamic discretiza- tion of continuous attributes. This method was used to investigate the predictive performance of different deci- sion trees with three prospective databases: the COMAC-BME-European Community Concerted Action on Objective Medical Decision Making in Patients with Acute Abdominal Pain project, the German MEDWIS project A70 “Expert system for acute abdominal pain,”
and the COPERNICUS program no. 555 project.
Most of these studies have focused on the issues, the discriminatory power of decision support models, or the decision rules derived from different decision tree algo- rithms without performing a statistical comparison of the significance of their results. In this study, we present a hybrid decision support model that combines statisti- cal analysis and decision tree approaches to discover sig- nificant rules and provide high accuracy, early diagnosis for patients with suspected acute appendicitis.
Methods Data
After obtaining the Institutional Review Board (IRB)
approval (no. 11-275) from Keimyung University Dong-
san Hospital, we retrospectively collected the medical
records of all patients attending the emergency medical
center complaining mainly of acute abdominal pain
between July 2006 and June 2007. Only complete medi-
cal records with no missing clinical parameters were
included, i.e., age, gender, chief complaints, and clinical laboratory findings, such as urinalysis, common blood cell and differential counts, serum electrolytes, routine admission, etc. To analyze the chief complaints, we split the abdomen areas into eight distinct regions (Table 1) based on four abdominal quadrants [14], i.e., the right upper quadrant (RUQ), right lower quadrant (RLQ), left upper quadrant (LUQ), and left lower quadrant (LLQ).
Patients diagnosed with complaints other than appendi- citis were excluded, such as acute cholecystitis or diver- ticulitis, appendectomy incidental to another surgical procedure, previous use of antibiotics for chronic appen- dicitis, and appendectomy for chronic abdominal pain.
The eligibility for study group (n = 152) was defined according to the International Classification of Diseases- 10 (ICD-10) codes: K35.0 (acute appendicitis with gener- alized peritonitis), K35.1 (acute appendicitis with perito- neal abscess), and K35.9 (acute appendicitis without generalized peritonitis). Discharged patients (n = 174) admitted to the emergency medical center who com- plained mainly of acute abdominal pain were defined as the control group. All data collected were reconfirmed by gastroenterologists.
Statistical analysis and decision tree model
Statistical analysis was performed using SPSS 12.0 for Windows (SPSS Inc., Chicago, IL, USA). Univariate cor- relations between clinical or laboratory features were evaluated using the Chi-square test or Fisher’s exact test, which are appropriate for categorical data, and using the Student t-test or Mann-Whitney U-test with continuous variables, after checking for normality using the Kolmogorov-Smirnov test. A two-tailed p < 0.01 was selected as the level of statistical significance. In the multivariate analysis, the Wald forward logistic regres- sion model, with entry and removal criteria of 0.01 and 0.05, or 0.05 and 0.10, respectively, was used to identify independent predictors of acute appendicitis. Modeling results were expressed as the odds ratios (OR) with 95%
confidence intervals (95% CI). The Hosmer-Lemeshow test (H) was used to assess the fit of the models, which divides subjects into deciles based on their predicted probabilities before computing Chi-square values from the observed and expected frequencies [17-20].
After the feature selection process, Quinlan’s C5.0 decision tree algorithm [21,22] was used to design the final decision support models. This approach provides a very simple representation of accumulated knowledge and it also facilitates the derivation of an explanation for the decision, which is essential in medical applications.
The model selects the best decision node that separates the different classes from the empirical data [23]. The main induction loop of the decision tree is as follows
Table 1 Comparison of patient characteristics (age, gender, chief complaints, and urinalysis) for acute appendicitis and discharged patients (n = 326)
Characteristics AA* (n = 152) Control**
(n = 174) p value Age, yrs† 36.57 ± 21.31 43.05 ± 20.86 0.003††
Gender 0.021
Male 77 (50.7%) 66 (37.9%)
Female 75 (49.3%) 108 (62.1%)
Chief complaints 0.000††
abdominal 76 (50.0%) 109 (62.6%)
left upper quadrant (LUQ) 0 (0.0%) 1 (0.6%) periumbilical area 4 (2.6%) 10 (5.7%) right lower quadrant (RLQ) 60 (39.5%) 16 (9.2%) left lower quadrant (LLQ) 0 (0.0%) 5 (2.9%)
lower abdominal 5 (3.3%) 18 (10.3%)
right upper quadrant (RUQ) 6 (3.9%) 15 (8.6%)
upper abdominal 1 (0.7%) 0 (0.0%)
Urinalysis
Color 0.407
amber 10 (6.6%) 6 (3.4%)
brown 1 (0.7%) 1 (0.6%)
straw 140 (92.1%) 167 (96.0%)
yellow 1 (0.7%) 0 (0.0%)
S.G.† 1.02 ± 0.01 1.02 ± 0.01 0.106
pH† 6.61 ± 0.93 6.43 ± 0.92 0.086
Albumin 0.412
negative 127 (83.6%) 151 (86.8%)
positive 25 (16.4%) 23 (13.2%)
Glucose 0.000††
negative 116 (76.3%) 170 (97.7%)
positive 36 (23.7%) 4 (2.3%)
Ketone 0.000††
negative 98 (64.5%) 149 (85.6%)
positive 54 (35.5%) 25 (14.4%)
O.B. 0.578
negative 104 (68.4%) 114 (65.5%)
positive 48 (31.6%) 60 (34.5%)
Urobilinogen, E.U./dL† 0.52 ± 1.49 0.22 ± 0.54 0.020
Bilirubin 0.983
negative 139 (91.4%) 159 (91.4%)
positive 13 (8.6%) 15 (8.6%)
Nitrite 0.689
negative 150 (98.7%) 170 (97.7%)
positive 2 (1.3%) 4 (2.3%)
WBC1 0.345
negative 99 (65.1%) 122 (70.1%)
positive 53 (34.9%) 52 (29.9%)
RBC 0.972
negative 53 (34.9%) 61 (35.1%)
positive 99 (65.1%) 113 (64.9%)
WBC2 0.936
negative 11 (7.2%) 13 (7.5%)
[5]: i) assume A as the possible “best” decision attribute for the next node; ii) assign A as the decision attribute for the node; iii) for each value of A, create a new des- cendent of the node; iv) count the entropies of the training examples to the leaf nodes; and v) stop search- ing for new leaf nodes if training examples are well-clas- sified, or continue the new leaf nodes if they are not well-classified. The decision tree model used in this study was built with C5.0 component using the default experimental parameters of Clementine version 12.0 (SPSS Inc., Chicago, IL, USA).
Structure of the clinical decision support model and its evaluation
Figure 1 shows the scheme of the decision support models, which were based on statistical tests (i.e., uni- variate analysis, p < 0.01) and the Wald forward logistic
regression (entry and removal criteria of 0.01 and 0.05 or 0.05 and 0.10), for diagnosis of acute appendicitis.
We used 10-fold cross validation experiments to provide an unbiased estimate of the generalization error. The full dataset was randomly divided into 10 subsets: nine subsets were used for training (90%), while the remain- ing subset was used for testing (10%). The process was then repeated 10 times. The performance of the models was evaluated using six standard measures: accuracy (ACC), sensitivity (SENS), specificity (SPEC), positive predictive value (PPV), negative predictive value (NPV), and the area under the ROC curve (AUC). We also made a pairwise comparison [24,25] between the ROC curves of the models to test for statistically significant differences.
Results
Of the 326 patients enrolled in this study, 152 (46.6%) had acute appendicitis, while 174 (53.4%) were dis- charged. Significant differences were observed in terms of age ( p < 0.01), complaints (p < 0.001), urine glucose ( p < 0.001), and urine ketone (p < 0.001), among the acute appendicitis patients (mean age, 36.57 years) and the discharged patients (mean age, 43.05 years). Abdom- inal and RLQ pains were the most common complaints presented in the emergency medical center (Table 1).
In terms of blood test findings, white blood cell (p <
0.001), red blood cell (p < 0.01), neutrophils (p <
0.001), glucose (p < 0.01), total bilirubin (p < 0.001), direct bilirubin (p < 0.001), and activated partial thromboplastin time (p < 0.01) were significantly or slightly higher in patients with acute appendicitis, whereas lymphocytes (p < 0.001), monocytes (p <
0.001), eosinophils ( p < 0.001), basophils (p < 0.001), large unstained cells ( p < 0.001), sodium (p < 0.001), chloride ( p < 0.001), lipase (p < 0.001), and total amy- lase ( p < 0.001) were significantly higher in discharged patients. The remaining variables could not be used to differentiate acute appendicitis from the discharged patients (Table 2).
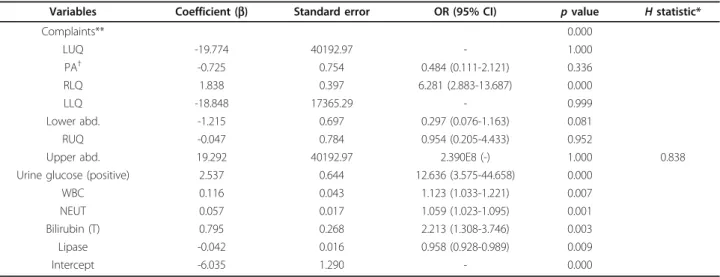
In the multivariate analysis, independent risk factors were identified using Wald forward logistic regression, to define entry and removal criteria of 0.01 and 0.05, or 0.05 and 0.10, respectively. Regardless of the criteria used, the independent risk factors provided the same results using the two logistic models. We included six variables in the final logistic regression that were inde- pendently associated with acute appendicitis: complaints, urine glucose, white blood cell, neutrophils, total biliru- bin, and lipase (Table 3). These variables were tested by linear regression analysis to evaluate multicollinearity among the predictors. The data did not violate the mul- ticollinearity assumption. The tolerance of each inde- pendent variable was greater than 0.616. The variance
Figure 1 Scheme of the decision support models.
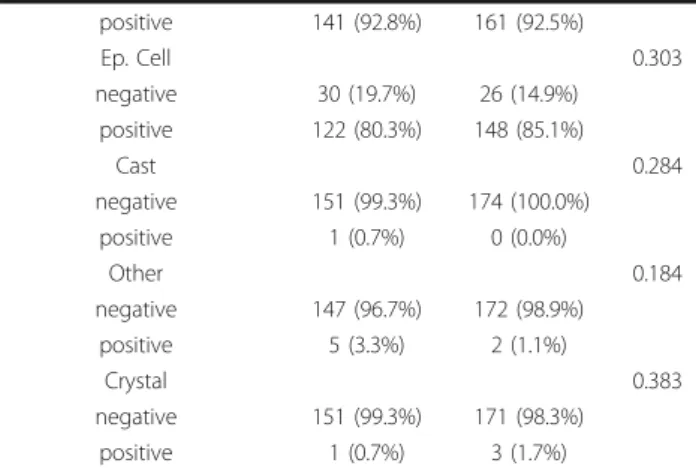
Table 1 Comparison of patient characteristics (age, gen- der, chief complaints, and urinalysis) for acute appendici- tis and discharged patients (n = 326) (Continued)
positive 141 (92.8%) 161 (92.5%)
Ep. Cell 0.303
negative 30 (19.7%) 26 (14.9%)
positive 122 (80.3%) 148 (85.1%)
Cast 0.284
negative 151 (99.3%) 174 (100.0%)
positive 1 (0.7%) 0 (0.0%)
Other 0.184
negative 147 (96.7%) 172 (98.9%)
positive 5 (3.3%) 2 (1.1%)
Crystal 0.383
negative 151 (99.3%) 171 (98.3%)
positive 1 (0.7%) 3 (1.7%)
* acute appendicitis; ** discharged patients;†Mean ± SD;††p < 0.01
inflation factor (VIF) values of the variables ranged from 1.005 to 1.624. The ACC, SENS, SPEC, PPV, and NPV, were 79.8%, 76.3%, 82.8%, 79.5%, and 80.0%, respec- tively. The AUC of the models was 79.5% (95% CI, 74.7- 83.8), indicating fair discriminatory power. The good- ness-of-fit (H) statistic indicated that the models were well calibrated (p = 0.838).
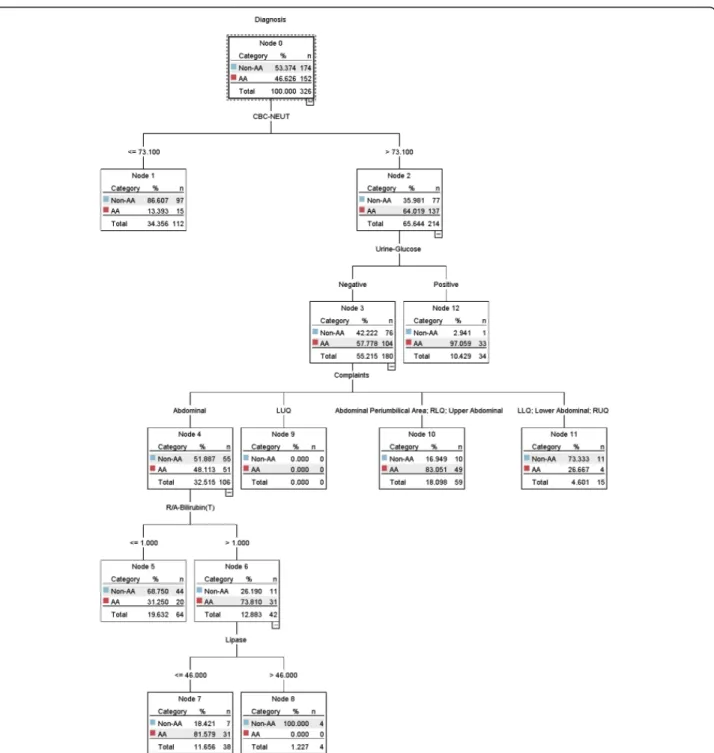
Decision support model based on multivariate analysis Five of the six variables (Table 3) were selected by the C5.0 decision tree model and their importance was defined in the following order: neutrophils, complaints, total bilirubin, urine glucose, and lipase. The cut-off points were determined using the C5.0 decision tree algorithm and the criteria for dichotomizing the contin- uous variables were all statistically significant (p < 0.05) except for LUQ pain (OR, 0.732; 95% CI, 0.014-37.307;
p = 0.876). The results are summarized in Table 4. The decision support model is shown in Figure 2 and eight decision rules were generated from the full dataset.
Seven decision rules (in Figure 2, leaf nodes 1, 5, 7, 8, 10, 11, and 12) were statistically significant, excluding leaf node LUQ (node 9). Three rules were associated with acute appendicitis as follows: 1) neutrophils >
73.1% and urine glucose is positive ( p < 0.01); 2) neutro- phils > 73.1% and urine glucose is negative and perium- bilical area pain, or upper abdominal pain, or RLQ pain ( p < 0.001); 3) neutrophils > 73.1% and urine glucose is negative and abdominal pain, and total bilirubin > 1.0 mg/dL, and lipase ≤ 46 U/L (p < 0.05). The ACC, SENS, SPEC, PPV, NPV, and AUC measures were 82.5%, 74.3%, 89.7%, 86.3%, 80.0%, and 82.0% (95% CI, 77.4- 86.0), respectively.
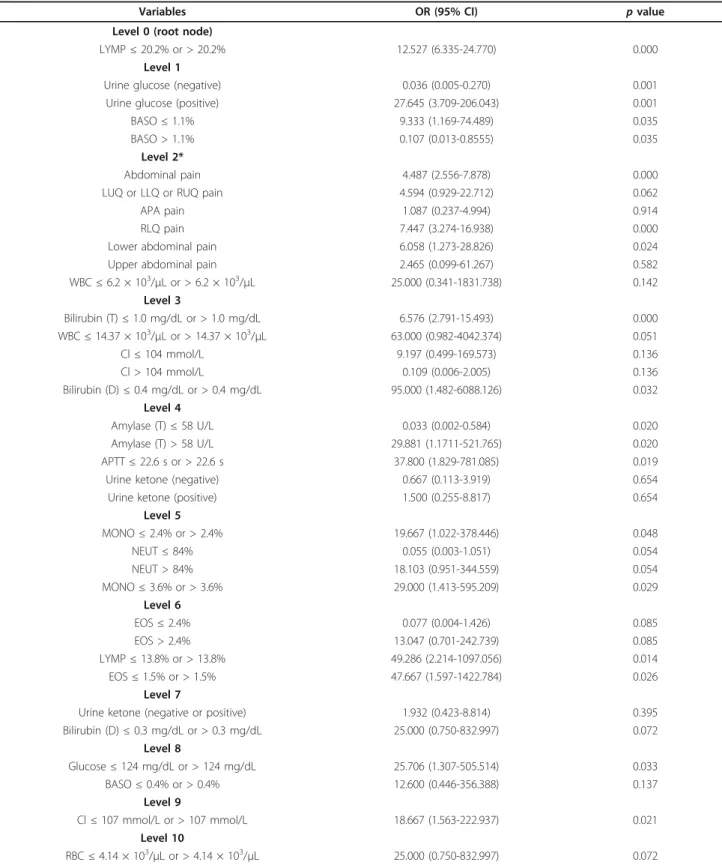
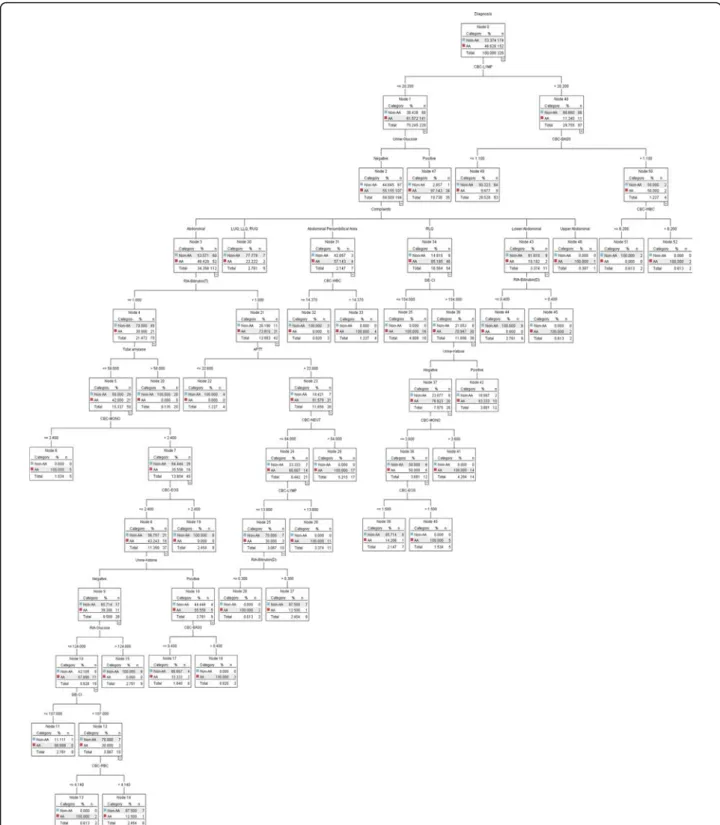
Decision support model based on univariate analysis Sixteen of the 20 variables with p < 0.01 (Tables 1 and 2) were selected by the C5.0 decision tree algorithm and their importance was defined in the following order:
lymphocytes, urine glucose, total bilirubin, total amylase, chloride, red blood cell, neutrophils, eosinophils, white blood cell, complaints, basophils, glucose, monocytes, activated partial thromboplastin time, urine ketone, and direct bilirubin. The criteria for the selected cut-off points are summarized in Table 5. The decision support model for the diagnosis of acute appendicitis is shown in Figure 3 and its performance was 93.9%, 89.5%, 97.7%, 97.1%, 91.4%, and 93.6% (95% CI, 90.4-96.0). We generated 29 decision rules, i.e., 16 for acute appendici- tis and 13 for the control group. Thirteen decision rules (in Figure 3: leaf nodes 6, 11, 15, 20, 22, 28, 39, 40, 41, 44, 45, 47, and 49) were statistically significant. Seven rules were associated with acute appendicitis as follows:
1) lymphocytes ≤ 20.2% and urine glucose is positive (p
< 0.01); 2) lymphocytes ≤ 20.2% and urine glucose is negative and lower abdominal pain and direct bilirubin
> 0.4 mg/dL ( p < 0.05); 3) lymphocytes ≤ 20.2% and urine glucose is negative and RLQ pain and chloride >
104 mmol/L and urine ketone is negative and mono- cytes > 3.6% (p < 0.05); 4) lymphocytes ≤ 20.2% and urine glucose is negative and RLQ pain and chloride >
104 mmol/L and urine ketone is negative and mono- cytes ≤ 3.6% and eosinophils > 1.5% (p < 0.05); 5) Table 2 Comparison of patient characteristics (CBC &
Differential Count, Serum Electrolytes, Routine Admission, etc.) for acute appendicitis and discharged patients (n = 326)
Characteristics AA*
(n = 152)
Control**
(n = 174) p value CBC & Differential Count†
WBC, × 103/μL 13.47 ± 4.90 9.47 ± 3.91 0.000††
RBC, × 103/μL 4.50 ± 0.55 4.29 ± 0.59 0.001††
HGB, g/dL 13.51 ± 1.83 13.08 ± 1.83 0.037
HCT,% 39.03 ± 4.92 37.93 ± 5.23 0.027
MCV, fl 86.96 ± 5.54 88.58 ± 5.69 0.010
MCH, pg 30.16 ± 2.24 30.62 ± 2.32 0.074
MCHC, g/dL 34.73 ± 1.33 34.59 ± 1.34 0.343 PLT, × 103/μL 268.69 ± 81.29 262.43 ± 78.51 0.480 NEUT,% 81.48 ± 8.62 69.28 ± 14.14 0.000††
LYMP,% 12.51 ± 6.95 22.75 ± 12.49 0.000††
MONO,% 4.08 ± 1.91 4.67 ± 1.78 0.000††
EOS,% 1.30 ± 0.91 2.14 ± 1.70 0.000††
BASO,% 0.37 ± 0.27 0.49 ± 0.37 0.000††
LUC,% 1.20 ± 0.73 1.73 ± 0.99 0.000††
MPV, fl 7.72 ± 0.68 7.76 ± 0.73 0.633
Serum Electrolyte†
Na, mmol/L 143.11 ± 2.83 144.01 ± 3.35 0.000††
K, mmol/L 4.19 ± 0.44 4.21 ± 0.42 0.705
Cl, mmol/L 106.12 ± 3.25 107.25 ± 3.83 0.000††
Routine Admission†
Calcium (T), mg/dL 9.11 ± 0.52 9.10 ± 0.52 0.874 Inorganic Phosphorus, mg/dL 3.36 ± 0.82 3.43 ± 0.80 0.490 Glucose, mg/dL 127.39 ± 36.23 116.61 ± 40.64 0.001††
BUN, mg/dL 13.15 ± 7.92 13.86 ± 6.44 0.376 Creatinine, mg/dL 0.88 ± 0.25 0.94 ± 0.51 0.229 Cholesterol (T), mg/dL 169.19 ± 37.91 174.44 ± 38.84 0.219 Protein (T), g/dL 7.21 ± 0.63 7.18 ± 0.57 0.650 Albumin, g/dL 4.23 ± 0.37 4.20 ± 0.36 0.404 Bilirubin (T), mg/dL 1.24 ± 0.66 0.90 ± 0.48 0.000††
Bilirubin (D), mg/dL 0.36 ± 0.16 0.26 ± 0.17 0.000††
ALP, U/L 97.61 ± 70.85 88.05 ± 52.93 0.174 AST, U/L 25.70 ± 12.84 31.01 ± 27.80 0.025 ALT, U/L 22.97 ± 20.90 24.70 ± 19.75 0.444 APTT†, s 29.92 ± 4.78 29.43 ± 12.01 0.007††
PT†, s 1.03 ± 0.12 1.01 ± 0.13 0.028
Lipase†, U/L 24.14 ± 7.70 31.70 ± 16.89 0.000††
Amylase (T)†, U/L 46.86 ± 27.77 55.04 ± 26.90 0.000††
* acute appendicitis; ** discharge patients;†Mean ± SD;††p < 0.01
lymphocytes ≤ 20.2% and urine glucose is negative and abdominal pain and total bilirubin ≤ 1.0 mg/dL and total amylase ≤ 58 U and monocytes ≤ 2.4% (p < 0.05);
6) lymphocytes ≤ 20.2% and urine glucose is negative and abdominal pain and total bilirubin > 1.0 mg/dL and activated partial thromboplastin time > 22.6 s and neu- trophils ≤ 84% and lymphocytes > 13.8% (p < 0.05); 7) lymphocytes ≤ 20.2% and urine glucose is negative and
abdominal pain and total bilirubin ≤ 1.0 mg/dL and total amylase ≤ 58 U and monocytes > 2.4% and eosino- phils ≤ 2.4% and urine ketone is negative and glucose ≤ 124 mg/dL and chloride ≤ 107 mmol/L (p < 0.05).
The six measures were compared using a 10-fold cross validation to assess the generalization ability of these decision support models. The differences in the clinical factors selected before and after the application of the C5.0 decision tree algorithm are shown in Tables 6 and 7. This showed that the decision support model based on univariate analysis was superior to those based on multivariate analyses with different conditions (Table 8).
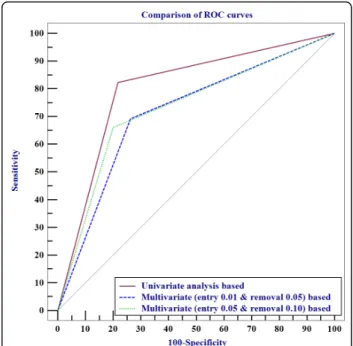
The decision support model based on the univariate analysis was statistically superior to those based on mul- tivariate analyses in terms of predictive power and dis- criminatory capacity, which was expressed by the area under the ROC curve (p < 0.01, 95% CI, 3.13-14.5; p <
0.05, 95% CI, 1.54-13.1; Table 9 and Figure 4). The deci- sion support model based on multivariate analysis using loose criteria was also better than that using strict cri- teria, especially the AUC measure, although the discri- minatory power between the two models was not statistically significant ( p = 0.400; 95% CI, -2.0-5.02).
Discussion
From a clinical viewpoint, one of the most difficult pro- blems is distinguishing patients with suspected acute appendicitis from those with acute abdominal pain.
Thus, we developed a hybrid decision support model based on a decision tree algorithm and statistical analy- sis to reduce the high workload of clinicians. We also investigated the different diagnostic knowledge provided Table 3 Multivariate analysis of predictors of acute appendicitis (entry and removal criteria of 0.01 and 0.05, or 0.05 and 0.10)
Variables Coefficient (b) Standard error OR (95% CI) p value H statistic*
Complaints** 0.000
LUQ -19.774 40192.97 - 1.000
PA† -0.725 0.754 0.484 (0.111-2.121) 0.336
RLQ 1.838 0.397 6.281 (2.883-13.687) 0.000
LLQ -18.848 17365.29 - 0.999
Lower abd. -1.215 0.697 0.297 (0.076-1.163) 0.081
RUQ -0.047 0.784 0.954 (0.205-4.433) 0.952
Upper abd. 19.292 40192.97 2.390E8 (-) 1.000 0.838
Urine glucose (positive) 2.537 0.644 12.636 (3.575-44.658) 0.000
WBC 0.116 0.043 1.123 (1.033-1.221) 0.007
NEUT 0.057 0.017 1.059 (1.023-1.095) 0.001
Bilirubin (T) 0.795 0.268 2.213 (1.308-3.746) 0.003
Lipase -0.042 0.016 0.958 (0.928-0.989) 0.009
Intercept -6.035 1.290 - 0.000
R2= 0.428; n = 326
* Hosmer-Lemeshow goodness-of-fit (H) statistic
** abdominal pain as reference category
†periumbilical area
Table 4 Statistical significance of cut-off points determined using the C5.0 decision tree algorithm (for multivariate analysis)
Variables OR (95% CI) p
value Level 0 (root node)
NEUT≤ 73.1% or > 73.1% 11.506 (6.244-21.202) 0.000 Level 1
Urine glucose (negative) 0.041 (0.006-0.310) 0.002 Urine glucose (positive) 24.115 (3.227-
180.216)
0.002
Level 2*
Abdominal pain 2.722 (1.445-5.125) 0.002
LUQ pain 0.732 (0.014-37.307) 0.876
PA or RLQ or Upper abdominal pain 5.880 (2.727-12.681) 0.000 LLQ or Lower abdominal or RUQ pain 4.231 (1.292-13.855) 0.017
Level 3
Bilirubin (T)≤ 1.0 mg/dL or > 1.0 mg/
dL
6.200 (2.604-14.762) 0.000
Level 4
Lipase≤ 46 U/L or > 46 U/L 37.800 (1.829- 781.085)
0.019
* LUQ, left upper quadrant; PA, periumbilical area; RLQ, right lower quadrant;
LLQ, left lower quadrant; RUQ, right upper quadrant
by the decision support models. We extracted subsets from the univariate analysis-based model (lymphocytes, urine glucose, total bilirubin, total amylase, chloride, red blood cell, neutrophils, eosinophils, white blood cell, complaints, basophils, glucose, monocytes, activated par- tial thromboplastin time, urine ketone, direct bilirubin) and from the multivariate analysis based model (neutro- phils, complaints, total bilirubin, urine glucose, lipase) that were indispensable for discovering early diagnostic
knowledge (i.e., relationships among these parameters) related to acute appendicitis, although several criteria did not reach statistical significance (Tables 4 and 5).
The clinical parameters included well-known risk fac- tors for acute appendicitis described in previous studies, i.e., neutrophils (or lymphocytes), eosinophils, RLQ ten- derness, amylase, and lipase. Kalan [26] produced a modified Alvarado score by removing neutrophils from the model. However, the present study showed that the
Figure 2 Decision support model based on Wald logistic regression (entry and removal of 0.01 and 0.05, or 0.05 and 0.10).
Table 5 Statistical significance of cut-off points determined using the C5.0 decision tree algorithm (for univariate analysis)
Variables OR (95% CI) p value
Level 0 (root node)
LYMP≤ 20.2% or > 20.2% 12.527 (6.335-24.770) 0.000
Level 1
Urine glucose (negative) 0.036 (0.005-0.270) 0.001
Urine glucose (positive) 27.645 (3.709-206.043) 0.001
BASO≤ 1.1% 9.333 (1.169-74.489) 0.035
BASO > 1.1% 0.107 (0.013-0.8555) 0.035
Level 2*
Abdominal pain 4.487 (2.556-7.878) 0.000
LUQ or LLQ or RUQ pain 4.594 (0.929-22.712) 0.062
APA pain 1.087 (0.237-4.994) 0.914
RLQ pain 7.447 (3.274-16.938) 0.000
Lower abdominal pain 6.058 (1.273-28.826) 0.024
Upper abdominal pain 2.465 (0.099-61.267) 0.582
WBC≤ 6.2 × 10³/μL or > 6.2 × 10³/μL 25.000 (0.341-1831.738) 0.142
Level 3
Bilirubin (T)≤ 1.0 mg/dL or > 1.0 mg/dL 6.576 (2.791-15.493) 0.000
WBC≤ 14.37 × 10³/μL or > 14.37 × 10³/μL 63.000 (0.982-4042.374) 0.051
Cl≤ 104 mmol/L 9.197 (0.499-169.573) 0.136
Cl > 104 mmol/L 0.109 (0.006-2.005) 0.136
Bilirubin (D)≤ 0.4 mg/dL or > 0.4 mg/dL 95.000 (1.482-6088.126) 0.032
Level 4
Amylase (T)≤ 58 U/L 0.033 (0.002-0.584) 0.020
Amylase (T) > 58 U/L 29.881 (1.1711-521.765) 0.020
APTT≤ 22.6 s or > 22.6 s 37.800 (1.829-781.085) 0.019
Urine ketone (negative) 0.667 (0.113-3.919) 0.654
Urine ketone (positive) 1.500 (0.255-8.817) 0.654
Level 5
MONO≤ 2.4% or > 2.4% 19.667 (1.022-378.446) 0.048
NEUT≤ 84% 0.055 (0.003-1.051) 0.054
NEUT > 84% 18.103 (0.951-344.559) 0.054
MONO≤ 3.6% or > 3.6% 29.000 (1.413-595.209) 0.029
Level 6
EOS≤ 2.4% 0.077 (0.004-1.426) 0.085
EOS > 2.4% 13.047 (0.701-242.739) 0.085
LYMP≤ 13.8% or > 13.8% 49.286 (2.214-1097.056) 0.014
EOS≤ 1.5% or > 1.5% 47.667 (1.597-1422.784) 0.026
Level 7
Urine ketone (negative or positive) 1.932 (0.423-8.814) 0.395
Bilirubin (D)≤ 0.3 mg/dL or > 0.3 mg/dL 25.000 (0.750-832.997) 0.072
Level 8
Glucose≤ 124 mg/dL or > 124 mg/dL 25.706 (1.307-505.514) 0.033
BASO≤ 0.4% or > 0.4% 12.600 (0.446-356.388) 0.137
Level 9
Cl≤ 107 mmol/L or > 107 mmol/L 18.667 (1.563-222.937) 0.021
Level 10
RBC≤ 4.14 × 10³/μL or > 4.14 × 10³/μL 25.000 (0.750-832.997) 0.072
* LUQ, left upper quadrant; LLQ, left lower quadrant; RUQ, right upper quadrant; PA, periumbilical area; RLQ, right lower quadrant
neutrophil count is a very important factor when evalu- ating patients with acute appendicitis [27], especially children [28,29]. Clark [30] tested the eosinophil count in the diagnostic evaluation of patients presenting with
acute abdominal pain who subsequently underwent appendectomy and whether eosinophilia was related to subsequent histology. Patients with abdominal pain and peripheral eosinophils appeared less likely to have acute
Figure 3 Decision support model based on univariate analysis.
Table 6 Clinical factors selected before the application of C5.0 decision tree algorithm during 10-fold cross validation
VariablesFold1Fold2Fold3Fold4Fold5Fold6Fold7Fold8Fold9Fold10 M1M2M3M1M2M3M1M2M3M1M2M3M1M2M3M1M2M3M1M2M3M1M2M3M1M2M3M1M2M3 AgeOOOOOO ComplaintsOOOOOOOOOOOOOOOOOOOOOOOOOOOO UrinepHOO UrineglucoseOOOOOOOOOOOOOOOOOOOOOOOOOOOO UrineketoneOOOOOOOOOO UrineUrobilinogenOOO WBCOOOOOOOOOOOOO RBCOOOOOOOOOO NEUTOOOOOOOOOOOOOOOOOOOOOOOOOOOOOO LYMPOOOOOOOOOO MONOOOOOO EOSOOOOOOOOOOO BASOOOOOOOOOOO LUCOOOOOOOOOO Bilirubin(T)OOOOOOOOOOO Bilirubin(D)OOOOOOOOOOOOO LipaseOOOOOOOOOOOOOOOOOOOO Amylase(T)OO M1:univariateanalysis(p<0.01) M2:multivariateanalysis(entryandremovalcriteriaof0.01and0.05) M3:multivariateanalysis(entryandremovalcriteriaof0.05and0.10)Table 7 Clinical factors selected after the application of C5.0 decision tree algorithm during 10-fold cross validation
VariablesFold1Fold2Fold3Fold4Fold5Fold6Fold7Fold8Fold9Fold10 M1M2M3M1M2M3M1M2M3M1M2M3M1M2M3M1M2M3M1M2M3M1M2M3M1M2M3M1M2M3 AgeOOOO ComplaintsOOOOOOOOOOOOOOOOOOOOOOOOOOO UrinepHOO UrineglucoseOOOOOOOOOOOOOOOOOOOOOOOOO UrineketoneOOOOOO WBCOOOOOOOOOOOO RBCOOOOOOO NEUTOOOOOOOOOOOOOOOOOOOOOOOOO LYMPOOOOOOOOOO MONOO EOSOOOOOOOO BASOOOOOOOOOOO LUCOOOOOOOOO Bilirubin(T)OOOOOOOOOO Bilirubin(D)OOOOOOOOOOO LipaseOOOOOOOOOOOOOOO Amylase(T)OO M1:C5.0decisiontreealgorithmwithunivariateanalysis(p<0.01) M2:C5.0decisiontreealgorithmwithmultivariateanalysis(entryandremovalcriteriaof0.01and0.05) M3:C5.0decisiontreealgorithmwithmultivariateanalysis(entryandremovalcriteriaof0.05and0.10)appendicitis based on their subsequent histology. San- tosh [31] reported significant local eosinophil activation and degranulation during acute appendicitis, which was sufficient to elevate serum levels of eosinophil chemo- tactic protein. However, the inverse relationship between the duration of symptoms and serum eosinophil cationic protein was not statistically significant in cases of acute appendicitis. Um [32] reported the case of a 17-year-old female, who was characterized by increased serum amy- lase activities combined with normal serum lipase, nor- mal creatinine, and a low amylase/creatinine clearance ratio. She was diagnosed with macroamylasemia and acute appendicitis without apparent clinical symptoms of a pancreatic disorder.
We performed a 10-fold cross validation to estimate the diagnostic accuracy of the decision support models.
The results showed that the larger induced decision model was more effective at distinguishing patients with acute appendicitis from those with acute abdominal pain, whereas the compact decision model, with a smal- ler induced decision tree, was less accurate for the test data. The range of diagnostic accuracy was approxi- mately 83-94% for the full dataset and 72-80% for the 10-fold cross validation, compared with the average accuracy in previous studies of acute abdominal pain [14,15] or acute appendicitis [5,16]. Several explanations
provided similar or better results, which can be sum- marized as follows.
I) In our dataset, the sample size of each decision or diagnosis had a balanced distribution. In contrast, the distribution of diagnoses reported for these studies was extremely imbalanced, e.g., one diagnosis was repre- sented by a significantly lower number of cases than the others [15]. The decision boundary learned by a stan- dard machine learning algorithm, such as a decision tree algorithm, can be severely skewed toward either a posi- tive or negative decision. Consequently, the false nega- tive or positive rate can be excessively high. One research approach for overcoming the class imbalance problem is to resample the original training dataset, by either oversampling the minority class and/or under- sampling the majority class until decisions are repre- sented in a more balanced way [33].
Table 8 Performance of decision support models based on univariate and multivariate analysis (10-fold cross validation)
Performance ACC SENS SPEC PPV NPV AUC
Based on univariate analysis*
80.2 82.4 78.3 76.8 83.5 80.3
Based on multivariate analysis**
71.6 69.3 73.7 69.7 73.3 71.5
Based on multivariate analysis†
73.5 66.0 80.0 74.3 72.9 73.0
* p < 0.01; standard error: 2.54 (95% CI, 75.6-84.5)
** entry and removal criteria of 0.01 and 0.05; standard error: 2.89 (95% CI, 66.3-76.3)
†entry and removal criteria of 0.05 and 0.10; standard error: 2.86 (95% CI, 67.9-77.7)
Table 9 Discriminatory capacity of decision support models used for the diagnosis of acute appendicitis expressed as areas under ROC curves (95% CI)
Pairwise comparison of ROC curves
Based on univariate analysis* Based on multivariate analysis** Based on multivariate analysis†
Based on univariate analysis* - p < 0.01
(95% CI: 3.13-14.5)
p < 0.05 (95% CI, 1.54-13.1) Based on multivariate analysis** p < 0.01
(95% CI, 3.13-14.5)
- p = 0.400
(95% CI, -2.0-5.02) Based on multivariate analysis† p < 0.05
(95% CI, 1.54-13.1)
p = 0.400 (95% CI, -2.0-5.02)
-
* p < 0.01
** entry and removal criteria of 0.01 and 0.05
†entry and removal criteria of 0.05 and 0.10
Figure 4 Comparison of ROC curves for the decision support models.
II) We used the reduced clinical parameters set after applying the univariate or multivariate analysis as a fea- ture selection approach when constructing the final decision support model. This dataset was smaller com- pared with the number of parameters used in previous studies. Our dataset quality may even be increased by selecting informative features from a high-dimensional dataset. This reduces the time required to perform induction and it makes the resulting rules more compre- hensible, thereby increasing the resulting accuracy [34,35].
This study had the following limitations because of its retrospective study design. The number of patients with acute appendicitis and non-acute appendicitis was rela- tively small, which produced variations when deriving the relevant parameters and their relationships. The fea- sibility of using derived rules has been verified using an external validation study [4] or a prospective studies [9,15,16]. These considerations may provide fruitful directions for further research.
Conclusions
This study developed a simple and reliable hybrid deci- sion support model based on statistical analyses and a decision tree algorithm to provide high accuracy, early diagnosis of patients with suspected acute appendicitis.
This model also facilitated diagnostic knowledge discov- ery using the derived rules. The experimental results show that a decision support model based on univariate analysis provided excellent discrimination and we demonstrated its feasibility for predicting acute appendi- citis. Therefore, the decision model developed in our study can be applied to support the initial decision of clinicians and increase vigilance when detecting sus- pected acute appendicitis.
Abbreviations
S.G: Specific gravity; O.B: Occult blood; WBC: White blood cell; RBC: Red blood cell; Ep. Cell: Epithelial cell: HGB: Hemoglobin; HCT: Hematocrit; MCV:
Mean corpuscular volume; MCH: Mean corpuscular hemoglobin; MCHC:
Mean corpuscular hemoglobin concentration; PLT: Platelet count; NEUT:
Neutrophils; LYMP: Lymphocytes; MONO: Monocytes; EOS: Eosinophils; BASO:
Basophils; LUC: Large unstained cells; MPV: Mean platelet volume; Na:
Sodium; K: Potassium; Cl: Chloride; BUN: Blood urea nitrogen; ALP: Alkaline phosphatase; AST: Aspartate aminotransferase; ALT: Alanine aminotransferase;
APTT: Activated partial thromboplastin time; PT: Prothrombin time.
Acknowledgements
This research was supported by the Basic Science Research Program through the National Research Foundation of Korea (NRF) funded by the Ministry of Education, Science and Technology (2011-0014736), and by Grant No. RTI04- 01-01 from the Regional Technology Innovation Program of the Ministry of Knowledge Economy (MKE).
Author details
1Department of Medical Informatics, School of Medicine, Keimyung University, 2800 Dalgubeoldaero, Dalseo-Gu, Daegu, Republic of Korea.
2Department of Internal Medicine, School of Medicine, Keimyung University, 2800 Dalgubeoldaero, Dalseo-Gu, Daegu, Republic of Korea.3Biomedical
Information Technology Center, School of Medicine, Keimyung University, 2800 Dalgubeoldaero, Dalseo-Gu, Daegu, Republic of Korea.
Authors’ contributions
CSS conceived the study and participated in data analysis and the computation of performance values. BKJ was the consultant for the knowledge of (differential) diagnosis of acute appendicitis disease. STS and MSK interpreted the concept of the model prototype and helped revise the manuscript. YNK is the corresponding author who conceived the study and drafted the manuscript. All authors read and approved the final manuscript.
Competing interests
The authors declare that they have no competing interests.
Received: 19 September 2011 Accepted: 13 March 2012 Published: 13 March 2012
References
1. Pieper R, Kager L, Näsman P: Acute appendicitis: a clinical study of 1018 cases of emergency appendectomy. Acta Chir Scand 1982, 148:51-62.
2. Flum DR, Morris A, Koepsell T, et al: Has misdiagnosis of appendicitis decreased over time? JAMA 2001, 286:1748-1753.
3. Sheu BF, Chiu TF, Chen JC, Tung MS, Chang MW, Young YR: Risk factors associated with perforated appendicitis in elderly patients presenting with signs and symptoms of acute appendicitis. ANZ J Surg 2007, 77:662-666.
4. Tzanakis NE, Efstathiou SP, Danulidis K, Rallis GE, Tsioulos DI,
Chatzivasiliou A, Peros G, et al: A new approach to accurate diagnosis of acute appendicitis. World J Surg 2005, 29:1151-1156.
5. Ting HW, Wu JT, Chan CL, Lin SL, Chen MH: Decision model for acute appendicitis treatment with decision tree technology–a modification of the Alvarado scoring system. J Chin Med Assoc 2010, 73:401-406.
6. De Dombal FT, Leaper DJ, Horrocks JC, Staniland JR, McCann AP:
Computer-aided diagnosis of abdominal pain. BMJ 1972, 2:9-13.
7. Adams ID, Chan M, Clifford PC, Cooke WM, Dallos V, De Dombal FT, et al:
Computer aided diagnosis of acute abdominal pain: a multicentre study.
BMJ 1986, 293:800-804.
8. Fathi-Torbaghan M, Meyer D: MEDUSA: a fuzzy expert system for medical diagnosis of acute abdominal pain. Methods Inf Med 1994, 33:522-529.
9. Pesonen E, Ikonen J, Juhola M, Eskelinen : Parameters for a knowledge based for acute appendicitis. Methods Inf Med 1994, 33:220-226.
10. Eberhart RC, Dobbins RW, Hutton LV: Neural network paradigm comparisons for appendicitis diagnoses. Proceedings of the fourth annual IEEE Symposium on Computer-based Medical Systems: 12-14 May 1991;
Baltimore CA: IEEE Computer Society Press; 1991, 298-304.
11. Pesonen E, Eskelinen M, Juhola M: Comparison of different neural network algorithms in the diagnosis of acute appendicitis. Int J Biomed Comput 1996, 40:227-233.
12. Prabhudesai SG, Gould S, Rekhraj S, Tekkis PP, Glazer G: Artificial neural networks: useful aid in diagnosing acute appendicitis. World J Surg 2008, 32:305-309.
13. Alvarado A: A practical score for the early diagnosis of acute appendicitis. Ann Emerg Med 1986, 15:557-564.
14. Gaga L, Moustakis V, Vlachakis Y, Charissis G: ID+: enhancing medical knowledge acquisition with machine learning. Appl Artif Intell 1996, 10:79-94.
15. Ohmann C, Moustakis V, Yang Q, Lang K, Acute Abdominal Pain Study Group: Evaluation of automatic knowledge acquisition techniques in the diagnosis of acute abdominal pain. Artif Intell Med 1996, 8:23-36.
16. Zorman M, Eich HP, Kokol P, Ohmann C: Comparison of three databases with a decision tree approach in the medical field of acute appendicitis.
Stud Health Technol Inform 2001, 84:1414-1418.
17. Lemeshow S, Hosmer DW: A review of goodness of fit statistics for use in the development of logistic regression models. Am J Epidemiol 1982, 115:92-106.
18. Hosmer DW, Hosmer T, Le Cessie S, Lemeshow S: A comparison of goodness-of-fit tests for the logistic regression model. Stat Med 1997, 16:965-980.
19. Chen CA, Lin SH, Hsu YJ, Li YC, Wang YF, Chiu JS: Neural network modelling to stratify peritoneal membrane transporter in predialytic patients. Intern Med 2006, 45:663-664.
20. Lin CS, Chang CC, Chiu JS, Lee YW, Lin JA, Mok MS, et al: Application of an artificial neural network to predict postinduction hypotension during general anesthesia. Med Decis Making 2011, 31:308-314.
21. Quinlan JR: Induction of decision trees. Mach Learn 1986, 1:81-106.
22. Quinlan JR: C4.5: Programs for Machine Learning San Mateo: Morgan Kaufmann Publishers; 1993.
23. Frey LJ, Edgerton ME, Fisher DH, Tang L, Chen Z: Using priori knowledge and rule induction methods to discover molecular markers of prognosis in lung cancer. AMIA Annual Symposium Proceedings Washington DC 2005 2005, 256-260.
24. Hanley JA, McNeil BJ: The meaning and use of the area under a receiver operating characteristic (ROC) curve. Radiology 1982, 143:29-36.
25. Hanley JA, McNeil BJ: A method of comparing the area under receiver operating characteristic curves derived from the same cases. Radiology 1983, 148:839-843.
26. Kalan M, Rich AJ, Talbot D, Cunliffe WJ: Evaluation of the modified Alvarado score in the diagnosis of acute appendicitis: a prospective study. Ann R Coll Surg Engl 1994, 76:418-419.
27. Tang HR, Want YC, Chung PK, et al: Role of leukocyte count, neutrophil percentage, and C-reactive protein in the diagnosis of acute appendicitis in the elderly. Am Surg 2005, 71:344-347.
28. Rothrock SG, Pagane J: Acute appendicitis in children: Emergency department diagnosis and management. Ann Emerg Med 2000, 36:39-51.
29. Kwan KY, Nager AL: Diagnosing pediatric appendicitis: usefulness of laboratory markers. Am J Emerg Med 2010, 28:1009-1015.
30. Clark PJ: Utility of eosinophilia as a diagnostic clue in lower abdominal pain in northern Australia: a retrospective case–control study. Intern Med J 2008, 38:278-280.
31. Santosh G, Aravindan KP: Evidence for eosinophil degranulation in acute appendicitis. Indian J Pathol Microbiol 2008, 51:172-174.
32. Um JW, Kim KH, Kang MS, Choe JH, Bae JW, Hong YS, et al:
Macroamylasemia in a patient with acute appendicitis: a case report. J Korean Med Sci 1999, 14:679-681.
33. García S, Fernández A, Herrera F: Enhancing the effectiveness and interpretability of decision tree and rule induction classifiers with evolutionary training set selection over imbalanced problems. Appl Soft Comput 2009, 9:1304-1314.
34. Dash M, Liu H: Feature selection for classification. Intell Data Anal 1997, 1:131-156.
35. Jensen R, Shen Q: Fuzzy-rough sets assisted attribute selection. IEEE T Fuzzy Syst 2007, 15:73-89.
Pre-publication history
The pre-publication history for this paper can be accessed here:
http://www.biomedcentral.com/1472-6947/12/17/prepub doi:10.1186/1472-6947-12-17
Cite this article as: Son et al.: A hybrid decision support model to discover informative knowledge in diagnosing acute appendicitis. BMC Medical Informatics and Decision Making 2012 12:17.
Submit your next manuscript to BioMed Central and take full advantage of:
• Convenient online submission
• Thorough peer review
• No space constraints or color figure charges
• Immediate publication on acceptance
• Inclusion in PubMed, CAS, Scopus and Google Scholar
• Research which is freely available for redistribution
Submit your manuscript at www.biomedcentral.com/submit