Evaporative Stress Index (ESI)의 국내 가뭄 심도 분류 기준 제시
Percentile Approach of Drought Severity Classification in Evaporative Stress Index for South Korea
이희진a⋅남원호b,†⋅윤동현c⋅홍은미d⋅김태곤e⋅박종환f⋅김대의g
Lee, Hee-Jin⋅Nam, Won-Ho⋅Yoon, Dong-Hyun⋅Hong, Eun-Mi⋅Kim, Taegon⋅Park, Jong-Hwan⋅Kim, Dae-Eui
ABSTRACT
Drought is considered as a devastating hazard that causes serious agricultural, ecological and socio-economic impacts worldwide. Fundamentally, the drought can be defined as temporarily different levels of inadequate precipitation, soil moisture, and water supply relative to the long-term average conditions. From no unified definition of droughts, droughts have been divided into different severity level, i.e., moderate drought, severe drought, extreme drought and exceptional drought. The drought severity classification defined the ranges for each indicator for each dryness level. Because the ranges of the various indicators often don’t coincide, the final drought category tends to be based on what the majority of the indicators show and on local observations. Evaporative Stress Index (ESI), a satellite-based drought index using the ratio of potential and actual evaporation, is being used as a index of the droughts occurring rapidly in a short period of time from studies showing a more sensitive and fast response to drought compared to Standardized Precipitation Index (SPI), and Palmer Drought Severity Index (PDSI). However, ESI is difficult to provide an objective drought assessment because it does not have clear drought severity classification criteria. In this study, U.S. Drought Monitor (USDM), the standard for drought determination used in the United States, was applied to ESI, and the Percentile method was used to classify drought categories by severity.
Regarding the actual 2017 drought event in South Korea, we compare the spatial distribution of drought area and understand the USDM-based ESI by comparing the results of Standardized Groundwater level Index (SGI) and drought impact information. These results demonstrated that the USDM-based ESI could be an effective tool to provide objective drought conditions to inform management decisions for drought policy.
Keywords: Satellite-based drought index; Evaporative Stress Index (ESI); drought severity; drought severity classification; percentile approach; Standardized Groundwater level Index (SGI)
Ⅰ. 서 론
최근 기후변화로 인한 가뭄의 피해는 지역으로 국한되지 않고 전 세계적으로 식량 및 경제적 문제를 야기할 수 있을 정도로 영향은 광범위하며 (Sternberg, 2011), 가뭄의 발생빈 도가 잦아지고 사회적, 경제적, 환경적 피해 규모가 커지는 추세이다 (Wilhite et al., 2000; Sohn et al., 2014). 기후변화
와 관련하여 자연재해에 대한 적응의 중요성이 강조되고 있으며, 국립해양기상청 (National Oceanic and Atmospheric Administration, NOAA)이 발표하는 재해유형별 경제손실액 보고서 (Smith and Katz, 2013)에 의하면 가뭄에 의한 경제적 손실은 홍수에 비해 2배 이상이며, 1980년 이후 가뭄의 발생 빈도는 전체 재해빈도 중 14%에 해당하지만, 피해액은 전체 재해피해액의 25%를 차지하고 있다 (Nam et al., 2014). 국내 에 발생하는 자연재해 중 2000년대 들어서 가뭄이 전국 또는 지역적으로 매년 발생하고 있으며, 이러한 가뭄을 판단할 때 에는 가뭄의 시간적 발생과 공간적 분포를 파악해야 한다 (Nam et al., 2012). 특히 가뭄을 정량화하고 대상 가뭄 지역의 특성을 파악하여 반영하는 것이 중요하며 (Wilhite and Glantz, 1985; Hong et al., 2015; Nam et al., 2015b), 이에 따라 전 세계 적으로 다양한 가뭄지수가 개발되어 가뭄의 심도 (serverity)
aGraduate Student, Department of Bioresources and Rural Systems Engineering, Hankyong National University, Anseong, Republic of Korea
b Assistant Professor, Department of Bioresources and Rural Systems Engineering, Institute of Agricultural Environmental Science, National Agricultural Water Research Center, Hankyong National University, Anseong, Republic of Korea
cGraduate Student, Department of Bioresources and Rural Systems Engineering, Hankyong National University, Anseong, Republic of Korea
d Assistant Professor, School of Natural Resources and Environmental Science, Kangwon National University, Chuncheon, Republic of Korea
eResearch Associate, Department of Bioproducts and Biosystems Engineering, University of Minnesota, St. Paul, MN, USA
fResearcher, Rural Research Institute, Korea Rural Community Corporation, Ansan, Republic of Korea
g Senior Researcher, Rural Research Institute, Korea Rural Community Corporation, Ansan, Republic of Korea
† Corresponding author
Tel.: +82-31-670-5137, Fax: +82-31-670-5139 E-mail: [email protected]
Received: 02 January, 2020 Revised: 17 March, 2020 Accepted: 17 March, 2020
를 정량화하여 분석하는 연구가 진행되어 왔다 (Du Pisani et al., 1998; Heim, 2002; Keyantash and Dracup, 2002; Hayes et al., 2004; Nam et al., 2015a).
일반적으로 가뭄을 해석하기 위하여 가뭄 심도, 빈도, 피해 면적과 기간의 영향을 고려한 가뭄지수를 이용하며, 대표적 인 가뭄지수로는 표준강수지수 (Standardized Precipitation Index, SPI), 파머가뭄심도지수 (Palmer Drought Severity Index, PDSI), 표준강수증발산지수 (Standardized Precipitation Evapotranspiration Index, SPEI), 강수평년비 (Percent of Normal Precipitation, PN), 토양수분지수 (Soil Moisture Index, SMI) 등이 있다. 현재 전 세계적으로 다양한 가뭄지수들이 개발되면서 가뭄 분류 기준의 등급도 다양하게 적용되고 있 다. SPI (Mckee et al., 1993)는 3단계의 가뭄 분류 기준으로 가뭄상황을 분석하며, PDSI (Palmer, 1965)의 경우 4단계로 가뭄 등급을 분류하여 가뭄을 판단한다. Steinemann (2003)은 가뭄지수별 다양한 분류를 동일한 등급으로 산정하기 위한 빈도의 통합을 제시한 바 있으며, 이는 특정구간에서 발생하 는 빈도가 동일하게 발생하도록 한계를 조정하여 가뭄 등급 의 구간을 설정하는 방식이다.
Anderson et al. (2007)은 위성영상을 기반으로 증발산량을 활용한 가뭄지수인 Evaporative Stress Index (ESI)를 개발하였 고, 기존의 가뭄지수인 SPI, PDSI 등과 비교하여 농업가뭄 분 석에 대한 적용성을 평가하였다. 또한, 단기간 급속하게 발생 하는 Flash Drought에 대하여 원격으로 감지된 열적외선 (Thermal InfraRed, TIR) 영상을 통하여 관측되는 지표면 온도 (Land-Surface Temperature, LST)로 초기 가뭄 스트레스가 전 달될 수 있기 때문에 이를 이용한 ESI가 일반적인 기상학적 가뭄지수보다 가뭄 조기경보에 대한 활용성이 높다 (Otkin et al., 2013; 2014). Yoon et al. (2018)은 위성영상 기반 가뭄지수 인 NDVI (Normalized Difference Vegetation Index), EVI (Enhanced Vegetation Index), LAI (Leaf Area Index), VHI (Vegetation Health Index) 등과 ESI를 비교하였으며, ESI가 가 뭄 발생 시기에 대해 빠르고 민감하게 나타나고 특히 VHI의 경우 ESI에 비해 가뭄 시작 시기가 약 40일 늦은 반응을 보인 다는 결과를 도출하였다. Lee et al. (2019)는 정보 수집이 제한 적인 북한 지역에 대하여 위성영상을 활용한 가뭄 평가 방법 을 제시하였으며, 기상학적 가뭄지수와 비교를 통한 ESI의 가 뭄 판단에 대하여 검증하였다. ESI는 잠재증발산과 실제증발 산 비율의 아노말리 (Anomaly)로 표현하며 가뭄의 경향을 파 악하기에 적합한 가뭄지수이지만, 명확한 가뭄 분류 기준의 부재로 인해 객관성 있는 가뭄 평가와 대응 마련을 위한 가뭄 단계 구분에 대하여 검토할 필요가 있다.
본 연구에서는 선행 연구에서 검증된 ESI 데이터를 활용하
여 미국에서 사용되고 있는 가뭄 판단 기준을 적용하였으 며, 국내에 활용할 수 있는 가뭄 심도 분류 기준을 제시하였 다. 실제 가뭄사상인 2017년 국내 지역을 대상으로 아노말 리로 표현되는 기존 ESI, 가뭄 발생 지역, 표준지하수지수 (Standardized Groundwater level Index, SGI) 공간분포와 비교 하여 제시한 가뭄 단계에 대하여 적용성을 평가하고자 한다.
Ⅱ. 연구 방법 1. 연구 대상 지역
연구 대상 지역은 강수특성이 내륙에 비해 현저하게 다른 특성이 나타나는 울릉도, 제주도 등 도서지역을 제외한 국내 지역으로 8개 도와 165개의 시군구를 대상으로 선정하였다.
위성영상 기반의 가뭄지수인 ESI 영상자료는 USAID (United States Agency for International Development)와 NASA (National Aeronautics and Space Administration)의 공동개발계 획인 SERVIR (https://www.servirglobal.net)에서 주 단위로 공 간해상도 약 5 km (0.05 degree)의 4주, 12주 합성데이터를 전 세계 범위로 제공하고 있으며, 본 연구에서는 주 단위의 ESI 4주 합성데이터를 활용하였다.
2. Evaporative Stress Index (ESI)
ESI는 다양한 수문기상인자들 (대기온도, 대기압, 태양복 사량, 식생지수 등)의 기작으로 발생하는 실제증발산량과 잠 재증발산량을 이용하여 표준화된 아노말리를 지수화한 지표 이며 (Anderson et al., 2015), 지표면과 대기 사이에서의 수분 공급을 표현함으로써 가뭄 현상을 분석하는 지표로 개발되었 다 (Sur et al., 2014). LST와 LAI (Leaf Area Index)의 원격 감지 입력을 사용하여 에너지 균형을 통해 아노말리로 나타 낸다(Anderson et al., 2007; 2011; 2016). 또한, 가뭄 모니터링 및 토양수분 기반 가뭄지수 산정에 있어 적합하다 (Anderson et al., 2013). ESI 산정식은 식 (1)과 같다.
(1)
∆
∆
(2)
여기서, PET (Potential Evapotranspiration)는 국제연합식량 농업기구 (Food and Agriculture Organization of the United Nations, FAO)에서 제공하는 FAO-56 Penman Monteith
(FAO56 PM)을 기반으로 한 잠재증발산량 (mm day-1)이며, Allen et al. (1998)에 의해 기술된 바와 같이 식 (2)를 활용하여 산정한다. 은 순복사량 (net radiation, MJ m-2 day-1), 는 토양 열 유속 밀도 (soil heat flux density, MJ m-2 day-1),
은 2 m 높이에서의 일평균기온 (℃), 는 2 m 높이에서의 풍속 (m s-1), 는 포화증기압에서 실제증기압 (kPa)을 감한 포화 결손량, ∆은 증기압 곡선의 기울기(kPa ℃-1), 그리 고 은 건습계상수 (psychrometric coefficient, kPa ℃-1)이다.
FAO56 PM 방법으로 산정된 잠재증발산량은 전 세계적으로 작물생산에 필요한 실제 물의 양과 일관성 있는 결과를 나타 낸다 (Kim et al., 2017).
는 실제증발산량을 의미하며, TIR 영상을 통해 취
득한 LST 값을 활용한다. LST 값을 도출하여 초기 가뭄에 대해 보다 높은 신뢰도를 얻을 수 있으며, Atmosphere-Land Exchange Inverse (ALEXI; Anderson et al. 2007) 표면 에너지 균형 모델은 이 관계를 이용하여 원격으로 LST를 감지하여 증발산량을 추정한다 (Otkin et al., 2014). ALEXI는 the Two-Source Energy Balance model (TSEB; Norman et al., 1995)을 기반으로 하며, 지표면은 온도, 플럭스 및 대기 결합 이 다른 토양과 식물 요소의 합성을 활용한다. ALEXI는 순복 사 (, W m-2), 현열 (, W m-2), 잠열 (, W m-2), 토양 열전도 (, W m-2) 플럭스로 구성되어있으며, 식 (3)과 같다.
(3)
ESI는 실제증발산과 잠재증발산의 비를 평균 및 표준편 차를 활용한 z-score 방법으로 표준화하여 0 이하의 ESI 값 은 가뭄, 0 보다 큰 ESI 값은 비가뭄으로 표현하고 있다. 가 뭄 발생 지역에 대하여 확인 가능하고 시계열 분석을 통한 가뭄의 경향성은 파악할 수 있지만, 국내에 적합한 가뭄 단 계 및 가뭄 심도별 분류 기준의 부재로 발생한 가뭄의 위험 성 분석 및 지역별 가뭄 심도에 따른 대응 마련 등에는 어려 움이 있다.
3. Percentile 가뭄 단계 구분
U. S. Drought Monitor (USDM; Svoboda et al., 2002)은 1999년 가뭄 모니터링이 시작된 이후로 미국 네브라스카 대 학교 (University of Nebraska-Lincoln)의 국립가뭄경감센터 (National Drought Mitigation Center, NDMC), 미국 해양대기 청 (National Oceanic and Atmospheric Administration, NOAA), 미국 농무부 (U. S. Department of Agriculture, USDA)가 공동 으로 개발하였으며, 가뭄의 심각성을 파악하고 취약성이나
위험성을 이해하기 위한 목적으로 활용하였다. Abnormally dry (D0), Moderate drought (D1), Severe drought (D2), Extreme drought (D3), Exceptional drought (D4)을 포함한 복수의 가뭄 범주를 활용하여 가뭄에 대해 판단한다. 미국 전역에서 가뭄 의 규모 및 공간적 범위에 대한 영향을 파악하고 표현하는 것을 목표료 하며, 가뭄 발생에 대하여 백분위수 (Percentile) 를 활용하여 가뭄 심도의 임계값을 표현하였다.
Percentile은 지역 전문가의 주관적인 평가에 기반하여 조 정이 가능하도록 고안되었으며, 객관적인 데이터와 결합하여 가뭄 분석에 사용되는 모든 매개 변수에 적용이 가능하다.
USDM에서는 Percentile 활용 방법의 예시로 강수량을 기준으 로 하는 방법을 제시하였으며, 100년치의 연별 강수량 데이터 를 나열하여 가장 강수량이 적은 2개년도 (하위 2%)를 D4, 그 다음으로 적은 연강수량을 가진 3개년도 (하위 5%)를 D3 순으로 산정하여 Table 1과 같이 30% 이하의 범주를 가뭄으 로 판단하였다. 미국 전역의 모든 강수량 관측점에서 Percentile을 활용한 가뭄 심도의 분류는 여러 변수에 대하여 단기 및 장기 가뭄을 단순화된 지수로 표현 가능한 복합 지표 이다 (Xia et al., 2014). SPI, PDSI 등에 대해서도 USDM 지표 를 기준으로 가뭄 심도를 분석하여 가뭄 단계에 대한 공간분 포를 지도로 제작하여 제공하고 있다. Nam et al. (2017)은 북 한 지역의 극한 가뭄 평가를 위하여 주 단위 SPEI를 산정하였 으며, USDM 기준을 적용하여 가뭄 판단에 활용하였다. 또한, Mun et al. (2019)은 강우 위성영상 CHIRPS (Climate Hazards Group InfraRed Precipitation with Station)를 통하여 한반도 지 역의 강수량 데이터를 추출하였으며, USDM 기준에 맞추어 SPI를 산정하여 가뭄을 평가하였다.
Category Drought Description Percentile Ranges (%)
D0 Abnormally Dry 21 to 30
D1 Moderate Drought 11 to 20
D2 Severe Drought 6 to 10
D3 Extreme Drought 3 to 5
D4 Exceptional Drought below to 2 Table 1 Classification of drought in USDM (Svoboda et al., 2002)
Ⅲ. 적용 및 결과
1. ESI를 이용한 가뭄 심도 분류
단순 표준화된 아노말리로 가뭄, 비가뭄의 정도만을 표현 했던 ESI에 대하여 USDM의 Percentile 방법을 적용한 가뭄 심도별 가뭄 단계를 구분하기 위하여 활용 가능한 ESI 데이터
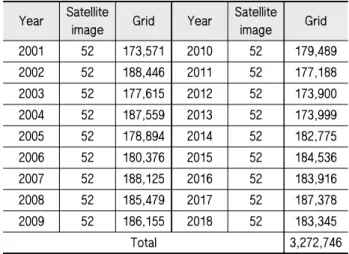
2001년부터 2018년까지 총 18년 데이터를 취득하였다. 대상 지역인 국내 전역에 대한 모든 격자 값을 추출하였으며, 국내 를 기준으로 1개의 영상에 추출 가능한 최대 격자 개수는 3,663개, 연간 영상의 개수는 52개, 활용 가능한 년의 개수는 18년으로 약 340만 개의 격자를 추출할 수 있다. 하지만, 겨울 철 적설과 구름 등의 기상 조건으로 인하여 실제 활용 가능한 격자의 개수는 약 327만 개이며, 연별 격자 개수는 Table 2와 같다.
Year Satellite
image Grid Year Satellite image Grid
2001 52 173,571 2010 52 179,489
2002 52 188,446 2011 52 177,188
2003 52 177,615 2012 52 173,900
2004 52 187,559 2013 52 173,999
2005 52 178,894 2014 52 182,775
2006 52 180,376 2015 52 184,536
2007 52 188,125 2016 52 183,916
2008 52 185,479 2017 52 187,378
2009 52 186,155 2018 52 183,345
Total 3,272,746
Table 2 Data input variables of ESI data sets
USDM 기준 Percentile에 맞추어 ESI를 산정하기 위하여 Fig. 1과 같이 18년 데이터의 ESI 격자 정규분포 및 누적분포 를 그래프로 표현하였으며, 누적분포 그래프를 활용하여 USDM에서 활용하는 Percentile의 ESI 값을 산정하였다. ESI
값 –0.563 (30%)을 초과하는 값은 비가뭄으로 설정하였으며, 이하의 값들은 가뭄으로 판단하여 USDM 기준과 동일하게 Table 3와 같이 5단계의 가뭄 단계로 표현하였다.
Category Description Percentile ESI Value D0 Abnormally Dry 21 to 30% -0.563 to –0.879 D1 Moderate Drought 11 to 20% -0.880 to –1.316 D2 Severe Drought 6 to 10% -1.317 to –1.683 D3 Extreme Drought 3 to 5% -1.684 to –2.107 D4 Exceptional Drought 0 to 2% -2.108 or less Table 3 Classification of drought for ESI using USDM percentiles
approach
2. ESI를 활용한 2017년 국내 가뭄 분석
USDM 기준을 적용한 ESI의 가뭄 심도별 가뭄 단계에 따 른 국내 지역의 가뭄 판단에 대한 적용성을 확인하기 위하여, 최근 극심한 가뭄사상을 나타냈던 2017년을 기준으로 분석하 였다. 2017년 이상기후보고서 (KMA, 2018)에 의하면, 전국 연강수량은 평년 대비 74%로 평년 1,308 mm보다 적은 968 mm이며, 특히 5월과 6월의 전국 평균 강수량이 29.5 mm와 60.7 mm로 평년 대비 각각 29%, 38%로 1973년 이후 최소 3위 안에 드는 극심한 강수 부족을 겪었다. 가뭄은 경기, 충청, 전남 지역을 중심으로 시작하여 5월과 6월에는 경상까지 가 뭄상황이 확대되었다. 6월 24일부터 7월 29일까지 장마가 있 었지만 잦은 국지성 집중호우로 지역간 강수량 편차가 컸다.
특히 중부지방의 경우 254.9 mm로 평년 17.8 mm에 비해 매우
Fig. 1 Frequency and cumulative distribution of 2001-2018 ESI all grids
컸으며, 남부지방의 경우 8월 말 강수량은 평년 대비 53%로 가뭄이 지속되었다.
Fig. 2는 2017년 ESI 값의 격자 분포를 전체기간 (1월에서 12월)과 관개기 (4월에서 9월)로 나누어 표현한 그래프이며, 전반적으로 0 이하의 ESI 값이 분포가 크게 나타났다. 실제 가뭄 발생 시기인 4월부터 8월까지가 관개기에 해당하며, 동 일 시기에 대한 ESI 값의 격자 분포는 전체기간보다 낮은 분 포를 보였다. 본 연구에서는 낮은 ESI 값 격자 분포를 보이는 관개기를 중심으로 기상청 보도자료 및 2017년 이상기후보고 서 등을 활용하여 4월부터 8월까지의 실제 가뭄 기록을 Table 4와 같이 표현하였다.
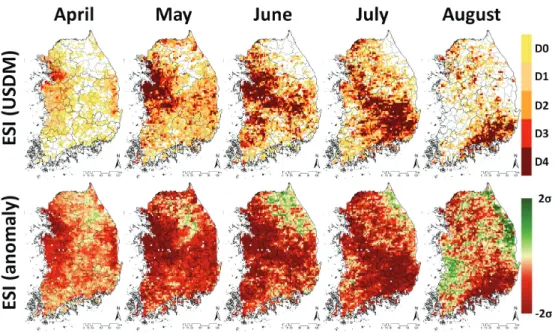
3. ESI를 활용한 2017년 국내 가뭄발생 공간분포 비교 Fig. 3은 본 연구에서 제시한 USDM 기준에 따른 ESI와 아노말리로 표현한 ESI의 월별 공간분포 지도이다. USDM 을 활용하여 제시한 ESI의 경우 5개의 가뭄 단계에 맞추어 표현되었으며, 명확한 색의 구분으로 가뭄 단계가 다르기 때문에 지역별 가뭄 판단이 가능하다. 반면, 아노말리로 표 현되는 기존의 ESI는 가뭄이 가장 극심한 지역에 대하여 중
부지방에서 남부지방으로 변화하는 가뭄의 변화 및 경향성 을 파악할 수 있으나, 색이 연속적으로 표현되어 단계별로 구분하기가 어렵기 때문에 사용자에 따라 주관적으로 해석 할 여지가 있다.
Table 4를 활용하여 가뭄 발생 지역을 공간분포 지도로 표현하여 비교한 Fig. 4는 실제 기록을 바탕으로 가뭄 피해를 입은 경기도/충청도/전라도/경상도 지역 위주의 시도 단위로 구분하여 표현하였다. 4월 중부지방을 중심으로 가뭄이 발 생, 5, 6월에는 강원도 지역을 제외한 전국 대부분의 지역에 서 가뭄 발생이 나타났다. 6월 이후 남부지방에 가뭄의 지속 및 심화됐으며, 중부지방의 경우 장마로 인하여 심화된 가뭄 이 점차 해갈되었다. 이후 7, 8월에는 남부지방에 대한 가뭄 이 두드러졌으며, 이와 같은 가뭄 양상을 해갈-발생-지속-심 화 단계의 가뭄 발생 지역 지도로 만들어 USDM 기준 ESI와 공간분포 비교를 하였다. 전반적인 공간분포 양상은 유사하 였으며, 7, 8월 중부지방에서 남부지방으로 가뭄 발생이 변화 하는 모습을 나타냈다. 하지만 ESI는 전남 지역보다 경남 지 역의 가뭄을 주로 표현하였으며, 기상청 보도자료와 차이를 보였다.
Fig. 2 Grids distribution based on ESI values in 2017 (entire period and irrigation period)
Drought period Date Drought areas
Drought start From late April to early May Start in Gyeonggi, Chungcheong and Jeolla provinces
Continuing and deepening drought
May Expansion of drought
June Nationwide drought
July Substantial of precipitation in central area
Continuation of drought by low precipitation in southern area Drought relief August Drought relief by precipitation in central area
Continuation of drought in southern area Table 4 Temporal and spatial changes in actual drought records in South Korea during the 2017 drought event
2017년 4월부터 8월까지 주 단위 ESI의 가뭄 단계별 누적 비율 그래프를 Fig. 5와 같이 표현하였다. 가뭄 시작 시기인 4월 말부터 가뭄 누적 비율이 급격히 높아져 약 80% 까지 상승하였다. 이후 전체적인 가뭄 누적 비율은 8월 전까지 60%
이상이며, 가뭄이 심화되는 5, 6월은 극심한 가뭄을 표현하는 D3, D4 단계의 가뭄 누적 비율이 높아졌다. 중부지방 장마로 인하여 7월 이후 가뭄 누적 비율이 다소 감소하지만, 남부지
방의 가뭄 지속 및 심화로 가뭄 누적 비율이 유지되었으며, 특히 D4 단계의 비율은 5월부터 7월까지 약 20%에 가까운 누적 비율을 보였다.
4. 가뭄지수별 공간분포 비교
국가가뭄정보분석센터 (http://www.drought.go.kr/main.do) 에서는 지하수 정보를 기반으로 한 미급수지역의 지하수위 Fig. 3 Comparison of monthly spatial distribution of USDM-based ESI and original ESI drought severity
classification (from April to August in 2017)
Fig. 4 Comparison of monthly spatial distribution of USDM-based ESI drought severity classification and actual drought damage area (from April to August in 2017)
현황을 이용한 가뭄 모니터링을 위하여 256개의 국가 지하수 관측망 관측 자료를 이용하여 관측소별, 월별 수위분포를 핵 밀도함수로 추정하였으며, 추정된 누적분포함수를 이용하여 월별 지하수위 분위수를 구한 후 정규화하여 표준지하수지수 (Standardized Groundwater level Index, SGI) (Bloomfield and Marchant, 2013)를 산정하였다 (Lee et al., 2018). SGI는 지하 수위의 변동을 평년 대비 비교 정도를 나타내는 표준화지수 이며, 과거 월 평균 지하수 수위를 이용하여 월별 확률분포를 산정하고 해당 월의 지하수위에 해당하는 발생확률을 표준정 규분포에 대한 분위수 함수를 이용하여 표준지수로 환산한다.
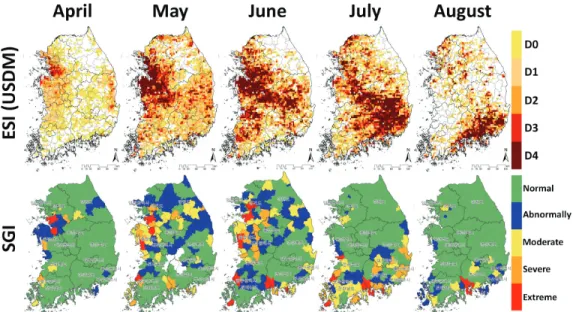
본 연구에서는 USDM 기준으로 산정한 ESI 가뭄 단계의 적용성 판단을 위하여 Fig. 6과 같이 SGI와 월별 공간분포 양상을 비교하였다. ESI는 격자 단위의 지도로 표현되며, SGI
는 시군 단위로 정상-관심-주의-경계-심각의 단계로 표현된 다. ESI와 SGI는 4월 경기, 충청 지역을 중심으로 가뭄이 발생 하였으며, 6월까지 가뭄 발생 및 심도에 대하여 유사한 경향 을 보였다. 7월 SGI는 전남, 경남 지역 위주로 가뭄이 지속되 었으며, ESI는 경남 지역에 더 심각한 가뭄 단계를 나타냈다.
8월에는 두 가뭄지수 모두 경남 지역에 대하여 가장 높은 가 뭄 단계를 보였으며, ESI와 SGI는 4월부터 8월까지의 공간분 포 양상이 전반적으로 유사한 것으로 판단된다. 가뭄은 대부 분 강수량의 부족을 기준으로 기록되기 때문에 강수량과 상 관성이 높은 SGI의 7, 8월 남부지방 공간분포가 실제 가뭄 기록과 더 유사한 것으로 사료된다.
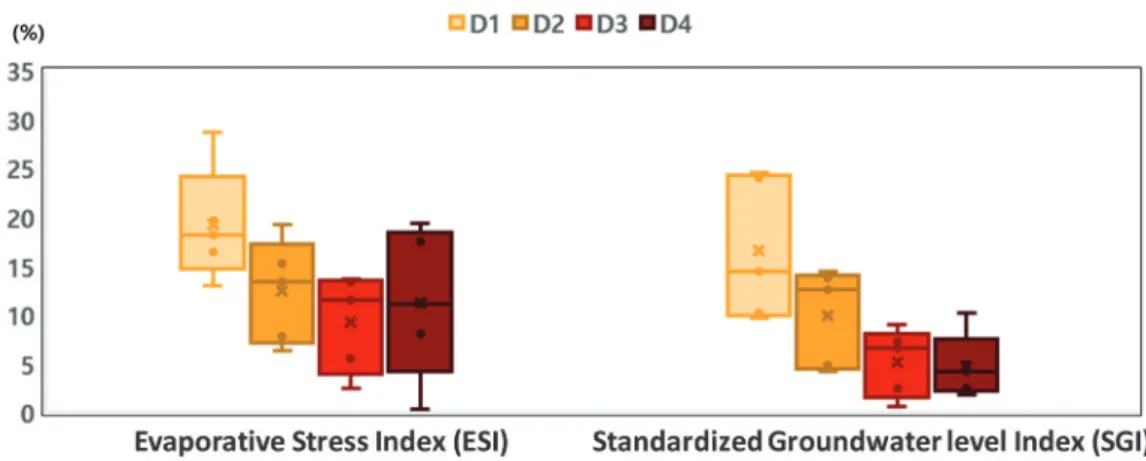
Fig. 7은 ESI와 SGI의 가뭄 단계별 비율을 나타내었으며, ESI는 D1부터 D4, SGI는 관심-주의-경계-심각 4단계를 비교 Fig. 5 Cumulative drought ratio (percentage) by USDM-based drought severity classification (from April to August
in 2017)
Fig. 6 Monthly spatial distribution comparison of USDM-based ESI and SGI drought severity classification (from April to August in 2017)
하였다. 두 가뭄지수 모두 각 단계별 중앙값이 D1, D2, D3 순서대로 비율이 높았으며, ESI의 경우 중앙값과 최대값의 D4 단계 가뭄 비율이 SGI에 비해 높게 나타났다. ESI는 지속 또는 심화되는 가뭄에 대하여 D3, D4 단계 위주로 표현을 하 며, SGI와 비교하여 가뭄 분석에 민감한 것으로 판단된다. 또 한, Fig. 8은 ESI와 SGI의 가뭄 단계별 비율에 대하여 상관관 계를 살펴보기 위한 상관 분석을 산포도로 나타낸 것이며, 상 관관계는 0.01 수준에서 유의하고 상관계수의 값이 0.798로 강한 양의 상관관계를 보였다.
Ⅳ. 결 론
본 연구에서는 위성영상 기반 가뭄지수인 ESI의 국내 가뭄
판단에 대한 적용성을 위하여 기존의 아노말리를 통한 가뭄 경향성 파악이 아닌 격자별 가뭄 심도에 대한 국내 적용가능 한 가뭄 단계를 명확하게 제시하고자 하였다. 미국 국립가뭄 경감센터 (NDMC)에서 활용하고 있는 USDM의 Percentile 방 법을 적용하여 ESI의 가뭄 심도별 단계를 5단계로 구분하였 고, USDM 기준 ESI를 2017년 실제 가뭄사상을 기준으로 기 존 ESI, 가뭄발생면적, 표준지하수지수 (SGI)와 비교 및 분석 을 하였다.
USDM 기준 ESI는 아노말리로 표현하는 기존의 ESI와 동 일하게 가뭄의 경향성을 파악할 수 있었다. 하지만 기존 ESI 의 경우 가뭄 표현의 명확한 분류가 없기 때문에 가뭄의 심도 에 대한 주관적인 판단으로 인하여 객관성이 낮았다. 본 연구 에서 산정한 USDM 기준 ESI는 가뭄 심도의 구분을 통한 격 자별 가뭄 분석 및 판단이 가능하여 소규모 지역의 가뭄 대응 에 활용할 수 있을 것으로 사료된다. 2017년 실제 가뭄 기록을 바탕으로 공간분포 양상을 비교하였으며, 4월부터 8월까지 가뭄의 분포 및 변화에 대하여 유사한 경향을 보였다. 지하수 위를 활용한 가뭄지수인 SGI와 비교를 통하여 가뭄 발생 지역 에 대하여 유사한 가뭄 상황 표현이 나타났으며, 해당 기간의 가뭄 단계별 비율을 통하여 USDM 기준 ESI는 지속 및 심화 되는 가뭄에 대하여 D3 (Extreme drought), D4 (Exceptional drought) 가뭄 단계의 표현 빈도가 높았다. 특히, D4 단계의 가뭄 비율이 높기 때문에 2017년 국내 가뭄 상황이 국가적 재난 상황 단계로 유추할 수 있고 실제 보도자료를 통하여 2017년 가뭄사상은 국내 발생 가뭄 중에서도 극심한 가뭄사 상으로 확인되었다. SGI와 비교하여 가뭄 분석 및 판단에 다 소 민감하다고 판단되며, 상관분석을 통하여 상관계수 0.798 로 두 가뭄지수 간의 강한 양의 상관관계가 있음을 확인하였 다. 이는 제시한 USDM 기준 ESI 가뭄 단계가 기존에 국내에 Fig. 8 Correlation analysis for drought categories ratio as
determined by ESI and SGI drought severity classification
Fig. 7 Drought categories ratio (percentage) as determined by ESI and SGI drought severity classification (from April to August in 2017)
서 활용하는 가뭄 단계와 같이 적용 가능하며, 향후 장기적인 가뭄사상 분석에 대하여 활용가능성이 높다고 사료된다.
본 연구 결과를 통하여 USDM 기준 ESI는 실제 가뭄사상 에 대하여 가뭄 시작, 지속, 심화, 해갈 등과 극심한 가뭄 현상 에 대하여 반영되었으며, 기존의 ESI 표현 방법보다 객관적으 로 가뭄 분석에 활용할 수 있다. 하지만 USDM 기준으로 이루 어진 Percentile 방법이 국내 가뭄 표현에 대한 왜곡 또는 등급 구분에 따른 작위적 위험성에 대하여 지속적인 연구가 필요 할 것으로 판단된다. 향후 다양한 가뭄지수의 활용을 통한 검 증과 우리나라의 지역적 특성 및 가뭄 관련 데이터 등을 고려 한 Percentile을 새롭게 제시하여, USDM과 같이 여러 가지 가뭄 지표를 통합하는 가뭄 정보 시스템에 활용할 수 있을 것으로 판단된다.
감사의 글
본 결과물은 농림축산식품부의 재원으로 농림식품기술기 획평가원의 농업기반및재해대응기술개발사업의 지원을 받아 연구되었음(320003011HD020).
REFERENCES
1. Allen, R. G., L. S. Pereira, D. Raes, and M. Smith, 1998.
Crop evapotranspiration: Guidelines for computing crop water requirements. FAO Irrigation and Drainage Paper 56, Food and Agriculture Organization, Rome.
2. Anderson, M. C., J. M. Norman, J. R. Mecikalski, J. A.
Otkin, and W. P. Kustas, 2007. A climatological study of evapotranspiration and moisture stress across the continental U.S. based on thermal remote sensing: I. model formulation.
Journal of Geophysical Research 112: D10117. doi:10.1029/
2006JD007506.
3. Anderson, M. C., C. R. Hain, B. Wardlow, A. Pimstein, J.
R. Mecikalski, and W. P. Kustas, 2011. Evaluation of drought indices based on thermal remote sensing of evapotranspiration over the continental United States.
Journal of Climate 24: 2025-2044. doi:10.1175/2010JCLI38 12.1.
4. Anderson, M. C., C. Hain, J. Otkin, X. Zhan, K. Mo, M.
Svoboda, B. Wardlow, and A. Pimstein, 2013. An intercomparison of drought indicators based on thermal remote sensing and NLDAS-2 simulations with U.S. drought monitor classifications. Journal of Hydrometeorology 14:
1035-1056. doi:110.1175/JHM-D-12-0140.1.
5. Anderson, M. C., C. A. Zolin, C. R. Hain, K. Semmens, M. T. Yilmaz, and F. Gao, 2015. Comparison of satellite- derived LAI and precipitation anomalies over Brazil with a thermal infrared-based evaporative stress index for 2003- 2013. Journal of Hydrology 526: 287-302. doi:10.1016/j.jhy drol.2015.01.005.
6. Anderson, M. C., C. A. Zolin, P. C. Sentelhas, C. R. Hain, K. Semmens, M. T. Yilmaz, F. Gao, J. A. Otkin, and R.
Tetrault, 2016. The evaporative stress index as an indicator of agricultural drought in Brazil: An assessment based on crop yield impacts. Remote Sensing of Environment 174(1):
82-99. doi:10.1016/j.rse.2015.11.034.
7. Bloomfield, J. P., and B. P. Marchant, 2013. Analysis of groundwater drought using a variant of the standarised precipitation index. Hydrology and Earth System Sciences Discussions 10(6): 7537-7574. doi:10.5194/hessd-10-7537- 2013.
8. Du Pisani, L. G., H. J. Fouché, and J. C. Venter, 1998.
Assessing rangeland drought in South Africa. Agricultural Systems 57(3): 367-380. doi:10.1016/S0308-521X(98)0002 4-9.
9. Hayes, M. J., O. V. Wilhelmi, and C. L. Knutson, 2004.
Reducing drought risk: Bridging theory and practice. Natural Hazards Review 5(2): 106-113. doi:10.1061/(ASCE)1527-69 88(2004)5:2(106).
10. Heim, R. R., 2002. A review of twentieth-century drought indices used in the United States. Bulletin of the American Meteorological Society 83(8): 1149-1165. doi:10.1175/1520- 0477-83.8.1149.
11. Hong, E. M., W. H. Nam, and J. Y. Choi, 2015. Climate change impacts on agricultural drought for major upland crops using soil moisture model –Focused on the Jeollanam-do-. Journal of the Korean Society of Agricultural Engineers 57(3): 65-76 (in Korean). doi:10.5389/KSAE.201 5.57.3.065.
12. Keyantash, J., and Dracup, J, 2002. The quantification of drought: An evaluation of drought indices. Bulletin of the American Meteorological Society 83(8): 1167-1180. doi:10.
1175/1520-0477-83.8.1167.
13. Kim, S. J., M. I. Kim, C. H. Lim, W. K. Lee, and B. J. Kim, 2017. Applicability analysis of FAO56 penman-monteith methodology for estimating potential evapotranspiration in Andong dam watershed using limited meteorological data.
Journal of Climate Change Research 8(2): 125-143 (in
Korean). doi:10.15531/KSCCR.2017.8.2.125.
14. Korea Meteorological Administration (KMA), 2018. 2017 abnormal climate report. Korea Meteorological Administration, Seoul, Korea (in Korean).
15. Lee, J. J., S. U. Shin, J. H. Jeong, and G. I. Chun, 2018.
Development of groundwater level monitoring and forecasting technique for drought analysis (Ⅰ) - Groundwater drought monitoring using standardized groundwater level index (SGI). Journal of Korea Water Resources Association 51(11): 1011-1020 (in Korean).
doi:10.3741/JKWRA.2018.51.11.1011.
16. Lee, H. J., W. H. Nam, D. H. Yoon, E. M. Hong, D. E.
Kim, M. D. Svoboda, T. Tadesse, and B. D. Wardlow, 2019.
Satellite-based evaporative stress index (ESI) as an indicator of agricultural drought in North Korea. Journal of the Korean Society of Agricultural Engineers 61(3): 1-14 (in Korean). doi:10.5389/KSAE.2019.61.3.001.
17. McKee, T. B., N. J. Doesken, and J. Kliest, 1993. The relationship of drought frequency and duration to time scales. In Proceedings of the 8th Conference of Applied Climatology, 17-22 January, Anaheim, CA. American Meteorological Society, Boston, MA. 179-184.
18. Mun, Y. S., W. H. Nam, M. G. Jeon, T. Kim, E. M. Hong, M. J. Hayes, and T. Tadesse, 2019. Application of meteorological drought index using Climate Hazards Group InfraRed Precipitation wigh Station (CHIRPS) based on global satellite-assisted precipitation products in Korea.
Journal of the Korean Society of Agriculture Engineers 61(2): 1-11 (in Korean). doi:10.5389/KSAE.2019.61.2.001.
19. Nam, W. H., J. Y. Choi, S. H. Yoo, and B. A. Engel, 2012.
A real-time online drought broadcast system for monitoring soil moisture index. KSCE Journal of Civil Engineering 16(3): 357-365. doi:10.1007/s12205-012-1357-3.
20. Nam, W. H., M. J. Hayes, D. A. Wilhite, T. Tadesse, M.
D. Svoboda, and C. L. Knutson, 2014. Drought management and policy based on risk assessment in the context of climate change. Magazine of the Korean Society of Agricultural Engineers 56(2): 2-15 (in Korean).
21. Nam, W. H., T. Tadesse, B. D. Wardlow, M. W. Jang, and S. Y. Hong, 2015a. Satellite-based hybrid drought assessment using Vegetation Drought Response Index in South Korea (VegDRI-SKorea). Journal of the Korean Society of Agricultural Engineers 57(4): 1-9 (in Korean). doi:10.5389/
KSAE.2015.57.4.001.
22. Nam, W. H., M. J. Hayes, M. D. Svoboda, T. Tadesse, and
D. A. Wilhite, 2015b. Drought hazard assessment in the context of climate change for South Korea. Agricultural Water Management 160: 106-117. doi:10.1016/j.agwat.2015.
06.029.
23. Nam, W. H., E. M. Hong, J. Y. Choi, T. G. Kim, M. J.
Hayes, and M. D. Svoboda, 2017. Assessment of the extreme 2014-2015 drought events in North Korea using weekly Standardized Precipitation Evapotranspiration index (SPEI).
Journal of the Korean Society of Agricultural Engineers 59(4): 65-74 (in Korean). doi:10.5989/KSAE.2017.59.4.065.
24. Norman, J. M., W. P. Kustas, and K. S. Humes, 1995.
Source approach for estimating soil and vegetation energy fluxes in observations of directional radiometric surface temperature. Agricultural and Forest Meteorology 77(3-4):
263-292. doi:110.1016/0168-1923(95)02265-Y.
25. Otkin, J. A., M. C. Anderson, C. Hain, I. E. Mladenova, J. B. Basara, and M. Svoboda, 2013. Examining rapid onset drought development using thermal infrared-based evaporative stress index. Journal of Hydrometeorology 14: 1057-1074.
doi:10.1175/JHM-D-12-0144.1.
26. Otkin, J. A., M. C. Anderson, C. Hain, and M. Svoboda, 2014. Examining the relationship between drought development and rapid changes in the evaporative stress index. Journal of Hydrometeorology 15: 938-956. doi:10.1175/
JHM-D-13-0110.1.
27. Palmer, W. C., 1965. Meteorological drought. Research Paper 45. US Department of Commerce Weather Bureau, Washington DC.
28. Smith, A. D., and R. W. Katz, 2013. US billion-dollar weather and climate disasters: Data sources, trends, accuracy and biases. Natural Hazards 67: 387-410. doi:10.1007/s1106 9-013-0566-5.
29. Sohn, K. H., D. H. Bae, and J. H. Ahn, 2014. Projection and analysis of drought according to future climate and hydrological information in Korea. Journal of the Korea Water Resources Association 47(1): 71-82 (in Korean).
doi:10.3741/JKWRA.2014.47.1.71.
30. Steinemann, A., 2003. Drought triggers: A stochastic approach to evaluation. Journal of the American Water Resources Association 39(5): 1217-1234. doi:10.1111/j.175 2-1688.2003.tb03704.x.
31. Sternberg, T., 2011. Regional drought has a global impact.
Nature 472: 169. doi:10.1038/472169d.
32. Sur, C. Y., K. J. Kim, W. J. Choi, J. H. Sim, and M. H.
Choi, 2014. Drought assessments using satellite-based
drought index in Korea; Southern region case in 2013.
Journal of Korean Society of Hazard Mitigation 14(3):
127-131 (in Korean). doi:10.9798/KOSHAM.2014.14.3.127.
33. Svoboda, M., D. LeComte, M. Hayes, R. Heim, K. Gleason, J. Angel, B. Rippey, R. Tinker, M. Palecki, D. Stooksbury, D. Miskus, and S. Stephens, 2002. The drought monitor.
Bulletin of the American Meteorological Society 83(8):
1181-1190. doi:10.1175/1520-0477-83.8.1181.
34. Wilhite, D. A., and M. H. Glantz, 1985. Understanding the drought phenomenon: The role of definitions. Water International 10(3): 111-120. doi:10.1080/025080685086863 28.
35. Wilhite, D. A., M. J. Hayes, C. Knutson, and K. H. Smith, 2000. Planning for drought: Moving from crisis to risk management. Journal of the American Water Resources Association 36(4): 697-710. doi:10.1111/j.1752-1688.2000.tb 04299.x.
36. Xia, Y., M. B. Ek, C. D. Peters-Lidard, D. Mocko, M.
Svoboda, J. Sheffield, and E. F. Wood, 2014. Application of USDM statistics in NLDAS-2: Optimal blended NLDAS drought index over the continen-tal United States. Journal of Geophysical Research: Atmosphere 119: 2947-2965.
doi:10.1002/2013JD020994.
37. Yoon, D. H., W. H. Nam, H. J. Lee, E. M. Hong, T. G.
Kim, A. K. Shin, and M. D. Svoboda, 2018. Application of evaporative stress index (ESI) for satellite-based agricultural drought monitoring in South Korea. Journal of the Korean Society of Agricultural Engineers 60(6): 121-131 (in Korean). doi:10.5389/KSAE.2018.60.6.121.