Citation: Yun HM, Lei XJ, Cheong JY, Kang JS, Kim IH. 2017. Effect of different levels of fiber and protein on growth performance and fecal characteristics in weaning pigs. Korean Journal of Agricultural Science 44:366-374.
DOI: https://doi.org/10.7744/kjoas.20170044 Editor: Jung Min Heo, Chungnam National University, Korea
Received: April 16, 2017
Revised: August 17, 2017 Accepted: August 29, 2017 Copyright: © 2017 Korean Journal of Agricultural Science.
This is an Open Access article distributed under the terms of the Creative Com- mons Attribution Non-Commercial License (http:
//creativecommons.org/licenses/by-nc/4.0/) which permits unrestricted non-commercial use, distribution, and reproduction in any medium, provided the original work is properly cited.
OPEN ACCESS
ANIMAL
Effect of different levels of fiber and protein on growth performance and fecal characteristics in weaning pigs
Hyeok Min Yun
1†, Xin Jian Lei
1†, Jin Young Cheong
1,2, Jung Sun Kang
3, In Ho Kim
1*1
Department of Animal Resource and Science, Dankook University, Cheonan, Chungnam 31116, Korea
2
Daehan Feed Co., Ltd, Incheon 23010, Korea
3
Genebiotech, Co. Ltd., Seoul 06774, Korea
*Corresponding author: [email protected]
†
These authors contributed equally to this work as the first authors.
Abstract
This experiment was conducted to evaluate the growth performance, fecal score, and fecal microbial shedding in weaning pigs fed diets with different levels of fiber and protein. A total of 96 weaning piglets (7.41 ± 0.71 kg) were used in a 5-week trial. Pigs were allotted to dietary treatments based on initial body weight in a 2 × 2 factorial design with the following factors: dietary fiber (100 and 200 g/kg, respectively, during days 0 to 14; 175 and 300 g/kg, respectively, during days 14 to 35) and dietary protein (170 or 200 g/kg).
There were 6 replicates with 4 pigs per pen. On day 14, pigs fed high protein or high fiber diets had heavier body weight (p < 0.05). During days 0 to 14, pigs fed high protein or high fiber diets grew faster (p < 0.05). Additionally, during days 14 to 35, an interactive effect of fiber and protein was found (p < 0.05) on average daily gain. The different levels of protein and fiber in diet did not affect the pigs’ fecal scores (p > 0.05). However, feces from the high fiber group showed lower concentration of Escherichia coli (p < 0.05). In conclusion, the results of the present study indicate that a high protein diet improves the growth of weaning pigs especially during the first two weeks. Moreover, the increments in fiber level, even in the high protein diet, favorably decreased the number of E. coli.
Keywords: fiber, growth performance, protein, weaning pigs
Introduction
Weaning is a nutritionally, physiologically, and environmentally critical period in pig production.
To reduce digestive disorders and diarrhea, previous studies have investigated effects of changes
in ingredient compositions and nutrient levels including protein and carbohydrates in weaning
pigs (Montagne et al., 2004; De Lange et al., 2010; Mun et al., 2017). Even though weaning pigs
require high amounts of dietary protein, the negative effects of high protein content, including
diarrhea and reductions in growth rates, can be observed during the first two weeks after weaning
(Madec et al., 2000; Jang et al., 2016). A high amount of protein may encourage the proliferation of pathogenic bacteria in the gastrointestinal tract (Ball and Aherne, 1987). However, the increase in protein level (obtained by increasing in wheat or corn gluten meal concentrations) in the weaning pigs’ diet leads to increased daily gain and body weight (Bikker et al., 2006). Reducing the amount of protein in the diet of weaning pigs by more than 2% of the standard level had a negative impact on pigs’ growth (Nyachoti et al., 2006). This decreased growth performance was specifically investigated during the first one or two weeks after weaning. Wellock et al. (2009) suggested that the growth retardation was related not only to protein quantity, but also to protein quality. Wellock et al. (2009) found that the low protein quality in a diet with raw cereal and plant protein had a negative effect on the growth of weaning pigs over the short term.
Previous research attempted to balance intestinal microbes by reducing proteins, coupled with amino acid supplementation (Le Bellego et al., 2002; Nyachoti et al., 2006; Le Wellock et al., 2007; Heo et al., 2009). On the other hand, dietary fiber has been investigated for its capacity to reduce the chance of metabolic disorders and to improve the microbial balance in young pigs (Mateos et al., 2006; Wellock et al., 2008; Molist et al., 2009; Halas et al., 2010). The beneficial effects of dietary fiber include an improved gut ecosystem and the nitrogen repartitioning effect.
Therefore, the objective of this study was to investigate the effects of different levels of dietary fiber and protein in diets on the growth performance and fecal characteristics of weaning pigs.
Materials and Methods
The Animal Care and Use Committee of Dankook University approved all experimental protocols used in the current study.
Experimental design, animals and diets
A total of 96 barrows ([Landrace × Yorkshire] × Duroc) with an average initial body weight of 7.41 ± 0.71 kg were selected for a 5-week trial. Pigs were allotted to dietary treatments based on their body weight and sex in a 2 × 2 factorial experiment, with the respective factors being fiber (low vs. high; 100 and 200 g/kg, respectively, during days 0 to 14; 175 and 300 g/kg, respectively during days 14 to 35, respectively) and protein (low vs. high; 170 and 200 g/kg respectively). Each treatment had 6 replicate pens (1.0 × 1.2 m
2) consisting of 4 pigs (2 gilts and 2 barrows) per pen.
Low protein diets included a balanced level of lysine combined with synthetic amino acids. Wheat bran and beet pulp were used as fiber sources in the experimental diets. All experimental diets were fed in mash form. All of the diets were formulated to contain approximately 10.63 MJ/kg net energy and 14.3 g/kg standard ileal digestible basis (SID) lysine for phase I (days 0 to 14), and 10.46 NE MJ/kg and 13.0 g/kg SID lysine for phase II (days 14 to 35) (Tables 1 and 2). Diets were formulated to meet or exceed the nutrient requirements recommended by NRC (2012). All of the pigs were housed in an environmentally controlled facility with slatted plastic flooring and a mechanical ventilation system. Each pen was equipped with a one-sided self-feeder and a nipple waterer to allow the pig ad libitum access to feed and water throughout the experimental period.
Sampling and measurements
Individual pig weight was measured at the beginning, day 14, and day 35 of the experimental period, and feed
consumption was recorded on a pen basis to calculate average daily gain (ADG), average daily feed intake (ADFI),
and gain : feed ratio.
Subjective fecal scores were monitored daily from days 0 to 35 by the same trained person using a scale ranging from 1 to 5, insert a space behind where 1 = hard and dry pellet but small mass, 2 = hard and formed stool, 3 = soft and formed stool but moist, 4 = soft and unformed stool, and 5 = watery and liquid stool.
For fecal microbial shedding, fecal samples were collected via massaging the rectum from 2 pigs randomly selected from each pen (1 gilt and 1 barrow), pooled and placed on ice for transportation to the laboratory, where analysis was immediately carried out. The composite fecal sample (1 g) from each pen was diluted with 9 mL of 1% peptone broth
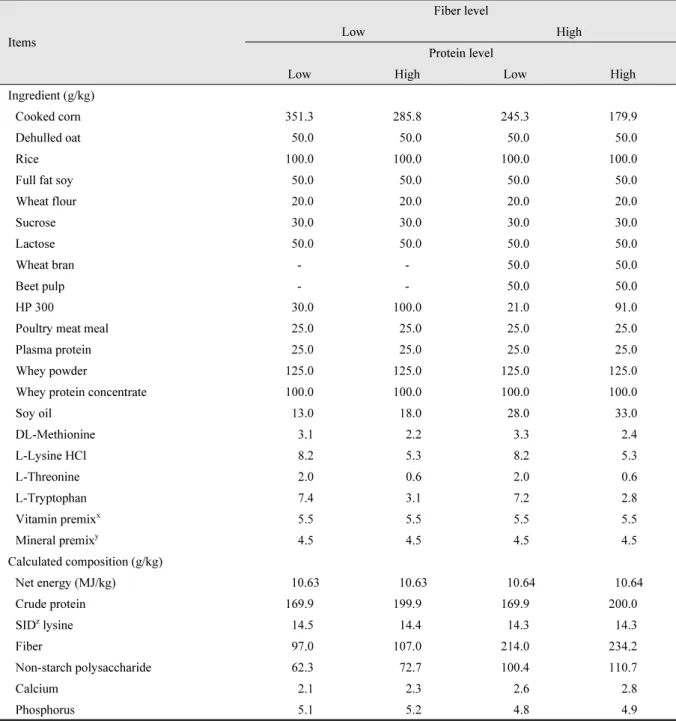
Table 1. Composition of the experimental diets (days 0 to 14; as-fed basis).
Items
Fiber level
Low High
Protein level
Low High Low High
Ingredient (g/kg)
Cooked corn 351.3 285.8 245.3 179.9
Dehulled oat 50.0 50.0 50.0 50.0
Rice 100.0 100.0 100.0 100.0
Full fat soy 50.0 50.0 50.0 50.0
Wheat flour 20.0 20.0 20.0 20.0
Sucrose 30.0 30.0 30.0 30.0
Lactose 50.0 50.0 50.0 50.0
Wheat bran - - 50.0 50.0
Beet pulp - - 50.0 50.0
HP 300 30.0 100.0 21.0 91.0
Poultry meat meal 25.0 25.0 25.0 25.0
Plasma protein 25.0 25.0 25.0 25.0
Whey powder 125.0 125.0 125.0 125.0
Whey protein concentrate 100.0 100.0 100.0 100.0
Soy oil 13.0 18.0 28.0 33.0
DL-Methionine 3.1 2.2 3.3 2.4
L-Lysine HCl 8.2 5.3 8.2 5.3
L-Threonine 2.0 0.6 2.0 0.6
L-Tryptophan 7.4 3.1 7.2 2.8
Vitamin premix
x5.5 5.5 5.5 5.5
Mineral premix
y4.5 4.5 4.5 4.5
Calculated composition (g/kg)
Net energy (MJ/kg) 10.63 10.63 10.64 10.64
Crude protein 169.9 199.9 169.9 200.0
SID
zlysine 14.5 14.4 14.3 14.3
Fiber 97.0 107.0 214.0 234.2
Non-starch polysaccharide 62.3 72.7 100.4 110.7
Calcium 2.1 2.3 2.6 2.8
Phosphorus 5.1 5.2 4.8 4.9
x
Provided per kg of complete diet:11,000 IU of vitamin A; 1,051 IU of vitamin D
3; 50 U of vitamin E; 3 mg of vitamin K; 3 mg of vitamin B
1; 8 mg of vitamin B
2; 6 mg of vitamin B
6; 33 µg of vitamin B
12; 35 mg of pantothenic acid; 50 mg of niacin; 0.03 mg of biotin.
y
Provided per kg of complete diet: 150 mg of Cu; 125 mg of Fe; 150 mg of Zn; 75 mg of Mn; 0.5 mg of I; 0.5 mg of Co; 0.3 mg of Se.
z
SID: standard ileal digestible basis.
(Becton, Dickinson and Company, NJ, USA) and homogenized. Viable counts of bacteria in the fecal samples were then conducted by plating serial 10-fold dilutions (in 1% peptone solution) onto MacConkey agar plates (Difco Laboratories, Detroit, MI, USA) and Lactobacilli medium III agar plates (Medium 638, DSMZ, Braunschweig, Germany) to isolate the Escherichia coli and Lactobacilli, respectively. The MacConkey agar plates were then incubated for 24 h at 37 ℃, and the Lactobacilli medium III agar plates were incubated for 48 h at 39℃ under anaerobic conditions. The E. coli and Lactobacilli colonies were counted immediately after removal from the incubator.
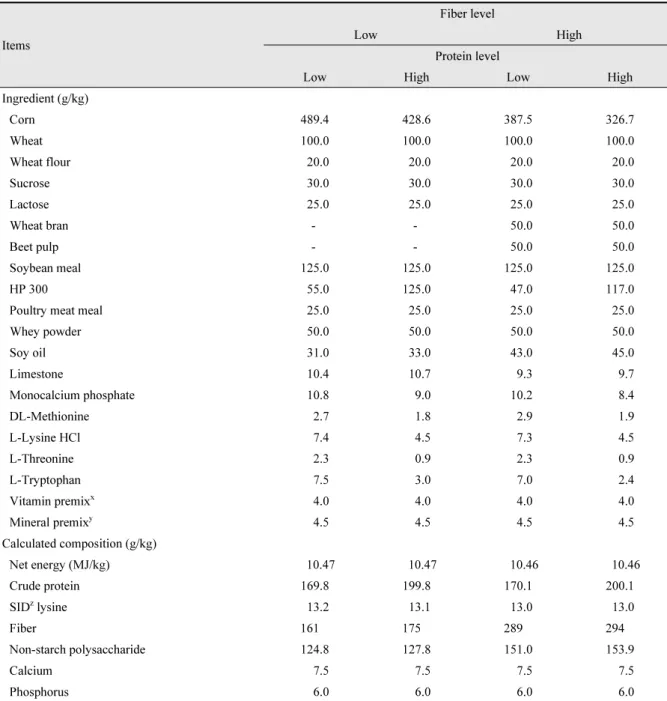
Table 2. Composition of the experimental diets (days 14 to 35; as-fed basis).
Items
Fiber level
Low High
Protein level
Low High Low High
Ingredient (g/kg)
Corn 489.4 428.6 387.5 326.7
Wheat 100.0 100.0 100.0 100.0
Wheat flour 20.0 20.0 20.0 20.0
Sucrose 30.0 30.0 30.0 30.0
Lactose 25.0 25.0 25.0 25.0
Wheat bran - - 50.0 50.0
Beet pulp - - 50.0 50.0
Soybean meal 125.0 125.0 125.0 125.0
HP 300 55.0 125.0 47.0 117.0
Poultry meat meal 25.0 25.0 25.0 25.0
Whey powder 50.0 50.0 50.0 50.0
Soy oil 31.0 33.0 43.0 45.0
Limestone 10.4 10.7 9.3 9.7
Monocalcium phosphate 10.8 9.0 10.2 8.4
DL-Methionine 2.7 1.8 2.9 1.9
L-Lysine HCl 7.4 4.5 7.3 4.5
L-Threonine 2.3 0.9 2.3 0.9
L-Tryptophan 7.5 3.0 7.0 2.4
Vitamin premix
x4.0 4.0 4.0 4.0
Mineral premix
y4.5 4.5 4.5 4.5
Calculated composition (g/kg)
Net energy (MJ/kg) 10.47 10.47 10.46 10.46
Crude protein 169.8 199.8 170.1 200.1
SID
zlysine 13.2 13.1 13.0 13.0
Fiber 161 175 289 294
Non-starch polysaccharide 124.8 127.8 151.0 153.9
Calcium 7.5 7.5 7.5 7.5
Phosphorus 6.0 6.0 6.0 6.0
x
Provided per kg of complete diet: 11,000 IU of vitamin A; 1,072 IU of vitamin D3; 50 IU of vitamin E; 3 mg of vitamin K; 3 mg of vitamin B
1; 8 mg of vitamin B
2;6 mg of vitamin B
6; 3 ug of vitamin B
12; 35 mg of pantothenic acid; 50 mg of niacin; 0.03 mg of biotin.
y
Provided per kg of complete diet: 150 mg of Cu; 125 mg of Fe; 150 mg of Zn; 75 mg of Mn; 0.5 mg of I; 0.5 mg of Co; 0.3 mg of Se.
z
SID: standard ileal digestible basis.
Statistical analyses
Before conducting statistical analysis of the microbial counts, the value was transformed logarithmically. All data were analyzed as a completely randomized 2 × 2 factorial arrangement by using the GLM procedure of SAS (SAS Inst. Inc., 2009). The pen was considered the experimental unit. The final model included the main effects of protein and fiber levels as well as the interaction between protein and fiber levels. The data were reported as means with their standard errors. Probability values less than 0.05 were considered significant.
Results
Growth performance
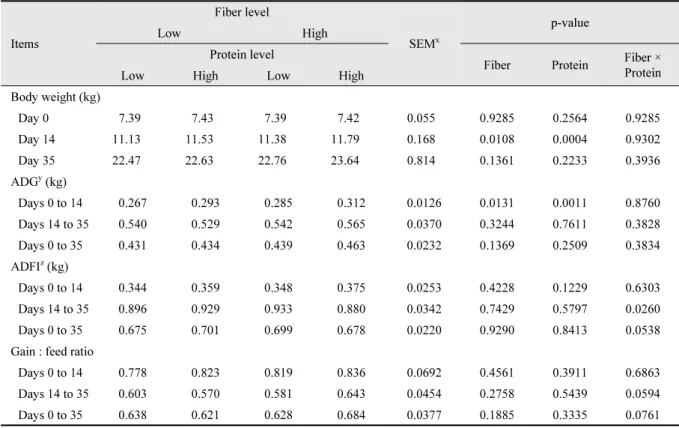
The effect of different levels of dietary fiber and protein on the growth of weaning pigs is shown in Table 3. No significant differences were observed between the initial and final body weights, ADG during phase II and overall period, ADF during phase I and overall period, and gain:feed ratio through the experiment. However, on day 14, pigs fed with high protein or high fiber diets were heavier (p < 0.05) than those fed with low protein or low fiber diets.
During days 0 to 14, the ADG of pigs fed higher protein diets was higher than those fed low protein diets (p < 0.05).
Interactive effects of fiber and protein were only found on ADFI during days 14 to 35 (p < 0.05).
Table 3. Effects of levels of fiber and protein on growth performance in weaning pigs.
Items
Fiber level
SEM
xp-value
Low High
Protein level
Fiber Protein Fiber × Protein
Low High Low High
Body weight (kg)
Day 0 7.39 7.43 7.39 7.42 0.055 0.9285 0.2564 0.9285
Day 14 11.13 11.53 11.38 11.79 0.168 0.0108 0.0004 0.9302
Day 35 22.47 22.63 22.76 23.64 0.814 0.1361 0.2233 0.3936
ADG
y(kg)
Days 0 to 14 0.267 0.293 0.285 0.312 0.0126 0.0131 0.0011 0.8760
Days 14 to 35 0.540 0.529 0.542 0.565 0.0370 0.3244 0.7611 0.3828
Days 0 to 35 0.431 0.434 0.439 0.463 0.0232 0.1369 0.2509 0.3834
ADFI
z(kg)
Days 0 to 14 0.344 0.359 0.348 0.375 0.0253 0.4228 0.1229 0.6303
Days 14 to 35 0.896 0.929 0.933 0.880 0.0342 0.7429 0.5797 0.0260
Days 0 to 35 0.675 0.701 0.699 0.678 0.0220 0.9290 0.8413 0.0538
Gain : feed ratio
Days 0 to 14 0.778 0.823 0.819 0.836 0.0692 0.4561 0.3911 0.6863
Days 14 to 35 0.603 0.570 0.581 0.643 0.0454 0.2758 0.5439 0.0594
Days 0 to 35 0.638 0.621 0.628 0.684 0.0377 0.1885 0.3335 0.0761
x
SEM: standard error of the mean.
y
ADG: average daily gain.
z
ADFI: average daily feed intake.
Fecal scores and fecal microbial shedding
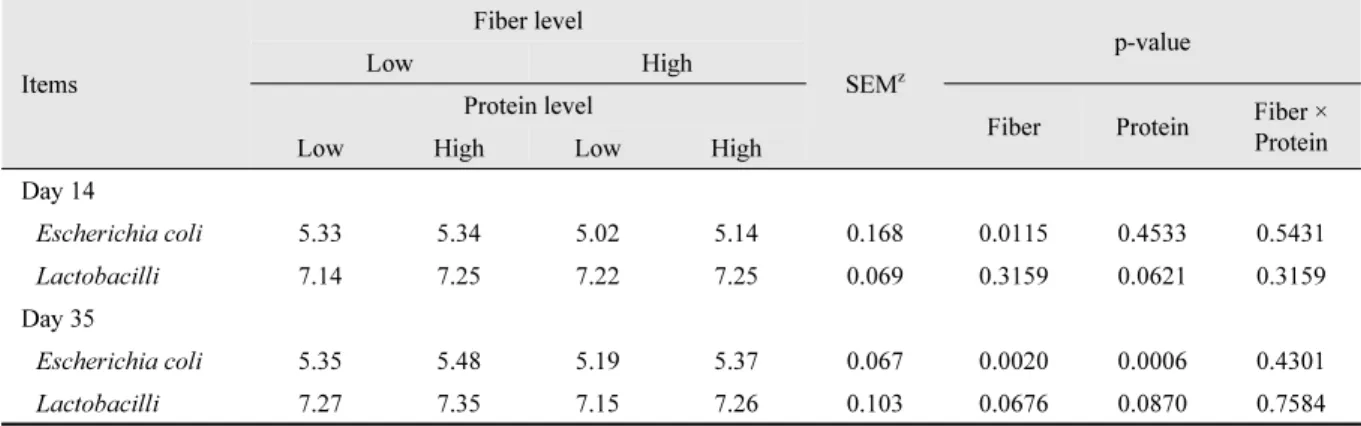
The effect of dietary fiber and protein levels on fecal scores and fecal microbial shedding are shown in Tables 4 and 5, respectively. Although the pigs were fed different levels of fiber and protein, there was no diet-related difference in fecal scores in this study. On day 14, pigs fed a high fiber diet had lower counts of E. coli (p < 0.05) than those fed low fiber diets. However, the fiber level did not affect Lactobacilli counts. On day 35, more E. coli was found in the feces of pigs fed with high protein or low fiber diets (p < 0.001). Interactive effects of fiber and protein levels were not found in microbial counts on both days 14 and 35.
Table 4. Effects of levels of fiber and protein on fecal scores in weaning pigs
y.
Items
Fiber level
SEM
zp-value
Low High
Protein level
Fiber Protein Fiber × Protein
Low High Low High
Days 0 to 14 2.75 3.00 3.00 3.25 0.677 0.4744 0.4565 0.9542
Days 14 to 35 2.50 3.00 2.75 3.25 0.736 0.5098 0.1992 1.0000
y
Fecal scores were determined using the following fecal scoring system: 1, hard and dry pellet but small mass; 2, hard and formed stool; 3, soft and formed stool but moist; 4, soft and unformed stool; 5, watery and liquid stool.
z
SEM: standard error of the means.
Table 5. Effects of levels of fiber and protein on Escherichia coli and Lactobacilli counts (log
10cfu/g) in feces of weaned pigs.
Items
Fiber level
SEM
zp-value
Low High
Protein level
Fiber Protein Fiber × Protein
Low High Low High
Day 14
Escherichia coli 5.33 5.34 5.02 5.14 0.168 0.0115 0.4533 0.5431
Lactobacilli 7.14 7.25 7.22 7.25 0.069 0.3159 0.0621 0.3159
Day 35
Escherichia coli 5.35 5.48 5.19 5.37 0.067 0.0020 0.0006 0.4301
Lactobacilli 7.27 7.35 7.15 7.26 0.103 0.0676 0.0870 0.7584
z