for Marine Environmental Engineering
Vol. 15, No. 3. pp. 198-207, August 2012198
해양심층수에 의한 해역 비옥화 효과에 관한 기초 연구
시오카리 메구미1,2,†·다베타 시게루2·가토 타카요시3
1일본 해상기술안전연구소
2일본 동경대학교 신영역창성과학연구과
3일본 동경대학교 공학계연구과
A Fundamental Study on the Effect of Ocean Fertilization by Deep Sea Water
Megumi Shiokari1,2,†, Shigeru Tabeta2 and Takayoshi Kato3
1National Maritime Research Institute, Mitaka city, 181-0004, Japan
2 Graduate School of Frontier Sciences,the University of Tokyo, Kashiwa city, 277-8563, Japan
3 Graduate School of Engineering,the University of Tokyo, Tokyo 113-8656, Japan
요 약
본 연구에서 식물플랑크톤 뿐 아니라 동물플랑크톤을 포함하는 생태계 모델을 이용하여 해양 심층수의 해역 비옥화 의 효과를 검증하였다. 모델은 2종의 식물플랑크톤, 3종의 동물플랑크톤, 질산염, 암모늄염, 규산염, 입자성 유기질 소, 용존 유기질소, 입자성 규소 총 11개 요소로 구성된 NEMURO에 기초하고 있다. NEMURO의 11개 요소 외에 도 두 종의 식물플랑크톤내 질소 셀 쿼터와 대형 식물플랑크톤내 규산염 셀 쿼터를 추가하였다. 해역 비옥화 효과 를 조사하기 위해서 이즈 오시마 섬에서 실험을 실시하였지만, 본 실험에서 심층수의 유무에 의한 명확한 차이를 확 인할 수 없었다. 이 실험 결과의 원인들을 모델 시뮬레이션에 의해 조사하였으며, 그 원인의 하나는 실험에 사용된
표층수의 높은 영양염 농도이다. 다른 원인은 무기질소 섭취율이 NH
4에 대한 NO
3의 비율에 관련되어 있으므로 무
기질소의 총 농도의 증가가 광합성 속도를 반드시 증진시키지 않는다는 것이다. 이 모델로 실험 결과들을 재현할 수 있었기 때문에 우리는 이 모델을 이용하여 해양 심층수에 의한 해역 비옥화의 효과를 검증하였다. 해양 심층수의 공 급 간격이 너무 짧거나 해양 심층수의 양이 너무 많을 때 해역 비옥화 효과는 나타나기 어려운 것으로 밝혀졌다. 해 양 심층수의 첨가가 너무 비번하거나 너무 많이 첨가하면 플랑크톤 농도의 희석이 식물플랑크톤의 광합성 증진 효 과를 초과해 버린 것으로 추측된다.
Abstract − In this study, we investigated the effect of ocean fertilization by deep sea water, using an ecosystem model which contains not only phytoplankton but also zooplankton. The model is based on NEMURO which consists of eleven compartments - two species of phytoplankton, three species of zooplankton, NO3, NH4, Si(OH)4, particulate organic nitrogen, dissolved organic nitrogen and particulate silicon. We introduced nitrogen cell quota in the both species of phytoplankton, and silicon cell quota in the large phytoplankton in addition to the eleven compartments of NEMURO. We made the experiment at Izu Oshima Island in order to investigate the effect of ocean fertilization. In this experiment, we could not find clear differences between the cases with and without deep sea water. We investigated the causes of the experiment results by the model simulations. One of the causes was high concentrations of nutrients in surface seawater used in the experiment. Another was that the increase of total concentration of inorganic nitrogen does not necessarily accelerate the photosynthetic rate because inorganic nitrogen uptake rate is related to the ratio of NO3 to NH4. Because the model can represent the results of the experiment, we investigated the effect of ocean fertilization by deep sea water using this model. We found that the effect of ocean fertilization hardly appeared when the interval of the addition of deep
†
Corresponding author: [email protected]
This paper was selected and reviewed for publication from EAWOMEN
22011
sea water was too short, or the amount of deep sea water was too much. It is supposed that if the addition of deep sea water is too frequent or too much, the dilution of plankton’s concentrations will exceed the effect of promoting phytoplankton’s photosynthesis.
Keywords: Deep sea water(해양 심층수), Ocean fertilization(해역 비옥화), Ecosystem model(생태계 모 델), Izu Oshima Island(이즈 오시마 섬)
1. INTRODUCTION
It is expected that the world food problem will be serious by increasing population. As the solution of this problem, some studies of the ocean fertilization by deep sea water are going on.
Deep sea water contains more nutrients - NO3, NH4, PO4, Si(OH)4, for example - than surface seawater. By adding deep sea water into surface seawater, it is expected that the multipli- cation of phytoplankton will be promoted and zooplankton will increase, then, marine products will be increased.
There are some earlier studies on this subject, but they focused on only primary production, and examined the effect of ocean fertilization by either experiment or simulations (Ouchi and Ohmura, 2004; Mizumukai et al., 2008). In this study, we investigated the effect of ocean fertilization by both experiment and simulations, using an ecosystem model which contains zooplankton. The aim of this study is to develop an evaluation technique for the effects of ocean fertilization.
2. ECOSYSTEM MODEL
The model is based on NEMURO; North Pacific Ecosystem Model for Understanding Regional Oceanography (Kishi et al., 2007) which consists of eleven compartments - two species of phytoplankton (PS and PL), three species of zooplankton (ZS,
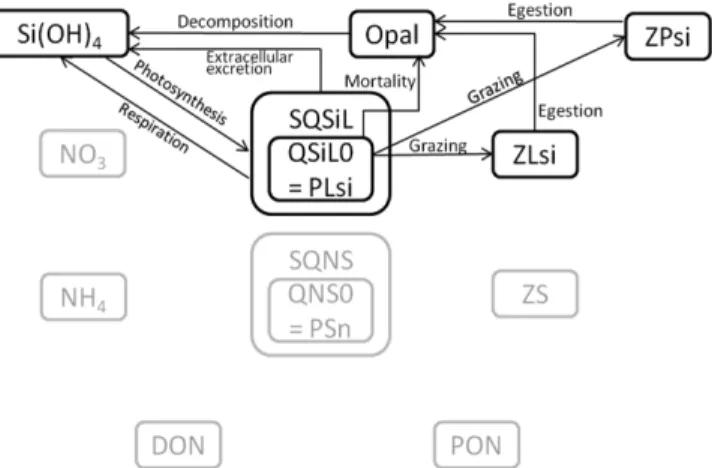
ZL and ZP), NO3, NH4, Si(OH)4, particulate organic nitrogen (PON), dissolved organic nitrogen (DON) and particulate sili- con (Opal). We introduced “Cell Quota” (Nakata, 1993) to NEM- URO, then, the model contains nitrogen cell quota in PS (SQNS), nitrogen cell quota in PL (SQNL), and silicon cell quota in PL (SQSiL) in addition to the eleven compartments of NEMURO.
Fig. 1 and Fig. 2 show the schematic diagrams of the ecosystem model.
3. EXPERIMENT
We made the experiment at Senzu, Izu Oshima Island from 16:40 on 14th October to 24:00 on 12th November, 2010 in order to investigate the effect of ocean fertilization. At first, we arranged two tanks (We named one of them ‘tank A’ and another one ‘tank B’.) and poured surface seawater into them.
We installed some equipment in the tanks as shown in Fig. 3.
On the next day, at 14:30, we added deep sea water into tank A as the ratio became about 20% of the total amount of seawater in the tank. Then, the tanks were left as those were until the end of the experiment.
We have got the data by the experiment - temperatures, light intensities and concentrations of chlorophyll-a, phytoplankton, zooplankton, NO3, NH4, SiO2, and organic nitrogen in the sea- water in the tanks. The measuring methods and equipment are as follows.
Fig. 1. Schematic diagram of the ecosystem model (For nitrogen flows).
Fig. 2. Schematic diagram of the ecosystem model (For silicon flows).
(i) Temperature: Because the chlorophyll meter used in tank A (ACL104-8M, JFE Advantech Co.,Ltd.) has a thermometer in it, we can measure temperatures with the chlorophyll meter in tank A. On the other hand, the chlorophyll meter used in tank B (ACL11-8M, JFE Advantech Co., Ltd.) does not have a thermometer, so we used a velocity meter with a thermometer (COMPACT-EM, JFE Advantech Co., Ltd.) in tank B. Measuring time was every 10 minutes from 16:40 on 14th October to 24:00 on 12th November, 2010.
(ii) Light intensity: We have only one light intensity meter (COMPACT-LW ALW-CMP, JFE Advantech Co., Ltd.), and we put it in tank A. Measuring time was every 10 minutes from 16:40 on 14th October to 24:00 on 12th November, 2010.
(iii) Chlorophyll-a: We measured the concentrations of chlo- rophyll-a with chlorophyll meters mentioned at (i) in the both tanks. Measuring time was every 10 minutes from 16:40 on 14th October, 2010 to 24:00 on 12th November, 2010. However, the data were relative concentrations of chlorophyll-a, and were required to be converted to absolute concentrations. So, we also measured the absolute concentrations of chlorophyll-a in the both tanks at 16:45 on 14th, 15:00 on 16th and 13:00 on 19th Octo- ber, 2010. We filtered seawater (0.20 L) in the both tanks respectively, and extracted the chlorophyll-a pigment with dim- ethylformamide (DMF). Then, we analyzed the concentrations of the pigment with fluorescence spectrophotometer (Turner Designs Trilogy) and compared them with the data of chlorophyll meter. We have got the approximation about the relation between absolute values and relative values as below.
(1) (2)
Here, x [no dim.] is the relative value (the data of chloro- phyll meter), and y [µg/L] is the absolute value (the concentra- tion of chlorophyll-a pigment). We can convert the data of chlorophyll meter to the absolute values by these approximate expressions.
Next, we converted the concentrations of chlorophyll-a[
µ
g/L] to the concentrations of carbon[
µ
g/L] by the below expres- sion which express the ratio of carbon to chlorophyll-a in phy- toplankton by weight. Here, C: concentrations of carbon[µ
g/L], Chla: concentrations of chlorophyll-a[µ
g/L].C:Chla=1:0.029 (by weight) (3)
Then, we converted the unit, [µg/L] to [µmolC/L] by divid- ing the weight of carbon by the molar mass of carbon: 12[g/
mol] and subsequently, we converted the concentrations of carbon [µmolC/L] to the concentrations of nitrogen [µmolN/L] by the below expression which express the ratio of carbon to nitrogen by atom.
C:N=106:16 (by atom) (4)
(iv) Phytoplankton and zooplankton: We bottled the seawa- ter in the tanks (1.00 L respectively) and added Lugol solution in them at 16:50 on 14th, 13:00 on 15th, 9:10 and 15:00 on 16th, 13:00 on 17th, 13:00 on 18th, 13:00 on 19th, 13:00 on 28th, Octo- ber and 13:00 on 12th November. We counted the numbers of each species of plankton, and converted the numbers to nitro- gen based concentration respectively. (Counting was outside order.)
(v) NO3, NH4, SiO2, and organic nitrogen: We bottled the seawater in the tanks (0.05 L respectively), froze them and sent our laboratory. Then, we analyzed the concentrations of NO3, NH4, SiO2, and organic nitrogen with auto-analyzer (Bran +
y 1.3942x 0.4646 for tankA = – ( )
y 1.3837x 0.7654 for tankB = – ( )
Fig. 3. Outline of the experiment.
Table 1. The concentrations of NH
4, NO
3, SiO
2and organic nitrogen in surface and deep seawater.
NH
4[ µmol N/L] NO
3[ µmol N/L] SiO
2[ µmol Si/L] Organic nitrogen [ µmol N/L]
Surface seawater 1.877 2.770 13.999 64.491
Deep sea water 0.518 35.320 77.890 26.162
Luebbe TRAACS 2000). In addition to the same time of sam- pling of (iv), we sampled at 14:40 on 15th October just after adding deep sea water.
Table 1 shows the initial concentrations of NH4, NO3, SiO2 and organic nitrogen in surface and deep seawater used in this experiment. We can recognize that the concentration of NH4 in surface seawater is higher than that in deep sea water. The reason might be that the surface seawater used in this experiment was coastal water which is possibly affected by sewage from village nearby.
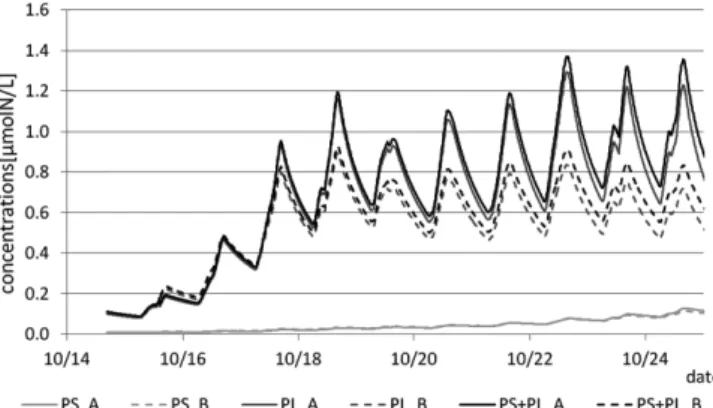
Fig. 4 shows the changes of the concentrations of the phytoplankton in the both tanks by chlorophyll meters. The data is converted to nitrogen based concentrations from chlorophyll-a based concentrations by the method (iii). In Fig. 4, the concentration of phytoplankton in tank A was higher than that in tank B from 19th to 26th October, but we can’t declare that the difference is due to adding deep sea water because there were some differences between the both tanks; tank A was possible to get more sunshine than tank B due to their location, or tank A was a little larger than tank B.
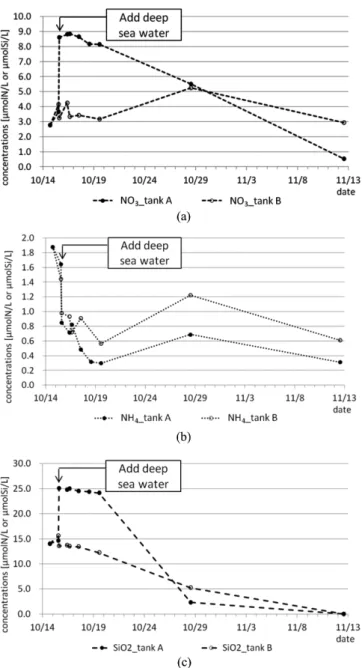
Fig. 5 shows the changes of concentrations of nutrients in the both tanks. Because it was supposed that the data of tank B in 18th October were abnormal values, perhaps due to mistakes of sampling, we got rid of the data in the graph. In Fig. 5, the concentrations of NO3 and SiO2 increased by adding deep sea water in tank A and decreased gradually because of consump- tions by photosynthesis in the both tanks. On the other hand, the concentrations of NH4 were highest in the initial conditions for the both tanks because of high concentration of NH4 in sur- face seawater as shown in Table 1.
4. REPRESENTATION OF THE RESULTS OF EXPERIMENT BY ECOSYSTEM MODEL We tried to represent the results of experiment by ecosystem model. We used the concentrations of phytoplankton, zoo- plankton, nutrients, and organic matters for the initial condi- tions of the calculations. About the parameters in the model, we used the estimated values by literature survey (Table 2). In this experiment, there was little ZL in the tanks, because ZL migrates vertically by seasons, and it is in deep layer during autumn and winter. Moreover, because ZP concentration is less than other species of plankton, it is expected that there was lit- tle ZP in the tanks. Therefore, we considered only PS, PL and ZS when we tried to represent the results of the experiment.
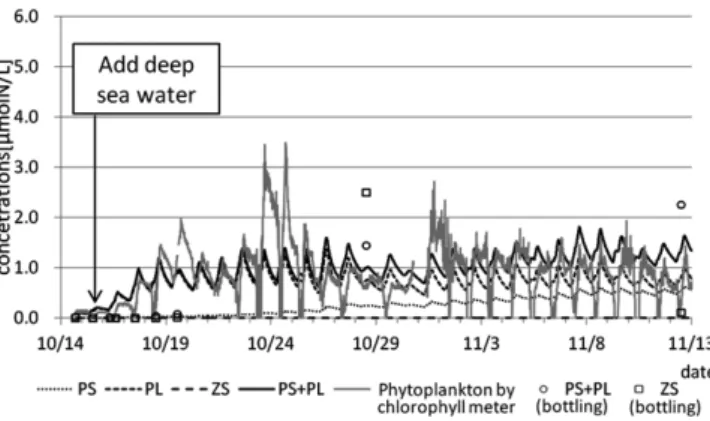
Fig. 6 and Fig. 7 show the results of calculation about tank A
Fig. 4. The changes of the concentrations of phytoplankton in the
both tanks (by chlorophyll meters).
Fig. 5. (a) The changes of the concentrations of NO
3in the both tanks. (b)
The changes of the concentrations of NH
4in the both tanks. (c) The
changes of the concentrations of SiO
2in the both tanks.
with the conditions mentioned above. When we compare the calculated values of phytoplankton (PS+PL) with the data by chlorophyll meter, we can recognize that the calculated values exceed the data by chlorophyll meter (Fig. 6). Also, about the concentrations of nutrients, the calculated values are so differ- ent from the data of experiment (Fig. 7).
It is considered that there are some reasons why we could not represent the experimental values with the estimated parameters. At first, there were a lot of species of phytoplank- ton and zooplankton in the experimental tanks, but we have to categorize them into three compartments (PS, PL and ZS) in the ecosystem model. We surveyed parameters for each specie and averaged them for each compartment. Secondly, we could not
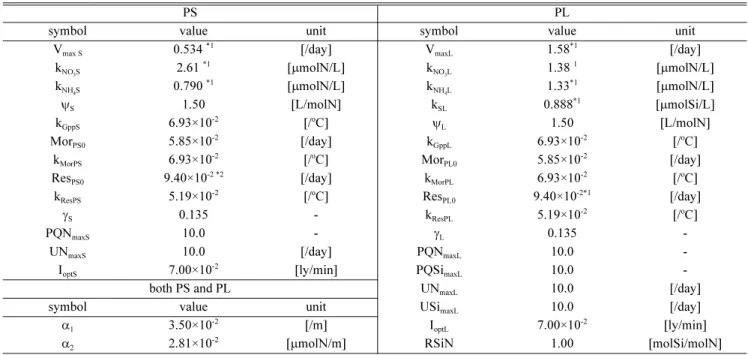
Table 2. A part of the values of the parameters used in the model
PS PL
symbol value unit symbol value unit
V
max S0.534
*1[/day] V
maxL1.58
*1[/day]
k
NO3S2.61
*1[µmolN/L] k
NO3L1.38
1[µmolN/L]
k
NH4S0.790
*1[ µmolN/L] k
NH4L1.33
*1[ µmolN/L]
ψ
S1.50 [L/molN] k
SL0.888
*1[ µmolSi/L]
k
GppS6.93×10
-2[/
oC] ψ
L1.50 [L/molN]
Mor
PS05.85×10
-2[/day] k
GppL6.93×10
-2[/
oC]
k
MorPS6.93×10
-2[/
oC] Mor
PL05.85×10
-2[/day]
Res
PS09.40×10
-2 *2[/day] k
MorPL6.93×10
-2[/
oC]
k
ResPS5.19×10
-2[/
oC] Res
PL09.40×10
-2*1[/day]
γ
S0.135 - k
ResPL5.19×10
-2[/
oC]
PQN
maxS10.0 - γ
L0.135 -
UN
maxS10.0 [/day] PQN
maxL10.0 -
I
optS7.00×10
-2[ly/min] PQSi
maxL10.0 -
both PS and PL UN
maxL10.0 [/day]
symbol value unit USi
maxL10.0 [/day]
α
13.50×10
-2[/m] I
optL7.00×10
-2[ly/min]
α
22.81×10
-2[ µmolN/m] RSiN 1.00 [molSi/molN]
*1
ECOTOX (Jørgensen et al., 2000),
*2No data in ECOTOX, used same data as PL, Others are quoted from Kishi et al. 2007 except for cell quota. For nitrogen cell quota, quoted from Nakata, 1993] for silicon cell quota, used same values as nitrogen cell quota because Si:N=1.0 (Kishi et al., 2007).
The meanings of the symbols: V
maxS,L: PS, PL maximum photosynthetic rate at 0
oC. k
NO3S,L: PS, PL half saturation constant for nitrate. k
NO4S,L: PS, PL half saturation constant for ammonium. k
SL: PL half saturation constant for silicate. ψ
S,L: PS, PL NH
4inhibition coefficient. k
GppS,L: PS, PL temperature coefficient for photosynthetic rate. Mor
PS0,PL0: PS, PL mortality rate at 0
oC. k
MorPS,PL: PS, PL temperature coefficient for mortality rate. Res
PS0,PL0: PS, PL respiration rate at at 0
oC. k
ResPS,PL: PS, PL temperature coefficient for respiration rate. γ
S,L: PS, PL ratio of extracellular excretion to photosynthesis. PQN
maxS,L: PS, PL maximum quota for nitrogen. PQSi
maxL: PL maximum quota for silicon. UN
maxS,L: PS, PL maximum uptake rate for nitrogen. I
optS,L: PS, PL optimum light intensity. RSiN: Ratio of silicon to nitrogen. α
1: Light dissipation coefficient of seawater. α
2: PS+PL self shading coefficient.
Fig. 6. The changes of the concentrations of plankton in tank A before parameter-fitting (The lines of PS, PL, ZS and PS+PL are calculated, the others are the data of the experiment. PS+PL means all of the phytoplankton).
Fig. 7. The changes of the concentrations of nutrients in tank A
before parameter-fitting (The lines are calculated, the points are the
data of the experiment).
find all parameters about all species of plankton in the experi- mental tanks and we estimated a lack of surveyed parameters with the similar species' values. Finally, the surveyed values are also uncertain because there are some differences depend- ing on the areas where the species live in. So, we should adjust the parameters as the suitable values for this area in order to represent the experimental values.
We adjusted the parameters in the model to make the model be able to represent the results of experiment. For preparation of the parameter-fitting, we analyzed the parameter sensitivity.
If we set maximum photosynthetic rate at 0oC (VmaxS,L) or temperature coefficient for photosynthetic rate (kGppS,L) as higher, concentration of phytoplankton will get higher, too. On the other hand, if we set mortality rate at 0oC (MorPS0,PL0) or temperature coefficient for mortality rate (kMorPS,PL) as higher, it will get lower. In the both cases, the changes of these temper- ature coefficients give larger influences on the concentration of phytoplankton than the changes of the photosynthetic or mor- tality rates.
About the concentrations of nutrients or organic matters, if we set decomposition rates at 0oC (VP2N0, VD2N0, etc.) or temperature coefficients for decomposition rates (kP2N, kD2N, etc.) as higher, the concentrations of nutrients will get higher and those of the organic matters will get lower. In this case, the changes of these decomposition rates give larger influences on the concentrations of nutrients and organic matters than the changes of those temperature coefficients.
Fig. 8 and Fig. 9 show the results of calculation which can represent the data of experiment after parameter-fitting based on the results of sensitivity analysis. In Fig. 8, the line of
“PS+PL” can well represent the data by chlorophyll meter.
(Here, we tried to represent the data by chlorophyll meter
which was continuously measured, not the bottling data which were discretely sampled.) Also, in Fig. 9, calculated values of NO3 and NH4 concentrations are matched with the data of experiment, and that of Si(OH)4 is also not so different from the data of experiment (SiO2).
In this calculation, we used the following values as the fitted parameters.
VmaxL=0.632 [/day] (0.4 times of original value), kGppL=11.781×10⁻² [-] (1.7 times),
MorPL0=11.7×10⁴ [/day] (2.0 times), kMorPL=11.088×10⁻² [-] (1.6 times), VmaxS=0.6408[/day] (1.2 times), kMorPS=9.702×10⁻² [-] (1.4 times),
VP2N0 (PON decomposition rate to Ammonium at 0oC)
=5.0×10⁻³ [/day] (0.1 times)
VD2N0 (DON decomposition rate to Ammonium at 0oC)
=5.0×10⁻³ [/day] (0.1 times),
VP2Si0 (Opal decomposition rate to Silicate at 0oC)
=5.0×10⁻³ [/day] (0.1 times)
5. EXAMINATION FOR THE RESULTS OF EXPERIMENT
In this experiment, we could not find clear differences which were caused by adding deep sea water between tank A and B although the concentrations of nutrients in tank A were higher than in tank B. We examined for the reasons by simulations with the ecosystem model, and it is proved that one of the causes is high concentrations of nutrients in surface seawater. If they were much lower, there might be clearer differences between tank A and B (Fig. 10 and Fig. 11).
However, phytoplankton’s inorganic nitrogen uptake rate
Fig. 8. The changes of the concentrations of plankton in tank A after
parameter-fitting (The lines of PS, PL, ZS and PS+PL are calcu- lated, the others are the data of experiment. PS+PL means all of the phytoplankton).
Fig. 9. The changes of the concentrations of nutrients in tank A after
parameter-fitting (The lines are calculated, the points are the data of
experiment).
was not maximum rate. So, it is supposed that the concentra- tions of nutrients might be one of the limitation factors for pho- tosynthesis. In this model, because NO3 uptake rate is restricted by NH4 concentration (the formulae (1) to (3) express the inor- ganic nitrogen uptake rate of PS, or small phytoplankton), even if NO3 concentration becomes higher, NO3 uptake rate will not necessarily go up in the case of high concentration of NH4.
UptakeNS=vS1(NH4, NO3)·QNS0 (5)
vS1(NH4, NO3)=UNmaxS
× (6)
=PQNmaxS -
(7) UptakeNS: PS nitrogen uptake rate [µmolN/L/day]
QNS0: PS subsistent nitrogen quota [µmolN/L]
UNmaxS: PS maximum uptake rate for nitrogen [/day]
NO3: NO3 concentration in seawater [µmolN/L]
NO4: NH4 concentration in seawater [µmolN/L]
KNO
3S: PS Half saturation constant for nitrate [µmolN/L]
KNH4S: PS Half saturation constant for ammonium [µmolN/L]
ψS: PS NH4 inhibition coefficient [L/µmolN]
PQNmaxS: PS maximum quota for nitrogen [No dimension]
SQNS: PS nitrogen cell quota [µmolN/L]
Here, we define GppNPSn= , and
GppAPSn= .
In this experiment, NO3 concentration was higher in deep sea water than that in surface seawater, but NH4 concentration was the reverse. So, NO3 uptake rate (GppNPSn) went up and NH4 uptake rate (GppAPSn) went down by adding deep sea water, but total inorganic nitrogen uptake rate (GppNPSn +GppAPSn) went down despite the total inorganic nitrogen concentration went up (Fig. 12). On the other hand, if the nutri- ents’ concentrations in surface seawater are one-third, NH4
NO
3K
NO3S+ NO
3---exp ψ ( –
SNH
4) NH
4K
NH4S+ NH
4---
⎝ + ⎠
⎛ ⎞
v
S2( QNS0 SQNS , ) v
S2( QNS0 SQNS , ) QNS0 SQNS +
---/ PQN QNS0 (
maxS– 1 )
NO
3K
NO3+ NO
3---exp ψ ( –
SNH
4) NH
4K
NH4S+ NH
4--- Fig. 10. The changes of the concentrations of phytoplankton in the
both tanks with the same initial conditions as the experiment (The literatures A or B at the end of legend mean “in the tank A” or “in the tank B”).
Fig. 11. The changes of the concentrations of plankton in the both tanks with one-third of nutrients’ concentrations as initial values (The literatures A or B at the end of legend mean “in the tank A”
or “in the tank B”).
Fig. 12. The changes of nitrogen uptake rate with the same initial conditions as the experiment (The literatures A or B at the end of legend mean “in the tank A” or “in the tank B”).
Fig. 13. The changes of nitrogen uptake rate with one-third of nutri-
ents’ concentrations as initial values (The literatures A or B at the
end of legend mean “in the tank A” or “in the tank B”).
concentration and uptake rate also go up by adding deep sea water, and consequently, total nitrogen uptake rate goes up, too (Fig. 13).
Therefore, one of the reason why we could not find clear dif- ferences between tank A and B is that NH4 concentration was too high in surface seawater.
6. INVESTIGATION INTO THE EFFECT OF OCEAN FERTILIZATION WITH THE
ECOSYSTEM MODEL
Because the model can represent the results of the experi- ment, we investigated the effect of ocean fertilization by deep sea water using this model with the parameters fixed above.
We used the temperature data measured in Oshima Island (JODC, 2010), and gave the light intensities as a cosine func- tion with annual cycle. We expressed deep sea water addition to surface seawater as following formula.
Ci+1=(CiV+CdVd dt)/(V+Vd dt)
={Ci+Cd(Vd dt/V)}/{1+(Vd dt/V)} (8) Here, Ci+1: concentration in the next time step [µmol/L], Ci: concentration in the present time step [µmol/L], Cd: concentra- tion into deep sea water [µmol/L], V: volume of the calcula- tion box [L], Vd: volume of the deep sea water which is added in a time step [L/dt], dt: time step. In the calculation, we gave
∆=(Vd dt/V) as the input rate of deep sea water.
We ran the model for 8 years with the same annual data in order to get rid of the influence of initial conditions and we show the data of the last 4 years which have come up to the steady states. Then, we compared the results in some cases.
Fig. 14 shows the result when
∆
=0.0 (without deep sea water), and Fig. 15 and Fig. 16 show the results with∆
=0.4 and∆
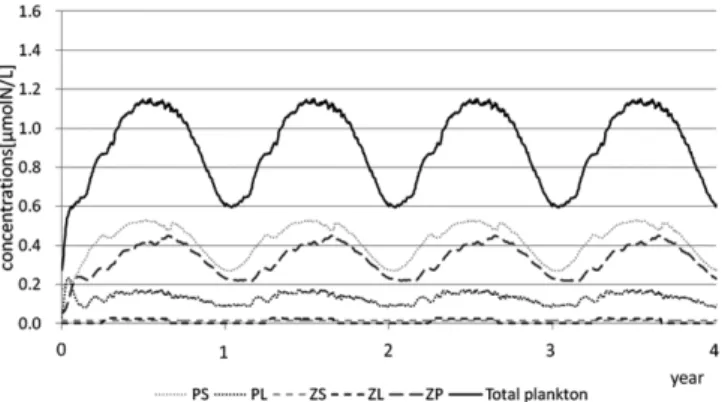
=0.04,respectively. In the both cases, deep sea water is added once a day at 0:00. When we compare Fig. 14 with Fig. 15, concen- tration of total plankton (all species of the plankton) in Fig.
15 is higher than that in Fig. 14 in summer, but it is lower in winter. So, it only results in that the gap of maximum and minimum becomes larger. The larger gap is not good for sta- ble food supply because the amount of feed for fish fluctu- ates by seasons. On the other hand, in Fig. 16, concentration of total plankton is higher than that in Fig. 14 through a year, which indicates we can get more desirable effect of ocean fer- tilization.
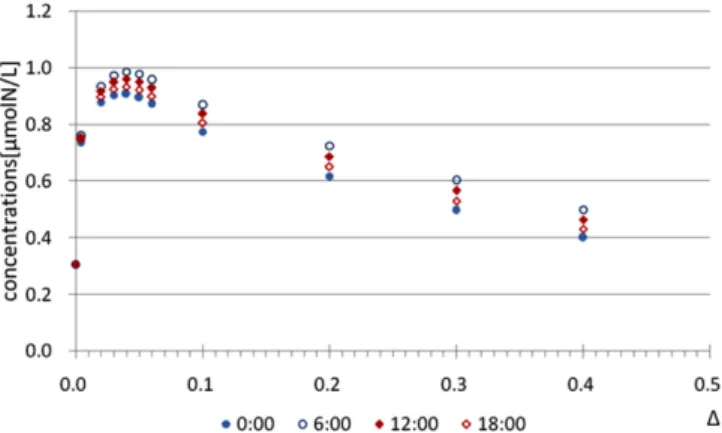
We conducted some calculations with various timings of deep sea water addition and various values of ∆. We tried four kinds of timings - 0:00, 6:00, 12:00 and 18:00, with consider- ation that photosynthesis occurs only in the daytime. Fig. 17 shows the relationship between the annual average concentra- tion of total plankton and two parameters (times and ∆). From this figure, it is found that the case of adding deep sea water at 6:00 with the rate of ∆=0.04 is the most effective combination
Fig. 14. The changes of the concentrations of plankton without deep
sea water ( ∆=0.0) (In this figure, the start of simulation is at year=0 and it shows the results for 4 years).
Fig. 15. The changes of the concentrations of plankton with ∆=0.4 at 0:00 (In this figure, the start of simulation is at year=0 and it shows the results for 4 years).
Fig. 16. The changes of the concentrations of plankton with ∆=0.04
at 0:00 (In this figure, the start of simulation is at year= 0 and it
shows the results for 4 years).
of two parameters among the cases we tried on this time.
About the timing of deep sea water addition, it is considered to be most effective to add deep sea water just before sunrise.
That is, 6:00 is the most effective timing among the four cases.
We also investigated the effect of ocean fertilization in the cases of adding deep sea water twice a day or adding continu- ously, but the effect of ocean fertilization is lower than that in the case of adding once a day (Fig. 18 and Fig. 19).
Consequently, we found that the effect of ocean fertilization hardly appeared when the interval of the addition of deep sea water was too short, or the amount of deep sea water was too much. It is supposed that if the addition of deep sea water is too frequent or too much, the dilution of plankton’s concentrations will exceed the effect of promoting phytoplankton’s photosyn- thesis.
7. CONCLUSIONS
In the present study, we developed the simulation technique for investigating the effect of ocean fertilization.
We could represent the changes of the plankton’s concentra- tions in the experiment tanks by literature survey and ecosys- tem model simulation. Besides, by examination of the results of experiment with ecosystem model, we revealed the signifi- cant factors for the plankton’s photosynthesis, and the reason why the effect of ocean fertilization was not recognized in the experiment.
Moreover, by the investigations into the effect of ocean fer- tilization with the ecosystem model, we found that the effect of ocean fertilization is declined when the interval of the addition of deep sea water was too short, or the amount of deep sea water was too much because the dilution of plankton’s concen- trations will exceed the effect of promoting phytoplankton’s photosynthesis.
However, there remain a problem - we could not represent the concentrations of zooplankton because of lack of data due to very small population density. It is expected that the model will be improved if this problem is resolved.
ACKNOWLEDGMENTS
This research is supported by Prof. Sato, T. (Univ. Tokyo), Prof. Tsuda, A. (Univ. Tokyo), Prof. Kishi, M.J. (Hokkaido Univ.), Prof. Fujii, M. (Hokkaido Univ.), and Prof. Okamoto, K. (Univ.
Tokyo). We gratefully acknowledge their cooperation. Also, we are supported by Oshima town office and Mr. Uematsu in the experiment at Senzu, Oshima Island. We express our appreciation for their cooperation. This research is partially supported by KAKENHI (20360389, 22360364).
Fig. 17. The relationship between ∆ and the annual average con- centration of total plankton in the case of adding deep sea water once a day.
Fig. 18. The relationship between ∆, the combination of adding times and the annual average concentration of total plankton in the case of adding deep sea water twice a day (“0&6” means adding deep sea water at 0:00 and 6:00, and the others in the same manner).
Fig. 19. The relationship between ∆ and the annual average con-
centration of total plankton in the case of adding deep sea water con-
tinuously.
REFERENCES