minen et al., 2018). 예를 들어 대기 오염도가 낮고 깨 끗한 환경인 해안가 (Kim et al., 2013; Song et al., 2010; O’Dowd et al., 1999), 극지역 (Park et al., 2004;
Leck and Bigg, 1999), 숲 (Suni et al., 2008; Makela et al., 1997), 교외지역 (Birmili et al., 2003)에서 에어로 졸의 생성과 성장이 빈번하게 관측되었다 . 또한 아틀 란타 (Woo et al., 2001), 아테네 (Kulmala et al., 2005), 헬싱키 (Hameri et al., 1996), 서울 (Park et al., 2015) 등의 도심지역에서도 에어로졸의 생성과 성장이 관 측되었으며 , 공통적으로 SO 2 의 농도가 낮아졌을 때 나타났다 . 대조적으로 멕시코시티 (Dunn et al., 2004), 피츠버그 (Stanier et al., 2004), 베이징 (Wu et al., 2007), 뉴델리 (Monkkonen et al., 2005)와 같은 오염 1. 서 론
에어로졸은 산업시설 , 자동차 등에서 대기 중으로 직접 배출되는 일차에어로졸 (primary particles)과 H 2 SO 4 , NH 3 와 같은 가스상 물질이 O 3 , OH, NO 3 와 같은 산화제에 의해 생성되는 이차에어로졸 (second- ary particles)로 구분된다. 이러한 에어로졸은 대기 중에서 태양빛을 직접적으로 산란·흡수하며 , 간접적 으로 구름의 성질을 변화시키는 것으로 보고되고 있 다 (IPCC, 2013). 또한 시정에 영향을 미칠 뿐만 아니 라 인체에 악영향을 미치는 것으로 보고되고 있다 (Baltensperger and Prevot, 2008). 대기 중에서 에어로 졸의 생성은 다양한 환경에서 관측되어 왔다 (Ker-
p-ISSN 1598-7132, e-ISSN 2383-5346
논 문
2016년 백령도에서 나타난 에어로졸 생성과 성장 특성
New Particle Formation and Growth at Baengnyeong Island in 2016
임병진 1) , 이민도 2) , 최진영 2) , 박승명 2) , 이상보 2) , 송미정 1),3), *
1)
전북대학교 지구환경과학과,
2)국립환경과학원,
3)전북대학교 지구환경시스템연구소
Byeongjin Lim 1) , Mindo Lee 2) , Jinyoung Choi 2) , Seung Myung Park 2) , Sang Bo Lee 2) , Mijung Song 1),3), *
1)
Department of Earth and Environment Science, Chonbuk National University
2)
National Institute of Environmental Research
3)
The Earth and Environmental Science System Research Center, Chonbuk National University
Abstract Although new particle formation can be the dominant contributor to particle number and size distribution in the atmosphere, the phenomena for particle formation are still poorly understood. Herein, we measured particle number size distributions (
>10 nm), gaseous species, PM
2.5, and meteorological parameters at Baengnyeong Island in South Korea from January to December, 2016. New particle formation events were observed on 14% of the measurement days under low relative humidity and sunny conditions. We classified the events visually into two classes. ‘Class 1’ is the days when the new mode of particles burst and the mode diameter grew clearly, and ‘Class 2’ is the days when the new mode of particles burst but the mode diameter fluctuated. We showed that the events were related to the SO
2concentrations. Compared to the Class 1, high concentrations of the SO
2were observed in the Class 2 when the fluctuation occurred. In addition, the concentrations of the CO, NO
2, and PM
2.5were increased in the Class 2. The average condensation sink and growth rate in the Class 2 were 9.2×10
-3s
-1and 3.3 nm h
-1, respectively.
Key words: New particle formation, SO
2, Baengnyeong Island
접수일 2018년 10월 18일 수정일 2018년 11월 27일 채택일 2018년 11월 29일
Received 18 October 2018 Revised 27 November 2018 Accepted 29 November 2018
*Corresponding author
Tel : +82-(0)63-270-3394
E-mail : [email protected]
된 대도시에서도 빈번하게 에어로졸의 생성이 관측 되었고 , 이때에는 높은 SO 2 의 농도에서 발생하는 특 징을 보였다.
핵 생성 (nucleation)은 가스 분자들이 응집되면서 클러스터를 형성하는 과정이다 . H 2 SO 4 은 핵 생성에 서 핵심적인 역할을 하는 물질로 알려져 있다 (Ker- minen et al., 2018; Kulmala et al., 2004). 여러 선행연 구에서 깨끗한 환경에서 에어로졸이 생성될 때 H 2 SO 4 와 H 2 O에 의한 이원 핵생성 (binary nucle- ation)이 주요한 에어로졸 생성 메커니즘임을 보여 주었다 (Kerminen et al., 2018; Kulmala et al., 2004;
Weber et al., 1997). PARFORCE (Particle formation and Fate in the Coastal Environment) 캠페인 기간 동 안에는 H 2 SO 4 뿐만 아니라 암모니아가 관여되는 삼 원 핵생성 (ternary nucleation)도 주요한 에어로졸 생 성 메커니즘이라고 제시되었다 (Kulmala et al., 2002).
또한 Kulmala (2003)은 H 2 SO 4 뿐만 아니라 유기성분 도 에어로졸의 생성과 성장에 관여되는 핵심 물질로 보고하였다.
현재까지 전 세계적으로 에어로졸의 생성 메커니 즘 규명과 에어로졸 생성이 일어나기 좋은 조건에 관
한 연구가 활발히 진행되고 있으나 , 다양한 환경에서 에어로졸의 생성 시 나타나는 특성에도 차이가 있어 관측자료가 부족한 실정이다. 본 연구에서는 2016년 1월~12월 백령도에서 관측된 에어로졸의 생성과 성 장 특성을 분석하였다 . 특히 에어로졸 생성 시 성장 변화 형태 따라 에어로졸 생성을 Class 1과 Class 2로 구분하여 각 Class에서 SO 2 를 비롯한 가스상 물질과 기상요인들의 특성을 비교하였다. 또한 백령도에서 에어로졸 생성과 비생성에서 나타난 가스상물질 , 입 자상물질 , 기상상태의 차이점을 분석하였다.
2. 연구 방법
2. 1 측정 장소
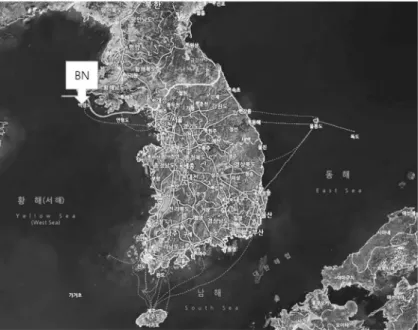
본 연구에서는 백령도 대기오염집중측정소에서 2016년 1월 1일부터 12월 31일까지 1년 동안 에어로 졸 생성과 성장을 관측하였다. 백령도 대기오염집중 측정소는 우리나라 최북단 (37°58ʹN, 124°37ʹE, 135 m a.s.l.)에 위치한 곳으로 중국 산둥반도로부터 약 180 km, 인천으로부터 약 190 km 떨어져 있고 인구밀도
Fig. 1. Map showing the sampling location of Baengnyeong Island (BN: Baengnyeong Island).
가 낮고 1차 오염물질의 농도가 낮은 배경대기 지역 이다 (그림 1).
2. 2 측정 방법
10 nm에서 469 nm의 입경별 수농도는 SMPS (Scanning Mobility Particle Sizer, TSI model 3080, USA)를 이용하여 5분 간격으로 측정하였다. 입경별 수농도는 2016년 1년 동안 300일이 측정되었다. 7~8 월은 장마로 인해 측정 일수가 현저히 적었다 (7월:
17일, 8월: 2일 측정). PM 2.5 질량 농도 (Thermo model TEOM 1400a, USA), 가스상물질 SO 2 (TELEDYNE API model 100A, USA), CO (Thermo model 48I-TLE, USA), O 3 (Thermo model 49c, USA), NO 2 (Thermo model 42c, USA), 기상요소 상대습도, 온도, 풍속, 풍 향 (LSI model LASTEM)은 백령도 관측소에서 측정 한 1시간 평균 자료를 이용하였다.
3. 결 과
3. 1 백령도 에어로졸 생성의 분류
본 연구에서 에어로졸의 생성은 25 nm 이하의 수
농도가 10,000 cm -3 이상으로 1시간 이상 급증할 때 로 정의하였다 (Park et al., 2015; Kim et al., 2013;
Song et al., 2010; Wu et al., 2007; Monkkonen et al., 2005; Dunn et al., 2004). 2016년 1~12월 백령도에서 나타난 에어로졸의 생성은 전체 측정 기간 300일 중 42일로 약 14% 기간 동안 관측되었다. 에어로졸 생성 과 성장이 나타났을 때 성장 변화 형태에는 뚜렷한 차이를 보였다 . 이러한 관측된 형태 차이와 Dal Maso et al. (2005)에서 제시한 분류 기준으로 백령도에서 나타난 에어로졸 생성/비생성을 4가지로 분류하였다.
첫째 , 25 nm 이하의 입경에서 수농도의 급증이 1시간 이상 지속되고 에어로졸의 성장이 바나나 모양의 형 태 (banana shape)를 보이는 것을 ‘Class 1’으로 정의 하였다. 둘째, 25 nm 이하의 농도 급증이 1시간 이상 뚜렷하게 나타나지만 성장 단계에서 변동 (fluctua- tion)이 나타나는 경우를 ‘Class 2’로 정의하였다. 셋 째, 25 nm 이상에서 입자의 수농도가 급증하는 경우 는 ‘undefined’로 정의하였다. 넷째, 어느 입경에서도 수농도 급증이 없을 때를 ‘non-event’로 정의하였다.
그림 2는 2016년 백령도에서 나타난 Class 1, Class 2, undefined, non-event의 사례를 보여준다. 그림 2a Fig. 2. Examples of size-distribution time series for (a) Class 1 (new particle formation and growth), (b) Class 2 (new particle formation and growth with fluctuation), (c) Undefined, and (d) Non-event.
D
p(nm) D
p(nm)
D
p(nm) D
p(nm)
10
225
10
225 15000
10000
5000
0
15000
10000
5000
0
15000
10000
5000
0 15000
10000
5000
0
dN/dlogD
p(cm
-3) dN/dlogD
p(cm
-3)
dN/dlogD
p(cm
-3) dN/dlogD
p(cm
-3)
00 03 06 09 12 15 18 21 24 00 03 06 09 12 15 18 21 24
00 03 06 09 12 15 18 21 24 00 03 06 09 12 15 18 21 24
10
225
10
225
(a) (b)
(c) (d)
는 2월 2일에 25 nm 이하의 수농도가 1시간 이상 급 증하고 성장이 뚜렷하며 banana shape을 보이는 Class 1의 사례이다. 그림 2b는 4월 4일에 관측된 에 어로졸 생성으로 Class 1과 비슷한 양상을 보이지만 성장하는 동안 변동이 나타나는 경우로 Class 2의 사 례이다 . 그림 2c는 9월 19일의 경우로 25 nm 이상의 수농도가 급증하는 Undefined에 해당한다. 그림 2d 는 2월 22일로 입경별 수농도 급증이 전혀 관측되지 않아 non-event로 구분하였다. 본 연구에서는 Class 1 과 Class 2를 에어로졸의 생성으로 정의하였고, Undefined와 non-event는 에어로졸 비생성으로 분류 하였다.
Class 1, Class 2, Undefined, non-event가 월별로는 어떤 차이를 보이는지 분석하였다 . 그림 3은 Class 1, Class 2, Undefined, non-event의 월별 발생 횟수와 빈 도수를 보여준다. 2016년 1~12월 동안 백령도에서 Class 1은 총 31회 발생하여 전체 측정일 중 약 11%
였고 , Class 2는 총 10회 발생하여 약 3%로 나타났다.
Undefined의 경우 총 20회로 전체 측정 기간 중 6%
발생하였고, non-event는 전체 기간 중 80%로 분석되 었다 (그림 3). 2016년 전체 측정 기간 동안 백령도에
서 non-event (80%)> Class 1 (11%)> Undefined (6%)>Class 2 (3%) 순으로 나타났다. 또한 2016년 백 령도에서의 에어로졸의 생성 (Class 1과 Class 2의 모 든 경우)은 1~2월 겨울철에 가장 많이 나타났고, 7~9월은 발생하지 않았다 (그림 3). 이는 여름에 장 마로 인한 세정효과와 높은 습도에 의해 pre-existing particles이 에어로졸 생성을 방해한 것으로 추정된다 (Vehkamaki et al., 2004).
3. 2 Class 1 과 Class 2 에서의 에어로졸 생성 특성
에어로졸의 생성과 성장이 하루 중 언제 빈번하게 발생하고 종료되는지 알아보기 위해 월별 에어로졸 생성과 종료 시간을 분석하였다 (그림 4). 2016년 백 령도에서 Class 1과 Class 2의 에어로졸 생성은 오전 10시에서 오후 3시 사이에 빈번하게 나타났다. 가장 빠르게는 오전 9시에 에어로졸의 생성이 관측되었 고 , 가장 느리게는 오후 3시경에 나타났다. Class 1의 경우 에어로졸의 생성은 오전 9시부터 15시까지 넓 게 분포하였고, 반면 Class 2의 경우 모두 12시 이전 에 발생하였다. 여러 선행 연구에서도 에어로졸의 생 Fig. 3. Number of days and frequency of Class 1, Class 2, Undefined, and non-event at Baengnyeong Island from January to December in 2016.
30
25
20
15
10
5
0
100 90 80 70 60 50 40 30 20 10 0
Number of days Fr equency (%)
May May
Apr Apr
Mar Mar
Feb Feb
Jan Jun Jul Aug Sep OctNov Dec Jan Jun Jul AugSep Oct Nov Dec
Month Month
Class 1 Class 2 Undefined Non-event
성은 주로 일사량이 증가하고 광화학반응이 관여되 는 일출 이후에서 정오 사이에 빈번하게 관측되는 것 으로 보고되었다. 1998년~2002년 핀란드의 Värriö에 서 에어로졸의 생성은 주로 낮 시간대에 나타났다 (Vehkamaki et al., 2004). 2004년 3월부터 2005년 2월 까지 베이징에서는 오전 6시부터 오전 10시 사이에 주로 에어로졸의 발생이 관찰되었다 (Wu et al., 2007). 또한 2008~2012년 제주도 고산에서 에어로졸 의 생성도 주로 오전 10시에서 정오 사이에 빈번하게 나타났다 (Kim et al., 2014).
SO 2 는 H 2 SO 4 의 주요한 가스상물질이고, 에어로졸 생성의 전구물질로 작용하며, 대기오염의 지표가 되 는 주요한 물질이다 . SO 2 농도와 에어로졸 생성 사이 의 연관성은 다양한 지역에서 연구되어 왔다 . 지역에 따라 SO 2 의 농도가 낮을 때 에어로졸 생성이 빈번하 게 관측되기도 하였고 혹은 SO 2 의 농도가 높을 때 에 어로졸 생성과 연관되었다 (Kerminen et al., 2018;
Young et al., 2013; Lee et al., 2008; Wu et al., 2007;
Kulmala et al., 2004; Birmili and Wiedensohler, 2000).
유럽 핀란드의 경우 SO 2 농도가 0.35 ppb 이하로 낮 을 때 에어로졸 생성이 빈번하였고 (Vehkamaki et al., 2004), 캐나다 Egbert 숲에서는 SO 2 의 농도가 1.5~
2.0 ppb 일 때 빈번하게 발생하였다 (Pierce et al., 2014). 그러나 중국 베이징에서는 SO 2 가 20~30 ppb
로 높은 농도에서 에어로졸 생성이 관측되었다 (Wu et al., 2007). 2005년 제주도에서는 SO 2 가 약 3 ppb 정 도일 때 에어로졸이 생성되었다 (Song et al., 2010).
본 연구에서 백령도에서 SO 2 농도가 에어로졸 생 성과 어떤 관계가 있는지 분석하였다 (그림 5). 2016 년 백령도에서 에어로졸의 생성은 SO 2 의 농도가 2.0
~3.0 ppb일 때 가장 빈번하게 발생하였다. 이러한 결 과는 2005년 봄철에 제주도에서 관측된 에어로졸 생 성 사례시의 SO 2 농도 범위와 매우 유사하다 (Song et al., 2010). 에어로졸 생성 시 Class 1, Class 2에서 SO 2
범위는 차이를 보였다 (그림 5). Class 1의 경우 SO 2
농도가 0~5.0 ppb 사이에서 넓은 범위에 분포한 반 면 Class 2의 경우 SO 2 농도 2.0 ppb 이상에서만 에어 로졸 생성이 나타났다 .
표 1은 2016년 전체 측정 기간 동안 Class 1과 2에 서 에어로졸 생성이 시작되었을 때의 SO 2 를 포함한 가스상물질과 PM 2.5 , 기상요인들의 평균값을 보여준 다 . 에어로졸의 생성이 관측되었을 때 Class 1과 2에 서 가스상물질의 농도는 현저한 차이를 보였다. 에어 로졸 생성 시 Class 1에서 SO 2 의 평균농도는 2.7 ppb, Class 2 SO 2 는 4.0 ppb로 Class 1에서 SO 2 의 농도가 낮 을 때 에어로졸의 생성이 관측되었다 . 뿐만 아니라 NO 2 , CO, O 3 의 농도도 Class 1에서 모두 낮았다. 또 한 PM 2.5 의 농도도 Class 1에서 10.4 μg m -3 , Class 2에 Fig. 4. The starting and ending time of new particle formation events (Class 1 and Class 2) at Baengnyeong Island.
24 21 18 15 12 09 06 03 00
Local time (h)
Jan Feb Mar Apr May Jun Jul Aug Sep Oct Nov Dec Month
Class 1 (starting time)
Class 2 (starting time)
Class 1 (ending time)
Class 2 (ending time)
서 18.8 μg m -3 로 Class 1에서 낮게 나타났다. 즉 2016 년 백령도에서 대기질이 깨끗한 환경에서 Class 1 (바 나나 형태의 에어로졸 생성)이 관측되었다. 깨끗한 Hyytiälä 숲에서는 SO 2 의 농도가 현저히 낮으며 이때 관찰된 에어로졸 생성과 성장은 바나나 형태로 나타 났다 (Riipinen et al., 2007). 반면에 유럽의 독일, 영국, 우크라이나 도심지역에서는 Class 1에 비해 Class 2의 형태 즉 성장 단계에서 변동이 빈번하게 관찰되었다 (Kristensson et al., 2008). 이때 SO 2 의 평균 농도는 핀 란드 , 덴마크의 깨끗한 환경에서의 SO 2 농도보다 약 2.8배 높은 수치였다. 또한 2007년 베이징에서도 오 염된 환경에서 나타난 에어로졸 성장 과정 중에는 변 동이 일어났다 (Wu et al., 2007).
본 연구에서 Class 1과 Class 2에서 25 nm 이하의 에어로졸의 생성은 뚜렷하였으나 생성 후 성장 동안 Class 2에서는 변동이 나타났다. Class 2에서 SO 2 의 농도 및 다른 가스상물질과 입자상물질의 농도 증가 도 현저하였다 . 입경별 수농도 분포와 대기오염물질 들의 농도를 종합해 볼 때, Class 2에서는 에어로졸의
생성이 시작된 직후 plume의 영향을 받았거나 혹은 국지적인 plume의 영향인 것으로 추정된다. Class 2 에서의 에어로졸 생성에 관한 명확한 결론을 위해서 는 좀 더 많은 자료를 이용하여 추가적인 연구가 필 요하다 .
표 1에서 Class 1과 Class 2에서의 상대습도, 온도, 풍속도 비교하였다. 상대습도의 경우 Class 1과 2에서 각각 46.8%, 44.4%로 큰 차이를 보이지 않았다. 온도 의 경우 Class 1 3.4℃, Class 2 9.5℃, 풍속은 각각 3.6 m s - 1 , 4.4 m s - 1 로 Class 1에서 온도와 풍속이 낮을 때 나타났다. Class 1과 2에서 풍속에는 차이가 있었으나 풍향은 모두 북서풍이 우세하게 나타났다.
에어로졸 성장속도 (growth rate)는 에어로졸 성장 시간 동안 로그 모드직경 (log-normal ultrafine mode diameter)의 변화율로 계산하였다 (표 2) (Song et al., 2010; Wu et al., 2007; Kulmala et al., 2005). ACE-Asia 와 TRACE-P 캠페인 동안 제주도 고산에서의 입자 생성은 약 2 nm h -1 로 보고되었고 (McNaughton et al., 2004), ABC-EAREX2005 기간 동안 안면도에서의 Table 1. The mean values with the standard deviation (std) of SO
2, NO
2, O
3, CO, PM
2.5concentrations, and meteorological parameters at the starting time of new particle formation for Class 1 and Class 2 events. (α =0.05)
Classification SO2 (ppb) NO2 (ppb) O3 (ppb) CO (ppb) PM2.5 (μg m-3) RH (%) T (°C) WS (m s-1)
Class 1 2.7±1.1 2.9±0.9 41.0±5.1 233.1±65.6 10.4±4.4 46.8±6.8 3.4±7.0 3.6±1.6
Class 2 4.0±1.9 6.0±3.5 51.3±11.3 320.4±122.1 18.8±12.8 44.4±10.8 9.5±9.8 4.4±3.4
Fig. 5. Number of new particle formation days according to SO
2concentrations.
15
10
5
0
Number of days
0~1.0 1.0~2.0 2.0~3.0 3.0~4.0 4.0~5.0 5.0~6.0
SO
2(ppb)
Class 1
Class 2
입자 생성은 2.0 ~ 5.8 nm h -1 였다 (Song et al., 2010).
2016년 백령도에서 에어로졸 생성시 Class 1과 2에서 의 평균 성장 속도는 각각 3.1, 3.3 nm h - 1 로 계산되었 다. 두 경우에서 에어로졸의 성장 속도에 큰 차이는 없지만 Class 2에서 약간 더 빠르게 성장하였다.
Condensation sink (CS)는 pre-existing particle에 sulfuric acid와 같은 전구물질이 응축되는 비율을 의 미한다. 본 연구에서는 아래 식 1을 이용하여 계산하 였다 (Kulmala, 1988).
CS=2πDΣiβ
MD
p,iN
n(1) 방정식에서 D는 확산계수 (0.104), β
M는 보정계수
(1.0), D
p,i는 에어로졸 크기 , N
n=수농도 (10~469 nm) 를 사용하였다 (Song et al., 2010; Wu et al., 2007).
2016년 백령도에서 Class 1과 2에서의 평균 CS는 각 각 5.9×10 -3 , 9.2×10 -3 s -1 로 Class 2에서 약간 높았 다 . ABC-EAREX2005 기간 동안 안면도에서의 입자 생성 시 CS는 1.5×10 -2 ~8.4×10 -2 s -1 였다 (Song et al., 2010). 마르세유에서 관측된 에어로졸 생성과 성 장 이벤트 기간 동안 CS는 3.2×10 -3 ~1.5×10 -2 s -1 였다 (Kulmala et al., 2005). 에어로졸 생성과 성장 시 성장속도와 CS는 Class 2에서 모두 높았다. 이러한 결 과로부터 preexisting particle에 응축되면서 제거된 전구물질과 에어로졸의 성장 사이에 연관성이 있다 는 것을 확인하였다 (Kulmala et al., 2005).
3. 3 에어로졸 생성과 비생성의 비교
백령도에서 에어로졸 생성이 일어나기 좋은 조건 을 알아보기 위해 에어로졸 생성에 주요한 역할을 하 는 것으로 알려진 SO 2 , CS, 온도, 상대습도 (Kerminen et al., 2018; Park et al., 2015; Wu et al., 2007; Kulmala et al., 2005, 2004; Weber et al., 1997)를 그림 6에 비교
Fig. 6. Averaged diurnal variation of (a) SO
2concentration, (b) condensation sink (CS), (c) temperature, and (d) relative humidity (RH) on the days of new particle formation (NPF) and non-new particle formation (non-NPF).
4.0 3.5 3.0 2.5 2.0
15 12 9 6 3 0
90 80 70 60 50 40 10×10
-38×10
-36×10
-34 ×10
-3SO
2(ppb) Temperatur e (° C) Relative humidity (%)
CS (s
-1)
4 8 12 16 20 24
Time (h)
4 8 12 16 20 24
Time (h)
4 8 12 16 20 24
Time (h)
4 8 12 16 20 24
Time (h)
NPF
non-NPF NPF
non-NPF
NPF
non-NPF NPF
non-NPF
(a) (b)
(c) (d) Table 2. Ranges of condensation sink (CS) and growth rate (GR) during new particle formation and growth of Class 1 and Class 2.
Classification CS(s-1) GR(nm h-1) Class 1 Class 2 Class 1 Class 2
mean 5.9×10⁻³ 9.2×10⁻³ 3.1 3.3
min 2.6×10⁻³ 3.3×10⁻³ 0.9 1.9
max 1.2×10-2 2.2×10⁻² 5.1 6.0
분석하였다 . SO 2 와 CS는 에어로졸 생성과 비생성을 비교하였을 때 뚜렷한 차이가 나타나지 않았다 (그림 6a, b). 3.2절에서 설명하였듯이 SO 2 농도는 에어로졸 생성 사례 시 Class 1 (SO 2 평균 농도: 2.8 ppb)과 2 (SO 2 평균 농도: 3.6 ppb)에서 뚜렷한 차이를 보였다.
반면 에어로졸 비생성시 SO 2 의 평균 농도는 2.8 ppb 로 나타났다. CS의 경우 에어로졸 생성 Class 1, Class 2와 비생성에서 모두 비슷한 값으로 나타났다.
에어로졸 생성 (Class 1, Class 2) 사례와 비생성 (undefined, non-event) 사례 시의 가장 특징적으로 차이를 보인 것은 상대습도와 온도였다 (그림 6). 온 도의 경우 겨울철에 에어로졸 생성이 빈번하여 (그림 3) 낮은 온도에서 에어로졸 생성이 나타났다 (그림 6c). 에어로졸 생성 시에 상대습도가 40~60%로 낮을 때 에어로졸 생성이 빈번하였다 (그림 6d). 반면 에어 로졸 비생성시에는 상대습도가 70~80%였다. 여러 선행연구에서도 상대습도가 낮을 때 에어로졸 생성 이 일어나기 좋은 조건임을 보고하였다 (Pierce et al., 2014; Song et al., 2010; Wu et al., 2007; Vehkamaki et al., 2004). 본 연구에서도 백령도에서 에어로졸이 생 성될 때 기상상태 또한 에어로졸의 생성에 중요한 역 할을 하는 것으로 보여진다 .
4. 결 론
백령도 2016년 1월부터 12월까지 1년간의 10 nm 이상의 입경별 수농도 자료를 이용하여 에어로졸 생 성 특성을 분석하였다 . 본 연구에서 에어로졸의 생성 은 25 nm 이하의 입자 수농도가 10,000 cm - 3 이상으 로 급증할 때로 정의하였고, 에어로졸 생성을 Dal Maso et al. (2005)에서 제시한 입경별 생성과 성장 변 화 형태 분류 기준으로 에어로졸 생성 (Class 1, Class 2). 에어로졸 비생성 (undefined, non-event)로 분류하 였다.
2016년 백령도에서 에어로졸의 생성은 겨울>봄
>가을>여름 순으로 빈번하게 발생하였다. 에어로 졸의 생성 시간은 대부분 오전 10시에서 오후 3시 사
이에 분포하였다 . 에어로졸의 생성은 주로 태양복사 량이 증가하는 정오 시간대에 잘 일어난다는 선행연 구의 결과와 동일하게 나타났다.
에어로졸 발생시 중요한 전구물질로 알려진 SO 2 의 농도를 분석한 결과 백령도에서 SO 2 2.0~3.0 ppb를 나타낼 때 에어로졸이 가장 빈번하게 생성되었다 . 에 어로졸이 생성되었을 때 Class 1과 Class 2의 가스상 물질과 입자상물질의 농도에 뚜렷한 차이를 보이며, 가스상 및 입자상 물질의 농도가 현저히 낮아질 때 Class 1 (banana shape 형태)이 빈번하게 발생하였다.
에어로졸 생성은 기상상태와 밀접한 관련을 보이며 상대습도가 낮을 때 일어나기 좋은 조건임을 보여주 었다 .
본 연구에서 배경대기 지역인 백령도에서 에어로 졸 생성과 성장 시 SO 2 , 상대습도와 태양복사량 같은 가스상물질들이 에어로졸 생성에 주요 인자로 작용 한다는 것을 보여주었다 . 또한 에어로졸 성장 시 SO 2
의 농도에 영향을 받는 것을 보여주었다 . 본 연구의 에어로졸 생성과 성장 특성 결과를 이용하여 백령도 에서 나타나는 에어로졸의 크기 분포, 질량농도를 이 해하고 더 나아가 에어로졸 생성과 성장이 기후에 미 치는 영향 및 인체에 미치는 영향 이해에 활용되길 기대한다.
감사의 글
이 논문은 2017년도 정부 (과학기술정보통신부, 환 경부, 보건복지부)의 재원으로 한국연구재단-미세먼 지 국가전략프로젝트사업 (2017M3D8A1092015)과 2018년도 전북녹색환경지원센터의 연구사업비 (18- 14-02-01-15)를 지원 받아 수행된 연구입니다.
References
Baltensperger, U., Prevot, A.S.H. (2008) Chemical analysis of atmospheric aerosols, Analytical and Bioanalytical
Chemistry, 390(1), 277-280.
Birmili, W., Wiedensohler, A. (2000) New particle formation in the continental boundary layer: Meteorological and gas phase parameter influence, Geophysical Res- earch Letters, 27(20), 3325-3328.
Buzorius, G., Rannik, U., Nilsson, D., Kulmala, M. (2001) Vertical fluxes and micrometeorology during aerosol parti- cle formation events, Tellus Series B-Chemical and Physical Meteorology, 53(4), 394-405.
Dunn, M.J., Jimenez, J.L., Baumgardner, D., Castro, T., McMurry, P.H., Smith, J.N. (2004) Measurements of Mexico City nanoparticle size distributions: Observations of new particle formation and growth, Geophysical Research Letters, 31(10), L10102.
Hameri, K., Kulmala, M., Aalto, P., Leszczynski, K., Visuri, R., Hamekoski, K. (1996) The investigations of aerosol particle formation in urban background area of Hel- sinki, Atmospheric Research, 41(3-4), 281-298.
Jimenez, J.L., Canagaratna, M.R., Donahue, N.M., Prevot, A.S.H., Zhang, Q., Kroll, J.H., DeCarlo, P.F., Allan, J.D., Coe, H., Ng, N.L., Aiken, A.C., Docherty, K.S., Ulbrich, I.M., Grieshop, A.P., Robinson, A.L., Duplissy, J., Smith, J.D., Wilson, K.R., Lanz, V.A., Hueglin, C., Sun, Y. L., Tian, J., Laaksonen, A., Raatikainen, T., Rautiainen, J., Vaattovaara, P., Ehn, M., Kulmala, M., Tomlinson, J.M., Collins, D.R., Cubison, M.J., Dunlea, E.J., Huff- man, J.A., Onasch, T.B., Alfarra, M.R., Williams, P.I., Bower, K., Kondo, Y., Schneider, J., Drewnick, F., Bor- rmann, S., Weimer, S., Demerjian, K., Salcedo, D., Cottrell, L., Griffin, R., Takami, A., Miyoshi, T., Hatakeyama, S., Shimono, A., Sun, J.Y., Zhang, Y.M., Dzepina, K., Kimmel, J.R., Sueper, D., Jayne, J.T., Herndon, S.C., Trimborn, A.M., Williams, L.R., Wood, E.C., Middlebrook, A.M., Kolb, C.E., Baltensperger, U., Worsnop, D.R. (2009) Evolution of Organic Aero- sols in the Atmosphere, Science, 326(5959), 1525- 1529.
Kerminen, V.M., Chen, X.M., Vakkari, V., Petaja, T., Kulmala, M., Bianchi, F. (2018) Atmospheric new particle forma- tion and growth: review of field observations, Envi- ronmental Research Letters, 13(10).
Kim, Y., Kim, S.W., Yoon, S.C. (2014) Observation of new particle formation and growth under cloudy conditions at Gosan Climate Observatory, Korea, Meteorology and Atmospheric Physics, 126(1-2), 81-90.
Kristensson, A., Dal Maso, M., Swietlicki, E., Hussein, T., Zhou, J., Kerminen, V.M., Kulmala, M. (2008) Characterization of new particle formation events at a background site in Southern Sweden: relation to air mass histo-
ry, Tellus Series B-Chemical and Physical Meteorolo- gy, 60(3), 330-344.
Kulmala, M. (2003) How particles nucleate and grow, Science, 302(5647), 1000-1001.
Kulmala, M., Korhonen, P., Napari, I., Karlsson, A., Berresheim, H., O’Dowd, C.D. (2002) Aerosol formation during PARFORCE: Ternary nucleation of H2SO4, NH3, and H2O, Journal of Geophysical Research-Atmospheres, 107(D19).
Kulmala, M., Laakso, L., Lehtinen, K.E.J., Riipinen, I., Dal Maso, M., Anttila, T., Kerminen, V.M., Horrak, U., Vana, M., Tammet, H. (2004) Initial steps of aerosol growth, Atmospheric Chemistry and Physics, 4, 2553-2560.
Kulmala, M., Petaja, T., Monkkonen, P., Koponen, I.K., Dal Maso, M., Aalto, P.P., Lehtinen, K.E.J., Kerminen, V.M. (2005) On the growth of nucleation mode particles: source rates of condensable vapor in polluted and clean environments, Atmospheric Chemistry and Physics, 5, 409-416.
Kulmala, M., Vehkamaki, H., Petaja, T., Dal Maso, M., Lauri, A., Kerminen, V.M., Birmili, W., McMurry, P.H. (2004) For- mation and growth rates of ultrafine atmospheric particles: a review of observations, Journal of Aero- sol Science, 35(2), 143-176.
Leck, C., Bigg, E.K. (1999) Aerosol production over remote marine areas - A new route, Geophysical Research Letters, 26(23), 3577-3580.
Lee, Y.G., Lee, H.W., Kim, M.S., Choi, C.Y., Kim, J. (2008) Charac- teristics of particle formation events in the coastal region of Korea in 2005, Atmospheric Environment, 42(16), 3729-3739.
Makela, J.M., Aalto, P., Jokinen, V., Pohja, T., Nissinen, A., Palm- roth, S., Markkanen, T., Seitsonen, K., Lihavainen, H., Kulmala, M. (1997) Observations of ultrafine aerosol particle formation and growth in boreal forest, Geo- physical Research Letters, 24(10), 1219-1222.
Maso, M.D., Kulmala, M., Riipinen, I., Wagner, R., Hussein, T., Aal- to, P.P., Lehtinen, K.E.J. (2005) Formation and growth of fresh atmospheric aerosols: eight years of aerosol size distribution data from SMEAR II, Hyytiälä, Fin- land Boreal, Environment Research, 323-336.
Monkkonen, P., Koponen, I.K., Lehtinen, K.E.J., Hameri, K., Uma, R., Kulmala, M. (2005) Measurements in a highly polluted Asian mega city: observations of aerosol number size distribution, modal parameters and nucleation events, Atmospheric Chemistry and Physics, 5, 57-66.
Park, J., Sakurai, H., Vollmers, K., McMurry, P.H. (2004) Aerosol size distributions measured at the South Pole dur-
ing ISCAT, Atmospheric Environment, 38(32), 5493- 5500.
Park, M., Yum, S.S., Kim, J.H. (2015) Characteristics of submi- cron aerosol number size distribution and new par- ticle formation events measured in Seoul, Korea, during 2004-2012, Asia-Pacific Journal of Atmo- spheric Sciences, 51(1), 1-10.
Pierce, J.R., Westervelt, D.M., Atwood, S.A., Barnes, E.A., Leaitch, W.R. (2014) New-particle formation, growth and cli- mate-relevant particle production in Egbert, Cana- da: analysis from 1 year of size-distribution observa- tions, Atmospheric Chemistry and Physics, 14(16), 8647-8663.
Riipinen, I., Sihto, S.L., Kulmala, M., Arnold, F., Dal Maso, M., Bir- mili, W., Saarnio, K., Teinila, K., Kerminen, V.M., Laak- sonen, A., Lehtinen, K.E.J. (2007) Connections between atmospheric sulphuric acid and new parti- cle formation during QUEST III-IV campaigns in Hei- delberg and Hyyti, Atmospheric Chemistry and Physics, 7(8), 1899-1914.
Smith, J.N., Moore, K.F., Eisele, F.L., Voisin, D., Ghimire, A.K., Sak- urai, H., McMurry, P.H. (2005) Chemical composition of atmospheric nanoparticles during nucleation events in Atlanta, Journal of Geophysical Research Atmospheres, 110(D22), D22S01.
Song, M., Lee, M., Kim, J.H., Yum, S.S., Lee, G., Kim, K.-R. (2010) New particle formation and growth in relation to vertical mixing and chemical species during ABC- EAREX2005, Atmospheric Research, 97(3), 359-370.
Stanier, C.O., Khlystov, A.Y., Pandis, S.N. (2004) Nucleation events during the Pittsburgh air quality study:
Description and relation to key meteorological, gas phase, and aerosol parameters, Aerosol Science and Technology, 38, 253-264.
Suni, T., Kulmala, M., Hirsikko, A., Bergman, T., Laakso, L., Aalto, P.P., Leuning, R., Cleugh, H., Zegelin, S., Hughes, D., van Gorsel, E., Kitchen, M., Vana, M., Horrak, U., Mirme, S., Mirme, A., Sevanto, S., Twining, J., Tadros, C. (2008) Formation and characteristics of ions and charged aerosol particles in a native Australian Eucalypt forest, Atmospheric Chemistry and Phys- ics, 8(1), 129-139.
Uhrner, U., Birmili, W., Stratmann, F., Wilck, M., Ackermann, I.J.,
Berresheim, H. (2003) Particle formation at a conti- nental background site: comparison of model results with observations, Atmospheric Chemistry and Physics, 3, 347-359.
Vehkamäki, H., Maso, M.D., Hussein, T., Flanagan, R., Hyvärinen, A., Lauros, J., Merikanto, J., Mönkkönen, P., Pihlatie, M., Salminen, K., Sogacheva, K., Thum, T., Ruus- kanen, T.M., Keronen, P., Aalto, P.P., Hari, P., Lehtinen, K.E.J., Rannik, U., Kulmala, M. (2004) Atmospheric particle formation events at Värriö measurement station in Finnish Lapland 1998-2002, Atmospheric Chemistry and Physics, 2015–2023.
Weber, R.J., Marti, J.J., McMurry, P.H., Eisele, F.L., Tanner, D.J., Jef- ferson, A. (1997) Measurements of new particle for- mation and ultrafine particle growth rates at a clean continental site, Journal of Geophysical Research- Atmospheres, 102(D4), 4375-4385.
Woo, K.S., Chen, D.R., Pui, D.Y.H., McMurry, P.H. (2001) Measure- ment of Atlanta aerosol size distributions: Observa- tions of ultrafine particle events, Aerosol Science and Technology, 34(1), 75-87.
Wu, Z., Hu, M., Liu, S., Wehner, B., Bauer, S., Ma ßling, A., Wie- densohler, A., Petäjä, T., Maso, M.D., Kulmala, M.
(2007) New particle formation in Beijing, China: Sta- tistical analysis of a 1-year data set, Journal of Geo- physical Research, 112(D9), D09209.
Young, L.H., Lee, S.H., Kanawade, V.P., Hsiao, T.C., Lee, Y.L., Hwang, B.F., Liou, Y.J., Hsu, H.T., Tsai, P.J. (2013) New particle growth and shrinkage observed in subtrop- ical environments, Atmospheric Chemistry and Physics, 13(2), 547-564.
Authors Information
임병진 (전북대학교 지구환경과학과 학부생) 이민도 (국립환경과학원 연구관)
최진영 (국립환경과학원 연구사) 박승명 (국립환경과학원 연구사) 이상보 (국립환경과학원 연구관)
송미정 ( 전북대학교 지구환경과학과 교수,
전북대학교 지구환경시스템연구소 겸임연구원)